Abstract
Molecular diagnostics, i.e. the detection and analysis of disease-related changes of DNA or RNA, is becoming ever more important for the diagnosis of bone marrow (BM) neoplasms. In modern BM haematopathology, molecular diagnostics should always be part of an integrated diagnostic approach including clinical information, morphology and immunophenotyping. It is the responsibility of the haematopathologist to interpret the information gathered and to produce a final diagnosis. For this purpose, the practising haematopathologist must be familiar with the various molecular techniques needed and possess an in-depth knowledge of their applications for the diagnosis of BM neoplasms. The first part of this chapter focuses on the most important molecular techniques currently used in everyday diagnostics in the modern haematopathological laboratory. The second part highlights the major molecular and genetic aberrations of diagnostic value across the different haematological disease entities. Ideally the haematopathological laboratory should either be able to perform the relevant tests or be in close cooperation with a laboratory performing them for optimal diagnostics. Such cooperations also include multidisciplinary conferences, where clinicians and haematopathologists meet to discuss the diagnoses of afflicted patients.
Introduction
Molecular diagnostics, i.e. the detection and analysis of disease-related changes of DNA or RNA, is becoming ever more important for the diagnosis of bone marrow (BM) neoplasms. In modern BM haematopathology, molecular diagnostics should always be part of an integrated diagnostic approach including clinical information, morphology and immunophenotyping. It is the responsibility of the haematopathologist to interpret the information gathered and to produce a final diagnosis. For this purpose, the practising haematopathologist must be familiar with the various molecular techniques needed and possess an in-depth knowledge of their applications for the diagnosis of BM neoplasms. The first part of this chapter focuses on the most important molecular techniques currently used in everyday diagnostics in the modern haematopathological laboratory. The second part highlights the major molecular and genetic aberrations of diagnostic value across the different haematological disease entities. Ideally the haematopathological laboratory should either be able to perform the relevant tests or be in close cooperation with a laboratory performing them for optimal diagnostics. Such cooperations also include multidisciplinary conferences, where clinicians and haematopathologists meet to discuss the diagnoses of afflicted patients.
DNA and RNA Extraction
Perhaps needless to say, high-quality nucleic acids are a prerequisite for adequate molecular diagnostics. There is a plethora of protocols for nucleic acid extraction depending on the type of specimen and on the quality and amount of DNA or RNA needed for the particular assay. Both solid- and solution-phase approaches of extraction can be used. Fresh BM cell suspension is preferred for both DNA and RNA extraction but effective isolation can nowadays be performed from both BM smears and paraffin-embedded BM clots or BM biopsies (BMB). Sometimes peripheral blood will be the relevant source of DNA or RNA.
Major Molecular Diagnostic Techniques
This section deals with molecular techniques required or highly recommended for current accurate diagnosis of BM neoplasms according to the 2016 WHO classification [1]. The techniques include polymerase chain reaction (PCR) with variations, next-generation sequencing (NGS; also based on PCR) and fluorescence in situ hybridization (FISH). Many other relevant techniques are more often used in a research setting and as of yet not required for disease classification, although they may add valuable diagnostic or prognostic information. These include, for example, comparative genomic hybridization [2], single nucleotide polymorphism (SNP) arrays [3] and digital PCR [4] for DNA analyses. For analyses of RNA, gene expression arrays [5], RNA sequencing (RNAseq) [6] and nanostring technologies [7] are important research tools. In addition, techniques for detection of epigenetic changes (e.g. methylation patterns) [8] may prove valuable for the diagnosis, but are not considered necessary and are also beyond the scope of this chapter. Some of these techniques are likely to be incorporated in the diagnostic work-up of haematological neoplasms in the future. Southern blot has been replaced by PCR for diagnostic purposes and is not discussed.
Polymerase Chain Reaction
The technology to perform DNA synthesis in a test tube, producing virtually unlimited copies of a specific DNA fragment in a few hours by PCR, was developed by Kary Mullis, who was awarded the Nobel prize in 1993 for his discovery [9]. This method has since then become an invaluable tool for many different applications including DNA cloning and analysis. The key to this method is the discovery of thermostable DNA polymerase (Taq polymerase) isolated from a bacterial strain (Thermus aquaticus) living in hot springs [10]. DNA replication in multiple cycles is an exponential process, which may start from a single DNA molecule and end with many millions of copies. However, double-stranded DNA has to be denaturated before DNA synthesis, i.e. the two strands have to be separated. Denaturation in vitro can be done by heating DNA to 96°C but this will destroy the DNA polymerase from most organisms. By using thermostable Taq polymerase for DNA synthesis, a sample can be heated many times while keeping enzymatic activity intact.
Principles of Polymerase Chain Reaction
Four main components are required for PCR.
1. DNA serving as template for DNA replication.
2. A pair of specifically designed DNA primers, which hybridize (anneal) to exactly defined positions at the template; DNA synthesis occurs in the region between these primers.
3. The building stones for DNA: all four deoxynucleotides (dATP, dTTP, dCTP and dGTP).
4. Taq polymerase or another thermostable DNA polymerase.
In addition to these, salt concentration (e.g. Mg2+) and pH are critical as well as a thermocycler, which is programmed to heat and cool the samples according to a given scheme.
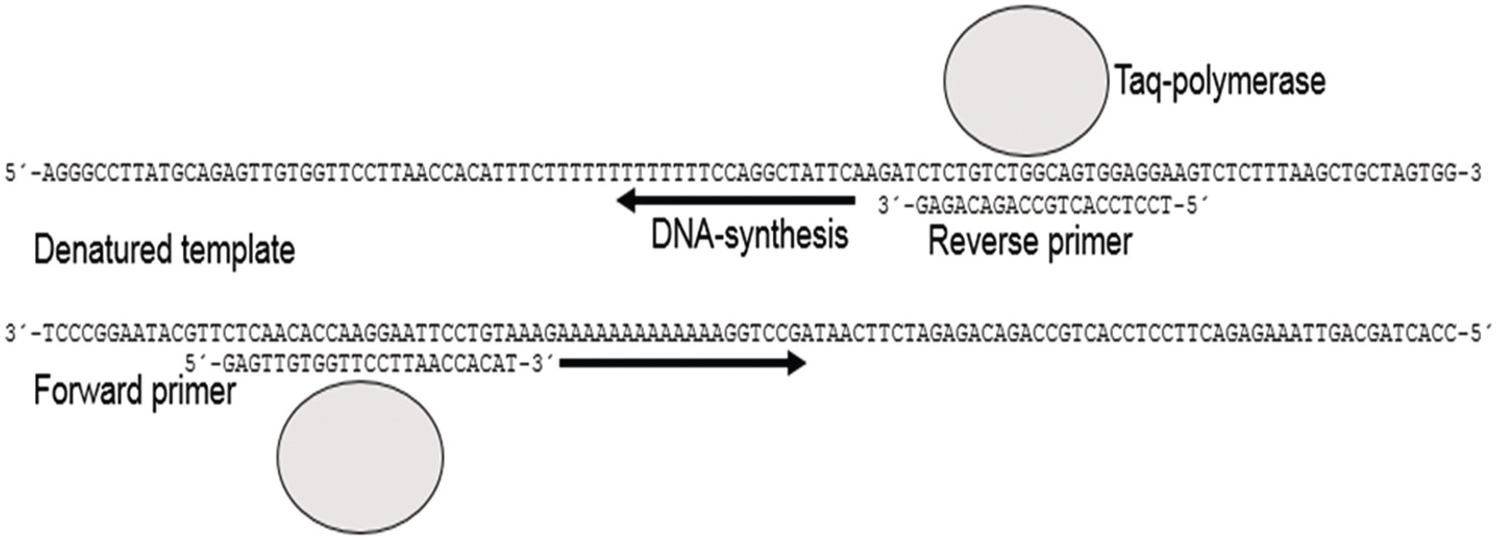
For clinical applications the DNA template is prepared from a tissue sample. The primer pair is designed to target the genomic DNA region to be analyzed. The DNA sequence from the desired genomic region is available from many different databases such as NCBI BLAST () or Ensembl (www.ensembl.org). For a typical PCR analysis, the DNA template, primers and Taq polymerase are mixed in a buffer containing Mg2+ and other supplements to a final volume of 20 to 50 µL. The test tube is then placed in the PCR-thermocycler, which will heat and cool the sample according to the following general principles in a sequence of events (Figures 20.1 and 20.2).
1. Denaturation 1: the double-stranded DNA template is denatured, i.e. separated to single strands by heating to near boiling temperature, often 95 to 96°C. This first denaturation is usually completed in 3 to 10 minutes.
2. Annealing: temperature is lowered to about 50 to 68°C depending on the composition of the primers for a couple of seconds to allow the primers to anneal to their targets at the template.
3. Extension: temperature is elevated to 72°C, which is the optimal temperature for Taq polymerase to perform DNA synthesis.
4. Denaturation 2: DNA is denatured again as in step 1 but for a shorter time, since the complexity of the DNA products (amplicons) formed at step 3 is much lower than for the entire genome.
5. Steps 2 to 4 are repeated for 30 to 40 times.
Figure 20.1 Double-stranded DNA is denatured to single strands by heating. By lowering the temperature the primers (forward and reverse) will anneal to complementary sequences of the single-stranded template. Heating to 72°C initiates DNA synthesis by Taq polymerase and nucleotides (not shown). The procedure is repeated 30 to 40 times to achieve exponential multiplication of the target region of DNA. One single DNA molecule would in this way theoretically amplify to more than a billion copies in 30 cycles.
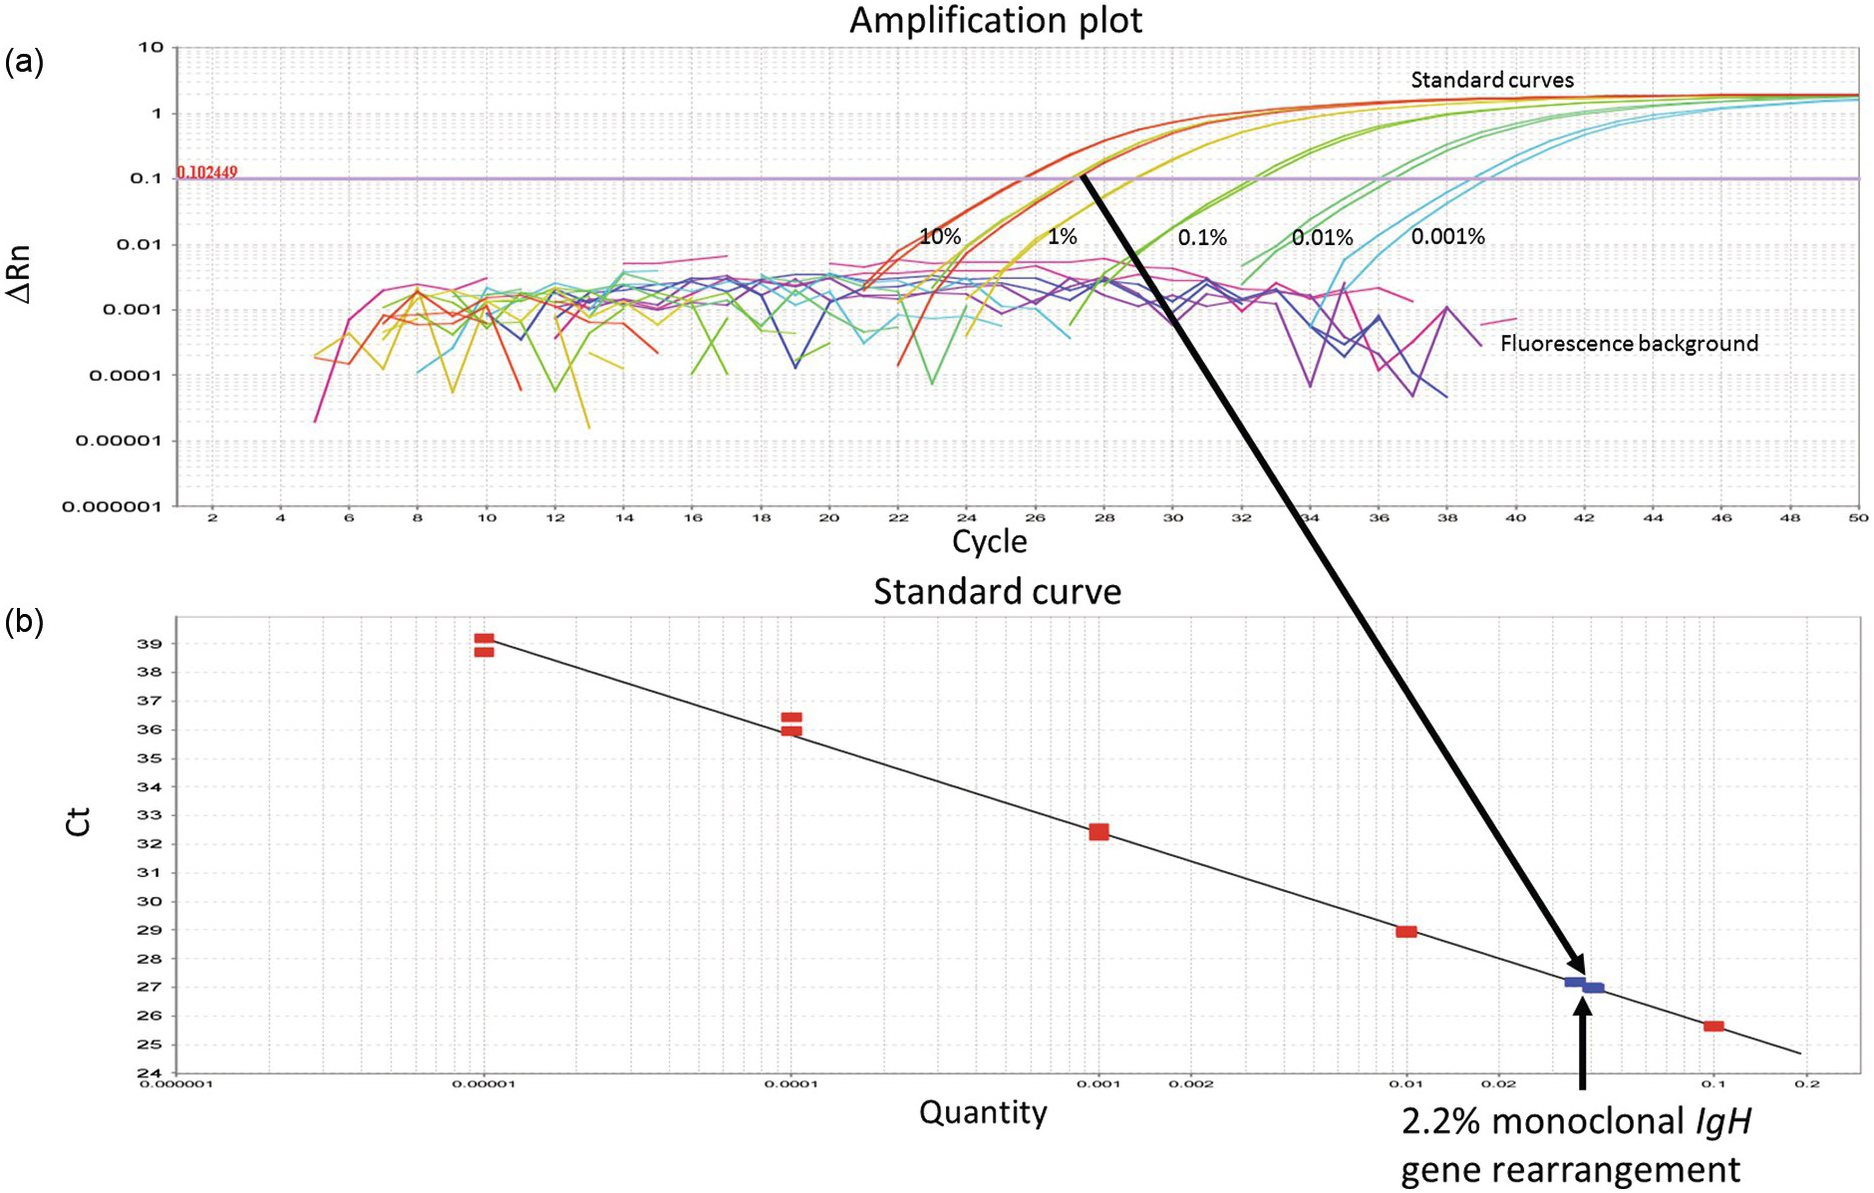
Figure 20.2 (a) Real time quantitative PCR (qPCR) to determine minimal residual disease after completion of therapy in a patient afflicted by B-lymphoblastic leukaemia. Serial dilutions of the diagnostic leukaemic sample (in duplicates) with amplification of the monoclonal IgH gene rearrangement found at diagnosis (standard curves). The diagnostic sample is assumed to contain 100% leukaemic blasts or 100% of the targeted DNA (i.e. in this case the IgH gene rearrangement). In reality, the percentage of leukaemic cells or the targeted DNA may be slightly less if mononuclear cells were isolated for DNA extraction, because of contamination of mononuclear cells other than leukaemic blasts, such as lymphocytes and monocytes. The cycle threshold (Ct-value) is chosen at a point where the amplification curves are convincingly exponential and exceed background levels (0.102449 in this example). The Ct-value, i.e. the number of cycles required to cross the threshold, is inversely proportional to the concentration of the targeted DNA in each sample. (b) By determining the Ct-value of a follow-up sample after treatment (in triplicates; arrows), its concentration of the targeted DNA can be calculated from the known concentrations of the serially diluted diagnostic sample (standard curve). By mere visual inspection of the follow-up sample (arrows), the concentration of the residual leukaemic DNA (the monoclonally rearranged IgH gene) appears to be between 1 and 10%. Exact calculation revealed 2.2% leukaemic DNA, translating into 2.2% residual leukaemic cells. ∆Rn – intensity of the fluorescence signal adjusted for fluorescence background and internal standard dye. The ∆Rn value is proportional to the DNA concentration (log-10 scale).
These general principles are fine tuned for every DNA target using different temperatures and incubation times. The final PCR products can then be analyzed using gel electrophoresis or capillary electrophoresis to determine their presence, absence or size. These methods are based on the fact that the negatively charged DNA molecules are separated by size as they migrate in an electric field.
Real Time Quantitative PCR (qPCR)
The aim of PCR is often to determine the number of specific templates present in a given sample. In molecular diagnostics of leukaemia, for example, one may want to quantify remaining leukaemic cells (minimal residual disease), harbouring a known mutation, following chemotherapy. PCR as described above is, however, not quantitative under standard conditions. This is mainly explained by the fact that the PCR primers are consumed resulting in a gradual transition from exponential amplification to a plateau phase of low or no amplification. The number of specific DNA copies present before PCR can only be calculated with mathematical precision from a point where DNA is amplifying exponentially (Figure 20.2).
The exponential phase of PCR can be determined using real time quantitative PCR (qPCR) where the amount of PCR product is measured after each cycle by fluorescence labelling [11]. ‘Real time’ means that the amplified product can be visualized during the PCR reaction. Hence the number of cycles (the Ct-value) required to achieve a certain fluorescence level (the threshold value where amplification is exponential) is used to calculate the original number of DNA copies. For absolute quantification, i.e. calculating DNA copies or concentration, samples with known concentration of DNA are often needed as standards (Figure 20.2). Otherwise it may be sufficient to determine the relative amounts of DNA in different samples without the use of standard curves.
Reverse Transcription PCR (RT-PCR)
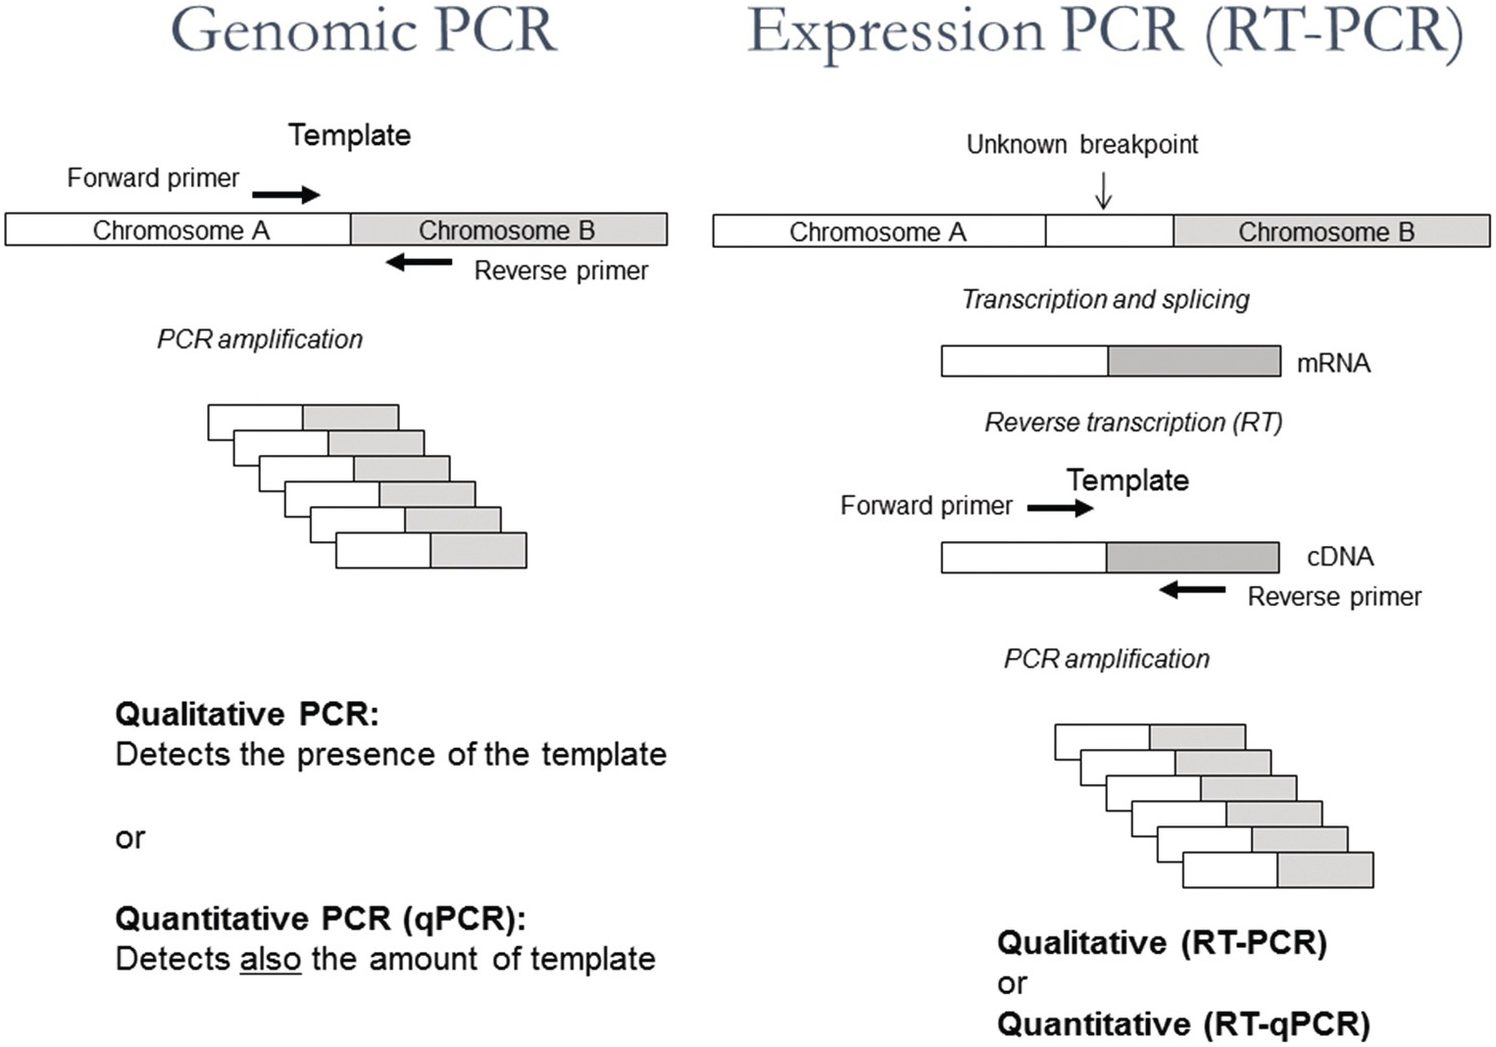
Polymerase chain reaction can also be used to determine the presence of specific RNA molecules or to quantify them in cells at a given time point in order to study expression of specific genes or the presence of, for example, RNA viruses or fusion transcripts like BCR-ABL. However, the RNA first needs to be transcribed to complementary DNA (cDNA) using the enzyme reverse transcriptase. As a primer for cDNA synthesis, a short sequence of DNA exclusively built from deoxi-T nucleotides (oligo-dT) can be used. Oligo-dT is complementary to the poly-A tail present at the end of all messenger RNA (mRNA) molecules and can thus serve as a general primer for DNA synthesis, resulting in the generation of one cDNA copy of each mRNA-molecule (Figure 20.3).
Figure 20.3 Schematic representation of the principles of genomic PCR, genomic quantitative PCR (qPCR), expression PCR (RT-PCR) and quantitative expression PCR (RT-qPCR).
At the following step a specific primer pair for qPCR is added together with taq polymerase enabling exponential amplification of a specific cDNA molecule. Using conditions as for qPCR, the reaction will become quantitative and the amount of RNA from different samples can be compared. This combined reaction of cDNA synthesis and qPCR is often called RT-qPCR and should not be confused with ‘real time PCR’ (= qPCR), which may or may not be preceeded by cDNA synthesis (Figure 20.3).
Next-Generation Sequencing
Since the seventies, Sanger sequencing (named after the Nobel prize laureate Frederick Sanger) has been the golden standard for DNA sequencing [12]. Using this method, nucleotide information can be obtained from a short stretch, up to 1,000 base pairs, of any genome or recombinant DNA. Taking into consideration the size of the human genome, 3 billion basepairs, Sanger sequencing is not suitable for sequencing at the genomic level. It took ten years to complete a draft of the human genome using this method and, since then, scientists have developed a new approach for sequencing called ‘next-generation sequencing’ (NGS) or ‘massive parallel sequencing’ (MPS). Next-generation sequencing is now widely used to obtain within a few days information on an unlimited number of genes simultaneously [13]. It can also be used clinically to identify single genetic variants for diagnostic or prognostic purposes or to predict drug response.
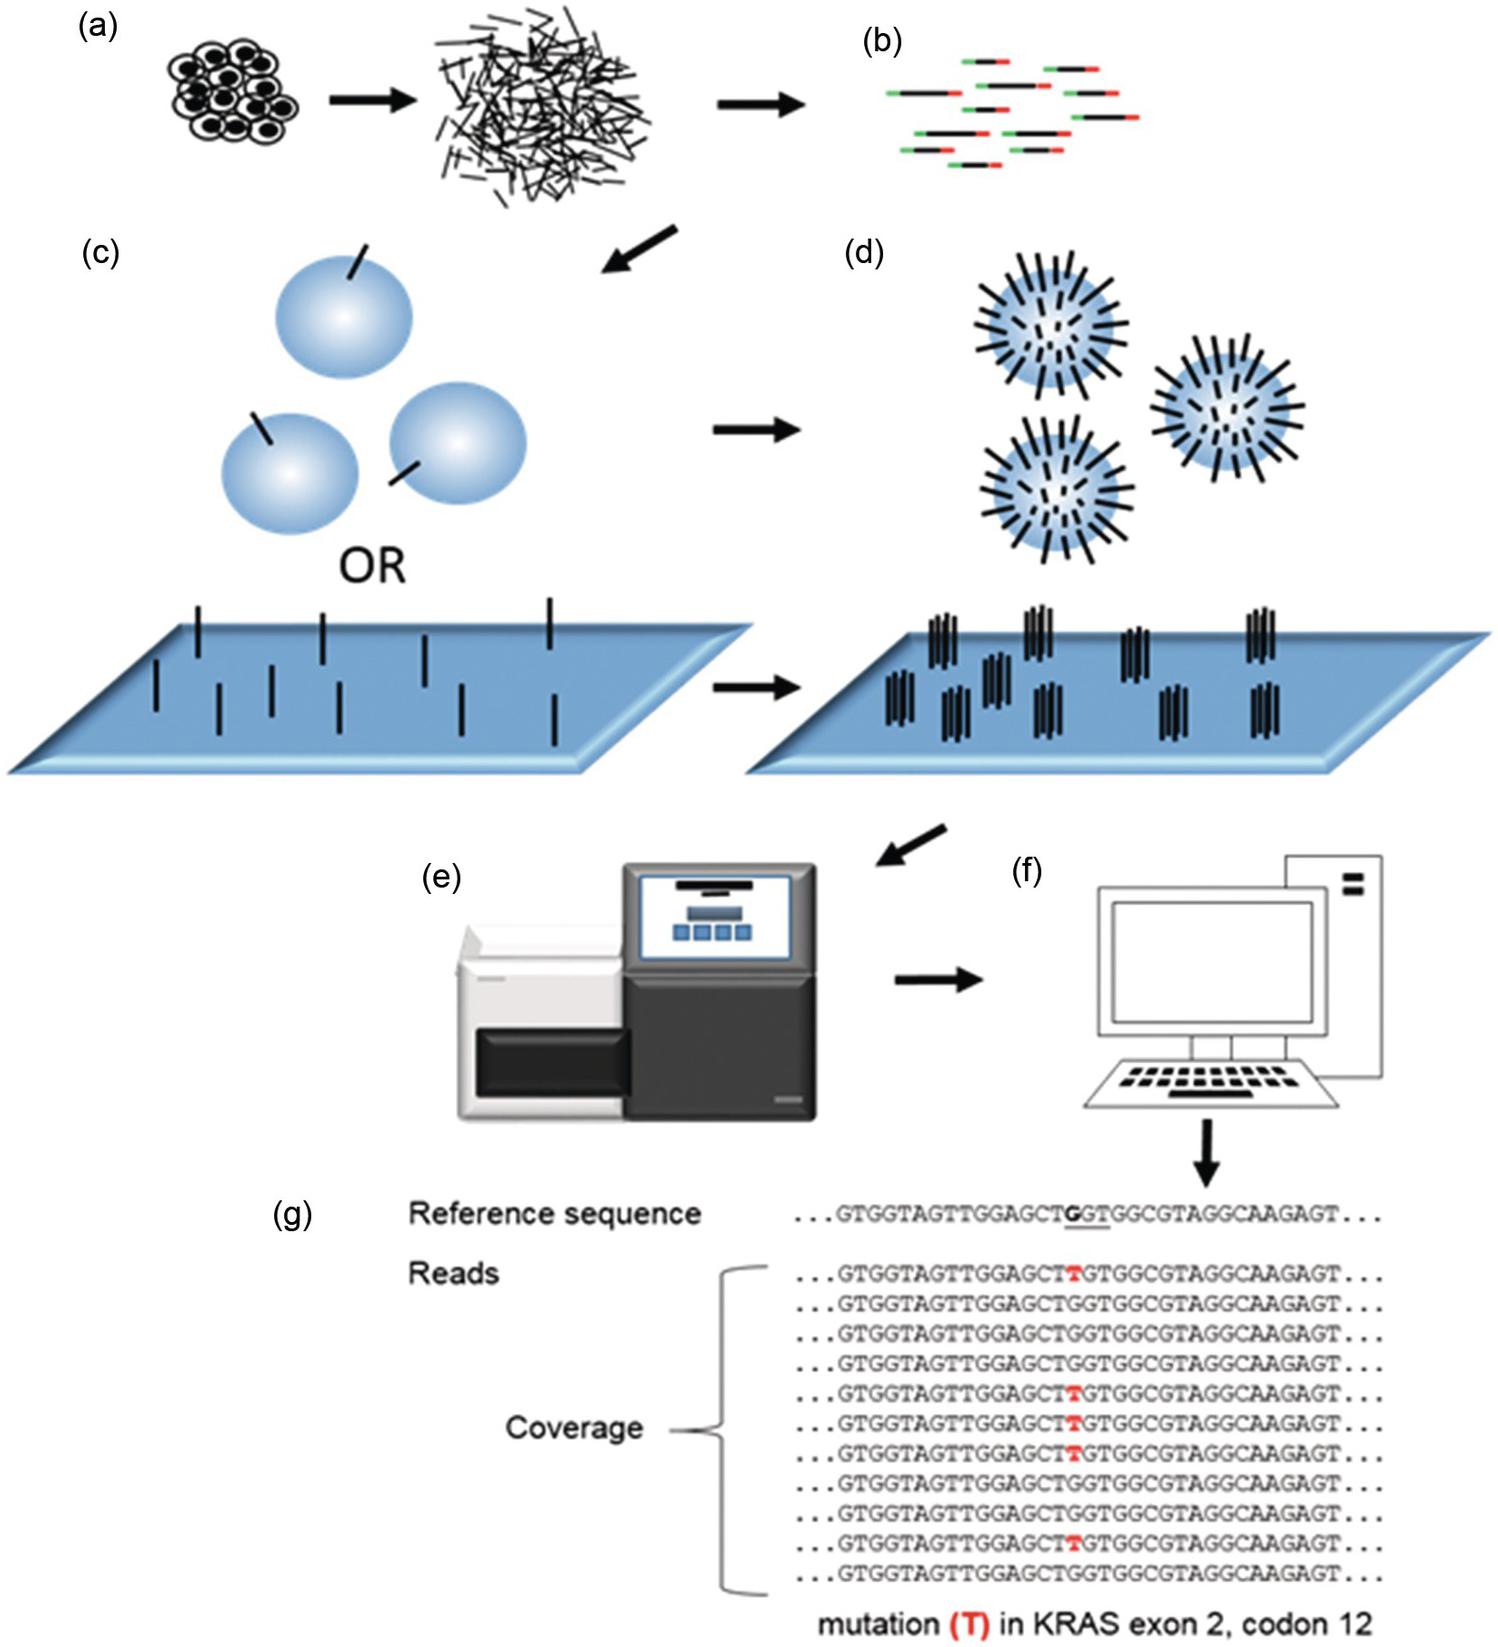
Using different technologies and chemical set-ups a number of NGS platforms have been developed by several companies. Despite many important differences they all are built on seven fundamental steps (Figure 20.4).
Figure 20.4 General principles of next-generation sequencing (NGS) or massive parallel sequencing (MPS). (a) DNA fragments are prepared from a tissue in the form of a fragmented genome, cDNA or PCR fragments. (b) A DNA library consisting of fragmented DNA plus adapters (red and green) serving (1) to attach the fragments to a solid support by hybridization (2) to form a single origin for DNA synthesis (3) as a barcode to identify individual samples. (c, d) Library-DNA attached to a solid support exemplified by a glass sheet (c) or microspheres (d). Single library molecules are then amplified to clusters of clonal (identical) DNA on the glass sheet (c). Alternatively, microspheres will be covered with clonal DNA after amplification (d). Each cluster on the glass sheet or microsphere will correspond to a read following sequencing, and the number of reads of the same sequence refers to the coverage. (e) Sequencing instrument adding nucleotides to the immobilized clones of DNA and reading signals following each addition. (f) Data are transferred to a computer for bioinformatic analysis. (g) Multiple reads of a DNA sequence from the oncogene KRAS aligned to a reference sequence. A mutation in exon 2, codon 12 (underlined), frequently associated with cancer, is shown. Note that the coverage (11 reads) and variant frequency (VAF = 5/11 = 45%) indicated by the figure is not typical for tumour tissues, which rather would demonstrate a lower VAF requiring 200 to 2,000 reads to prove the presence of a mutation.
Principles of Next-Generation Sequencing
1. Fragmentation of DNA
Short DNA fragments are generated from the genome by direct physical (shearing) or enzymatic fragmentation or by creating many specific DNA fragments using PCR or by transcribing RNA to DNA (complementary DNA, cDNA) (Figure 20.4a).
2. Constructing a DNA library
A DNA library is constructed by ligating short adapter sequences to both ends of the DNA fragments. These adaptors have different functions. First, they are used to attach the library sequences to a solid support by hybridization. They are also used as targets for a primer sequence that initiates DNA synthesis during sequencing. A very useful feature of adapters is that they usually include short unique sequences (barcodes), which will identify each sample, making it possible to mix and analyse them in the same run (Figure 20.4b).
3. Attaching the DNA library to a solid support
The DNA library is attached to a solid support: a glass sheet (flow cell) or microsphere using the adapter sequences, which are complementary to adapter sequences present on the solid support (Figure 20.4c).
4. Amplification of the library on the solid support
The library sequences on the solid support have to be amplified by PCR so that clones with identical sequences are formed in order to generate sufficiently strong signals during sequencing (Figure 20.4d). On a glass sheet (flow cell) clonal clusters will form while on microspheres each sphere will represent a clone of a DNA fragment.
5. Sequencing reaction by using one single primer for DNA synthesis
One of the most striking features with NGS in comparison to Sanger sequencing is that only one primer sequence is needed to initiate DNA synthesis from the adaptors, since all adaptors have the same primer sequence. Following priming, deoxynucleotides (dATP, dTTP, dCTP and dGTP) are added and washed away one at a time to the immobilized library in a sequencing instrument (Figure 20.4e). Only nucleotides complementary to the growing DNA chain of each clone will be incorporated.
6. Detection system for nucleotides added and incorporated one by one during DNA synthesis
Each nucleotide added and incorporated into DNA has to be detected in some way (Figure 20.4e). Glass sheets (flow cells) are scanned by a microphotographic system that detects fluorescence from labelled nucleotides incorporated to each cluster of amplified DNA. Alternatively, microspheres are loaded onto a semiconductor chip with millions of wells, one for each sphere. During sequencing, one hydrogen ion is released for each nucleotide incorporated, which produces an electric signal that can be detected.
7. Bioinformatic collection and processing of data from NGS
A challenging task is to process the vast amount of sequencing data into useful information. Given that a reference genome exists, all sequences generated have to be aligned to this to create a BAM-file (binary alignment map) containing all aligned sequences together with quality information of sequencing and alignment. The next step is ‘variant calling’, i.e. to identify differences between the obtained sequences and the reference genome (Figure 20.4f, g). Mutations identified after variant calling are usually stored in a VCF-file (variant call format) including annotations (comments) like genomic position. Further annotations in databases may include information such as biological function and association to disease.
Since the DNA used for sequencing is derived from thousands of cells, each sequence may be read some tens to thousands of times (reads). The number of times a sequence is read is called ‘coverage’ or ‘read depth’, which is a bioinformatic parameter important to determine the quality and reliability of the obtained sequences.
Levels of Coverage (Reads)
Depending on the purpose of sequencing, different levels of coverage can be acceptable. Analyzing a blood sample for a suspected mutation causing a monogenetic inherited disease will not require a high coverage, since the mutation is inherited through the germline and thus present in all cells of the body. The fraction of reads for a monogenetic disease is expected to be 50 or 100% (variant allelic frequency, VAF), depending on whether the gene is inherited in a dominant or recessive fashion. The coverage needed for NGS analysis of a known inherited single gene disease is usually not more than around 20 reads.
Cancer most often arises as a consequence of somatic mutations, i.e. clonal development of a single somatic cell affected by genetic or structural chromosomal damage. When performing genetic analysis of a tumour, one has to take into account that the tumour consists not only of neoplastic cells but also of stroma cells and often also necrotic and inflammatory cells. Analysing tissues containing a low fraction of tumour cells (<10%) may be challenging due to the presence of reading errors, which are inevitable with NGS, increasing the risk of false positive reads at lower percentages of tumour cells. Depending on the fraction of tumour cells in the sample, the required coverage may vary between 200 and 2,000 reads.
Different Types of Next-Generation Sequencing
Whole Genome Sequencing
Several targets for NGS can be analyzed. The most ambitious target is the entire genome, which can be sequenced using whole genome sequencing (WGS). In a clinical setting this approach may be used to diagnose inherited unknown genetic disease. This is an expensive approach imposing heavy demands on processing and interpretation of huge amounts of bioinformatic data.
Whole Exome Sequencing
The coding sequence is usually the most informative source of data. It is contained within exons, which comprise about 1% of the human genome, and can be sequenced by whole exome sequencing (WES). Following fragmentation of the genome, DNA-containing exons can be captured using thousands of different probes hybridizing specifically to exons. This is much less costly than WGS and is currently the most common approach for diagnosing inherited disease.
Targeted Sequencing
For many clinical applications, especially in BM molecular diagnostics, WGS and WES would give much more genetic information than requested, for example when the presence of specific mutations in one or a few genes are used to predict the sensitivity of a tumour to certain drugs targeting oncoproteins responsible for tumour progression. In such cases, one can restrict sequencing to a panel of genes of interest by making a library generated either from PCR-products (amplicons) or from a fragmented genome where the relevant DNA fragments have been enriched ‘captured’ by hybridization to gene-specific probes. This concept is called targeted sequencing (amplicon- or capture-based) and is used to detect SNVs (single nucleotide variants – ‘point mutations’), CNVs (copy number variants – gene amplifications) and, recently, also fusion genes.
Fluorescence in situ Hybridization
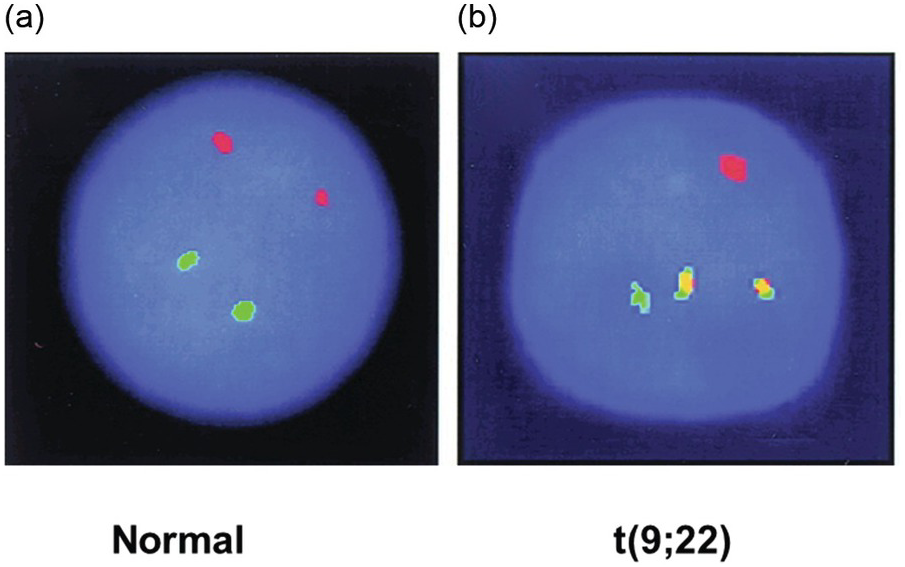
Structural genomic aberrations like chromosomal translocations and inversions resulting in fusion genes have traditionally been analyzed by fluorescence in situ hybridization (FISH) in addition to standard karyotyping (Figure 20.5). Gene fusions often result in the aberrant expression of driver genes (i.e. genes conferring a selective advantage to cancer cells in vivo) in various malignant neoplasms. A classic example of gene fusion is the translocation between chromosomes 9 and 22 leading to juxtaposition of the ABL1 and BCR genes causing chronic myeloid leukaemia (CML). Moreover, FISH can be used to detect gene amplifications.
Figure 20.5 Interphase fluorescence in situ hybridization (FISH) of a normal BM (a) and a BM with chronic myeloid leukaemia (b). Green and red fluorescent probes have been hybridized with the BCR and ABL1 genes on chromosomes 9 and 22, respectively. In the normal BM, the normal chromosome pairs 9 and 22 are seen as red and green dots (a). In the sample with chronic myeloid leukaemia, the two abnormal reciprocally translocated chromosomes are seen as yellow (red-green) fusion signals demonstrating the t(9;22). Note the two remaining normal chromosomes 9 and 22 with red and green signals, respectively (b).
FISH is a combined cytogenetic and molecular method, and requires the use of both molecular tools and microscopic investigation of fluorescent signals from probes. The technique can be applied on interphase or metaphase chromosomes (metaphase analysis requires fresh tissue with cell proliferation and blockage of mitoses with substances such as colchicine). The molecular part consists of short stretches of fluorescent DNA (probes), which hybridize specifically to the chromosomal regions of interest. The cells to be analyzed are attached to a glass sheet (e.g. BM smears for interphase or metaphase analysis; or sections of paraffin-embedded BM sections for interphase analysis). The chromosomal DNA is then chemically denatured (i.e. double-stranded DNA is made single stranded). The probes added in large excess can then find the corresponding complementary sequence on a chromosome and hybridize to generate double-stranded DNA. In order to detect the point of hybridization under a fluorescence microscope, the probes are tagged with fluorescent dyes.
Fusion and Break-Apart Probes
If both fusion partners are known (e.g. BCR/ABL1), probes can be designed for both genes to detect the fusion (fusion probes). For example, a sample with CML cells is likely to show fused signals consisting of one red and one green signal closely juxtaposed on the two fused chromosomes 9 and 22, if red and green fluorescent dyes are used. This signal is often yellow due to interference between the two colours. In contrast, for a normal non-leukaemic sample (or from the remaining unaffected chromosomes 9 and 22 in the leukaemic sample), two different signals, red and green, can be visualized on each targeted normal chromosome under a fluorescence microscope (Figure 20.5).
If only one of the fusion partners is known one can instead use probes that detect the chromosomal break (break-apart probes). Again, two probes labelled with different colours are designed, but they will instead hybridize with one colour on each side of the putative chromosomal break of the gene of interest. Hybridization of the probes to the known gene in a normal sample will produce a mixed signal (yellow if red and green fluorescent dyes are used) since the probes are closely positioned. A chromosomal break within the gene will separate the hybridization points for the probes so that single-coloured abnormal broken chromosomes (split signals, both red and green) can be observed. Break-apart probes are convenient when information about the fusion partner is of minor importance or for screening purposes when a particular gene has multiple fusion partners. A typical example is the translocations involving FGFR1 of myeloid/lymphoid neoplasms with eosinophilia, where screening for all 15 known translocations would be inconvenient and expensive with fusion probes instead of break-apart probes. Another more common example in everyday diagnostics is the use of MYC, BCL2 and BCL6 break-apart probes to detect the respective rearrangements for distinction between Burkitt lymphoma, diffuse large B-cell lymphoma and the so-called double hit lymphoma.
FISH is an expensive and time-consuming technique that is likely to be partly replaced in the future by next-generation sequencing, which in fact can produce the same information for multiple targets simultaneously.
Antigen Receptor Gene Rearrangements
B- and T-cells exhibit the unique feature to rearrange their antigen receptor genes (B-cell receptor genes (BCR) = immunoglobulin genes (IG) or T-cell receptor (TCR) genes) in somatic cells to produce functional B-cell receptors (immunoglobulin molecules) or T-cell receptors on the cell surface. The diverse production of these molecules provides a critical mechanism for generation of a flexible specific immune response against exogenic antigens presented by viruses or bacteria [14]. Since all lymphomas are monoclonal, determination of antigen receptor rearrangements is a powerful way to confirm the diagnosis by revealing monoclonal rearrangements. The following sections include a brief overview of the principal features of the normal rearrangement process for B- and T-cells, respectively, followed by practical and theoretical aspects on a commonly used protocol to determine monoclonality, the BIOMED-2 protocol [15].
B-Cell Receptor (Immunoglobulin) Gene Rearrangements
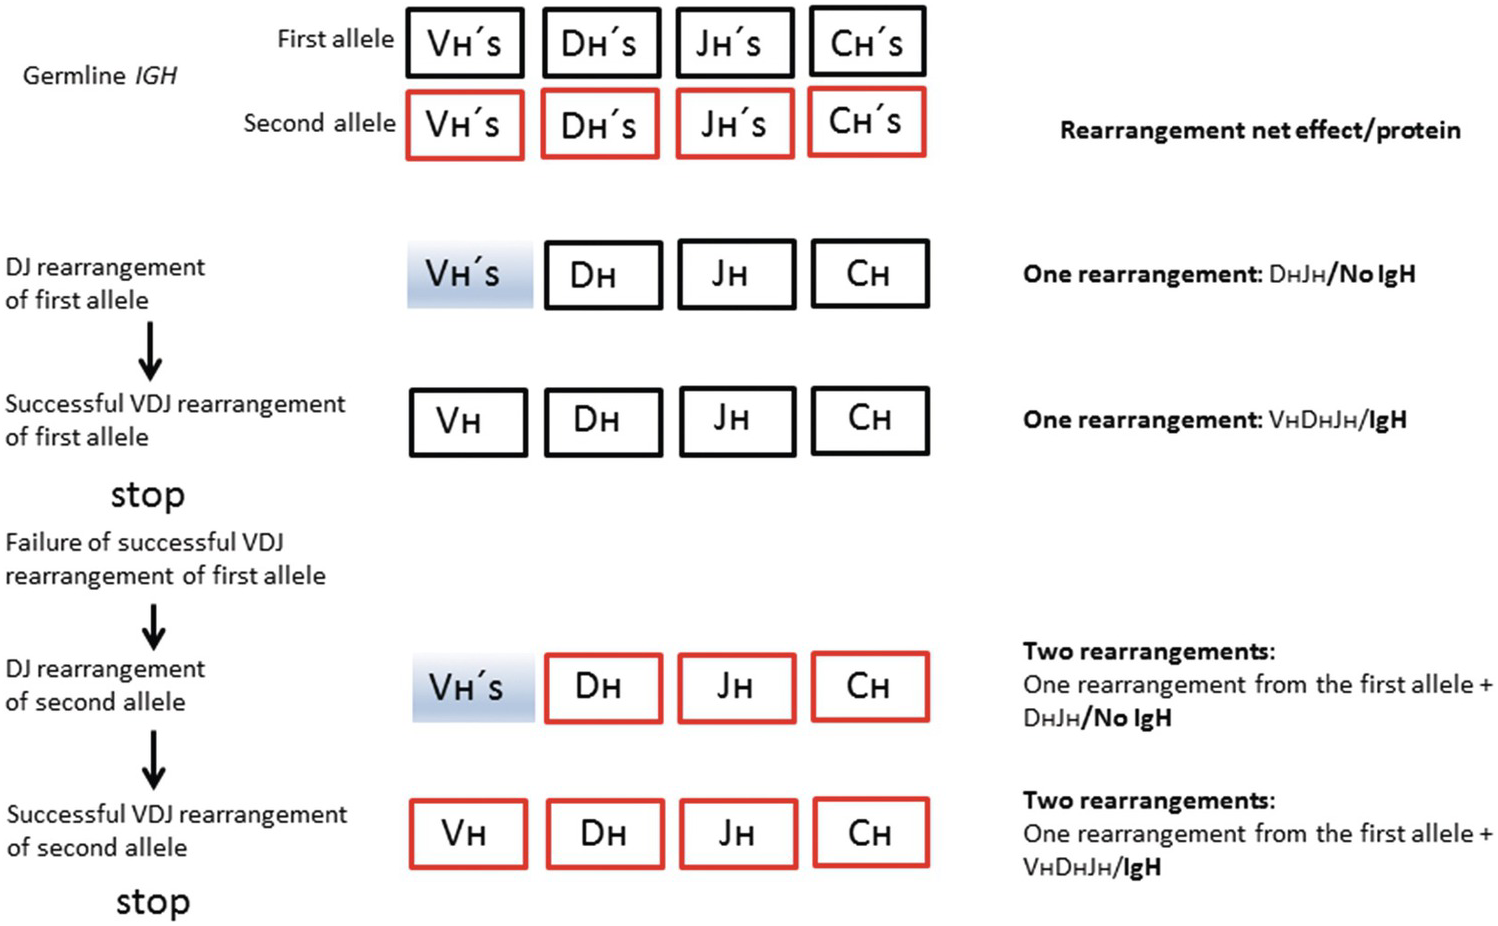
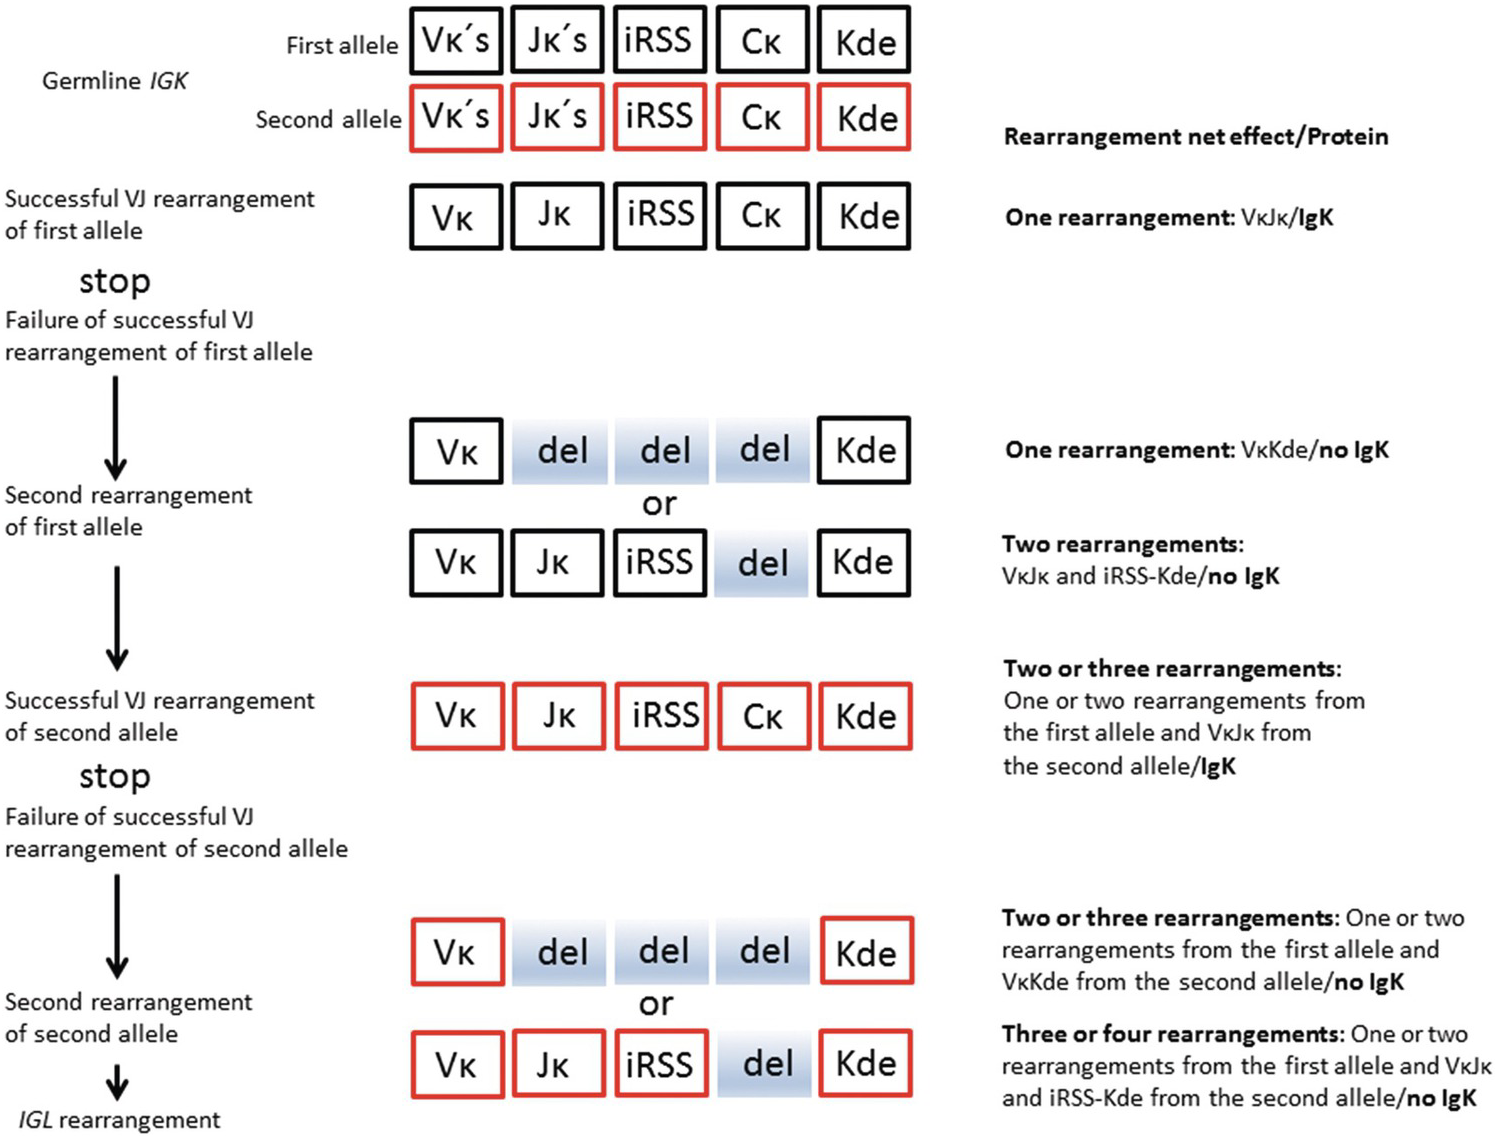
The BCR (IG) genes code for immunoglobulin molecules produced exclusively by B-cells. There are three classes of IG genes, i.e. the immunoglobulin heavy chain gene (IGH), located on chromosome 14q32, the immunoglobulin kappa light chain gene chain gene (IGK), located on chromosome 2p12, and the immunoglobulin lambda light chain gene chain gene (IGL), located on chromosome 22q11. The complete functional Ig molecule consists of two identical heavy chains and two identical light chains, either kappa (κ) or lambda (λ). The IGH locus contains several different disconnected variable (V) segments, diversity (D) segments, joining (J) segments and constant (C) segments, whereas the IGK and IGL loci contain only V, J and C segments, respectively (Figures 20.6 and 20.7).
Figure 20.6 Schematic represesentation of salient features of normal IGH rearrangement relevant for interpretation of clonality. Vʜ – heavy chain variable segment; Dʜ – heavy chain diversity segment; Jʜ – heavy chain joining segment; Cʜ – heavy chain constant segment; shaded boxes – segments not involved in the rearrangement. Successful rearrangement means production of a functional IgH molecule.
Figure 20.7 Simplified schematic represesentation of salient features of normal IGK rearrangement relevant for interpretation of clonality. Vκ – kappa variable segment; Jκ – kappa joining segment; iRSS – intron recombination signal sequence; Cκ – kappa chain constant segment; Kde – kappa deleting element; del (shaded) – deleted segments during rearrangement. Deleted shaded box of the Jκ segment entails deletion of the entire unproductive VκJκ segment (not shown for simplification of the figure). Successful rearrangement means production of a functional IgK molecule.
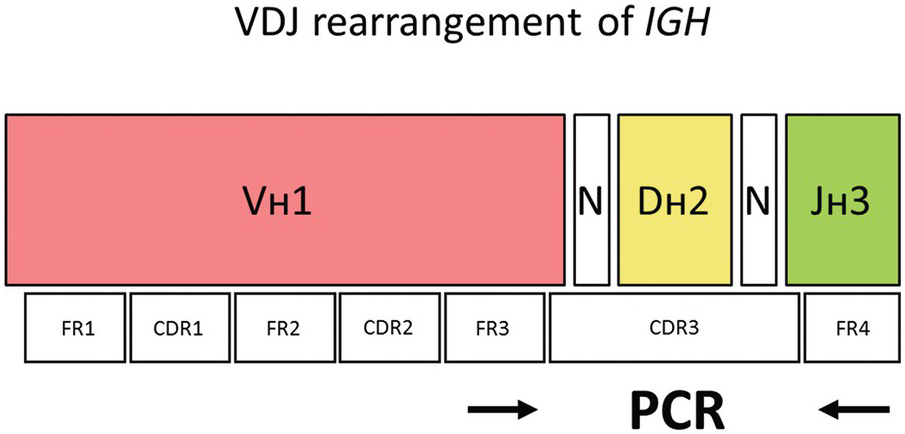
The Vʜ segments can be subdivided into different Vʜ families (Vʜ1 to Vʜ7) based on the similarity of the DNA sequences of the individual Vʜ segments. Each Vʜ segment consists of three relatively conserved regions called framework regions (FR1, FR2 and FR3) and two variable regions termed complementary-determining regions, CDR1 and CDR2, located between FR1 and FR2, and FR2 and FR3, respectively (Figure 20.8). The framework regions contain DNA sequences that are quite similar between different VH segments of a particular VH family. In contrast, the complementary-determining regions have highly variable DNA sequences even within the same VH family.
Figure 20.8 The V segment of the IGH gene consists of three conserved framework regions (FR 1–3) and two highly variable regions (CDR1 and 2). The hypervariable CDR3 harbouring the VDJ rearrangement can be amplified by annealing primers to FR3 and FR4 where the somatic hypermutation rate is expected to be low (arrows). N – random insertion of nucleotides e.g. by TdT (terminal deoxynucleotidyl transferase; PCR – polymerase chain reaction).
The IGH constant (C) segments specify nine functional immunoglobulin subclasses (IgM, IgD, IgG1–4, IgA1–2 and IgE). During early B-cell development in the bone marrow, one each of the Vʜ, Dʜ and Jʜ segments are joined together by a process known as VDJ-recombination resulting in the H-chain variable region (the incomplete DʜJʜ rearrangement precedes the complete VʜDʜJʜ rearrangement). The recombined 3´ end of the Vʜ segment, the Dʜ segment and the 5´ part of the Jʜ segment defines the complementary-determining region 3 (CDR3) that can be amplified by PCR to detect clonal B-cell populations indicative of B-cell lymphoma (Figure 20.8).
In the bone marrow B-cell precursors, the fused VʜDʜJʜ segment is transcribed and spliced to one of the C segments (Cµ) to form the heavy chain of IgM molecules. This is followed by IGK rearrangement (VκJκ joining), for the production of the κ light chains of IgM molecules. The IGK rearrangement typically precedes IGL rearrangement (VλJλ joining), which leads to the formation of the λ light chains of IgM molecules. The production of IgD molecules follows a similar scheme and is believed to take place mainly in the B-cells in the peripheral blood. The VDJ or VJ recombination at the three IG loci (including random insertion or deletion of nucleotides at the joining sites by the enzyme DNA terminal deoxynucleotidyl transferase, TdT) is the major reason for the enormous diversity of immunoglobulins in terms of antigen-binding capacity. Similar to the IGH locus, the recombined VJ segment of IGK or IGL genes can be amplified by PCR to detect monoclonal rearrangements.
In the germinal centres of peripheral lymphoid tissue (e.g. lymph nodes), the IgH genes are further altered by somatic hypermutation, particularly in the CDR3 region, which also contributes to the antigenic diversity by refining the specificity of the antibodies. This is followed by class-switch recombination where one of the C segments (G, A or E) is fused to the preformed VDJ segment in order to produce the heavy chains (γ, α and ɛ) of the IgG, IgA and IgE molecules, respectively.
T-Cell Receptor Gene Rearrangements
The rearrangement of the TCR genes is similar to that of the BCR genes, except that there is no somatic hypermutation contributing to antigenic diversity of T-cells and no rearrangement similar to class switch.
Precursor T-cells with their T-cell receptor genes TCRD, TCRG, TCRA and TCRB in germline configuration (meaning that no gene rearrangement has taken place with no TCRs on the cell surface) are produced in the bone marrow. From there, they migrate to the thymus to mature into peripheral T-cells. The maturation process implies the production of functional TCRs, which leads to the expression of either TCRγδ or TCRαβ heterodimers on the cell surface of the T-cells. The gene rearrangements responsible for producing these TCRs follow a strict hierarchical pattern in the following manner. The TCRD-genes (located within the TCRA gene on chromosome 14q11.2) are the first to undergo rearrangement, followed by the TCRG genes (chromosome 7p14). If the TCRD and TCRG genes are successfully rearranged a TCRγδ receptor is expressed, which enables survival signals to interact with the TCRγδ protein (Figure 20.9). This allows subsequent expansion of functional γδ T-cells, which constitute a small minority of functional T-cells (mostly found in the intestinal mucosa). However, if no such survival signal prevails (the nature of which is not entirely clear), the TCRγδ receptor is silenced and the T-cells continue to rearrange first their TCRB-genes (located on chromosome 7p34) (Figure 20.10), and then their TRCA-genes (chromosome 14q11.2) [16]. Since the TCRD gene is located within the TCRA gene, the rearrangement of the TCRA gene will result in the deletion of the TCRD gene, precluding further expression of the TCRγδ receptor. Hence the expression of TCRγδ and TCRαβ are mutually exclusive in mature peripheral T-cells (and in the vast majority of peripheral T-cell lymphomas). Successful rearrangements (meaning that the corresponding protein is produced) of TCRA and TCRB lead to the expansion of αβ T-cells (a functional TCRαβ receptor conveys a strong survival signal), which constitute the vast majority of peripheral T-cells. This also reflects the frequency distribution of peripheral T-cell lymphomas, most of which express TCRαβ. The knowledge of the sequential rearrangements has practical diagnostic implications, since most peripheral T-cell lymphomas expressing TCRαβ will have monoclonally rearranged TCRG as well as TCRB genes.
Figure 20.10 Schematic represesentation of salient features of normal TCRB rearrangement relevant for interpretation of clonality. Vβ – β chain variable segment; Dβ – β chain diversity segment; Jβ – β chain joining segment. The β constant segment has been omitted; Vβs (shaded) – segments not involved in the rearrangement; del (shaded) – deleted segments during rearrangement. Successful rearrangement means production of a functional TCRβ molecule.
As for the IG loci, the recombined VDJ or VJ segments can be amplified by PCR to detect clonal T-cell populations indicative of T-cell lymphoma.
Molecular and Genetic Aberrations of Lymphoid Neoplasms in the Bone Marrow
Lymphoid neoplasms are often encountered in the bone marrow. The various entities are discussed in detail in other chapters of this volume. Tables 20.1 to 20.4 highlight the most important molecular aberrations (excluding monoclonal gene rearrangements) for lymphoid neoplasms involving the bone marrow, including a rough estimation of the frequency of BM involvement for most of the relevant WHO entities.
Table 20.1 The most important genetic aberrations of diagnostic value for the final WHO diagnosis of precursor lymphoid neoplasms encountered in the bone marrow. The finding of monoclonal B-cell receptor and T-cell receptor gene rearrangements is important for the diagnosis in many cases across the different entities; these may display lineage infidelity (i.e. monoclonal B-cell receptor gene rearrangements in precursor T-cell neoplasms and vice versa), and are not included in the table.
Table 20.2 The most important genetic aberrations of diagnostic value (including integration of viral genes in the neoplastic genome), for the final WHO diagnosis of mature B-cell neoplasms encountered in the bone marrow. The finding of monoclonal B-cell receptor rearrangements is important for the diagnosis in many cases across the different entities, but they are not included in the table. (EBER: EBV-encoded small RNA.)
Table 20.3 The most important genetic aberrations of diagnostic value (including integration of viral genes in the neoplastic genome) for the final WHO diagnosis of mature T- and NK-cell neoplasms encountered in the bone marrow. The finding of monoclonal TCR rearrangements is important for the diagnosis in many cases across the different entities, but are not included in the table, except when of differential diagnostic value. (TCR: T-cell receptor genes; TRG: T-cell receptor gene gamma; TRB : T-cell receptor gene beta; EBER: EBV-encoded small RNA.)
Stay updated, free articles. Join our Telegram channel

Full access? Get Clinical Tree


