Abstract
Immunophenotyping is an important part of the integrated haematopathologic diagnostics of bone marrow (BM) samples. Integrated diagnosis should include clinical information, peripheral blood (PB) and BM smear cytology, flow cytometry (FCM) of BM aspirate, BM trephine biopsy (BMB) morphology, BMB immunohistochemistry (IHC) and cytogenetic/molecular genetic data if appropriate. Flow cytometry and IHC provide complementary information [1]. Immunophenotyping by FCM has the advantage of measuring high numbers of cells and the possibility to evaluate co-expression of several markers in various cell populations in a multicolour setting. Immunohistochemistry provides a possibility of in situ interpretation of morphology and immunophenotype simultaneously. Double IHC stains are possible but not widely used as of yet.
Introduction
Immunophenotyping is an important part of the integrated haematopathologic diagnostics of bone marrow (BM) samples. Integrated diagnosis should include clinical information, peripheral blood (PB) and BM smear cytology, flow cytometry (FCM) of BM aspirate, BM trephine biopsy (BMB) morphology, BMB immunohistochemistry (IHC) and cytogenetic/molecular genetic data if appropriate. Flow cytometry and IHC provide complementary information [1]. Immunophenotyping by FCM has the advantage of measuring high numbers of cells and the possibility to evaluate co-expression of several markers in various cell populations in a multicolour setting. Immunohistochemistry provides a possibility of in situ interpretation of morphology and immunophenotype simultaneously. Double IHC stains are possible but not widely used as of yet.
Optimally all diagnostic information should be gathered and reported by the responsible haematopathologist in one integrated report. However, in some settings, FCM and IHC are performed and evaluated by separate laboratories. In such situations, close cooperation between laboratories and reporting diagnosticians is required in order to avoid unnecessary duplication of tests and misleading reports. All information should be interpreted and discussed together with clinicians at a multidisciplinary conference.
Flow Cytometry
Methodology
All blood and BM samples should be stored at 18 to 25°C temperature and transported to the FCM laboratory as soon as possible. Time from sample collection to analysis should not exceed 48 hours. Whole PB/BM analysis with erythrocyte lysis is recommended for clinical PB/BM immunophenotyping of leukocytes [2]. If information on the erythroid compartment is required, BM samples should not be lyzed [3]. Samples to be stained for surface immunoglobulins (sIg) should be thoroughly washed before staining in order to avoid false negative results due to the presence of serum Ig [2].
Blood or BM cells are incubated with cocktails of antibodies (Table 19.1) conjugated with fluorochromes.
Table 19.1 Membrane CD antigens commonly used in flow cytometry immunophenotyping of the bone marrow.
| CDa | Name/function | Expression in normal haematopoietic cell types |
|---|---|---|
| CD1a | Cortical thymocyte antigen | Cortical thymocytes, Langerhans cells, dendritic cells |
| CD2 | Sheep red blood cell receptor | Thymocytes, T-cells, NK cells |
| CD3 | T-cell co-receptor | T-cells, thymocyte subset |
| CD4 | T-cell receptor co-receptor binding to MHC class II molecule | Thymocyte subset, T-cell subset, monocytes, macrophages |
| CD5 | Member of the scavenger receptor cysteine-rich superfamily | Thymocytes, T-cells, B-cell subset |
| CD7 | Member of Ig superfamily, T-lymphocyte interactions during early development | Thymocytes, T-cells, NK cells, small subset of haematopoietic progenitors |
| CD8 | T-cell receptor co-receptor binding to MHC class I molecule | Thymocyte subset, T-cell subset, NK subset |
| CD9 | Member of tetraspanin family | Eosinophils, basophils, platelets, activated T-cells |
| CD10 | MME, Membrane metalloendopeptidase | B-precursors, germinal centre B-cells, thymocyte subset, neutrophils |
| CD11b | ITGAM; Integrin subunit alpha M | Granulopoietic cells, NK cells, monocytes |
| CD11c | ITGAX, Integrin subunit Alpha X | Dendritic cells, granulopoietic cells, NK cells, B-cell and T-cell subsets, monocytes |
| CD13 | ANPEP, Alanyl aminopeptidase | Granulopoietic cells, monocytes |
| CD14 | Co-receptor for detection of bacterial lypopolysaccharide (LPS) | Monocytes, macrophages, Langerhans cells |
| CD15 | FUT4, Fucosyltransferase 4 | Neutrophils, eosinophils, monocytes |
| CD16 | FCGR3, Fc gamma receptor | Neutrophils, macrophages, NK cells |
| CD19 | Member of Ig superfamily , assembles with antigen receptor of B-lymphocytes | B-cells, plasma cells |
| CD20 | MS4A1, Membrane spanning-4 domains A | B-cells |
| CD22 | Member of sialic acid-binding immunoglobulin-type lectin family-2 (SIGLEC-2) | B-cells |
| CD23 | FCER2, Fc fragment of IgE receptor 2 | B-cells, eosinophils, platelets |
| CD25 | Interleukin-2 receptor alpha chain | Activated B-cells and T-cells |
| CD30 | TNFRSF8, Tumour necrosis factor receptor superfamily member 8 | Reed–Sternberg cells, T-cell lymphomas |
| CD33 | SIGLEC-3 | Granulopoietic cells, monocytes, dendritic cells |
| CD34 | Possible adhesion molecule important for early haematopoiesis | Haematopoietic precursors |
| CD36 | Thrombospondin receptor | Platelets, monocytes, erythropoietic precursors |
| CD38 | ADP-ribosyl cyclase-1 | High expression on B-cell precursors, plasma cells and activated T-cells, low on granulopoietic cells |
| CD41 | Platelet membrane glycoprotein IIb | Platelets, megakaryocytes |
| CD42a | GP9, Platelet glycoprotein IX | Platelets, megakaryocytes |
| CD45 | PTPRC, Protein tyrosine phosphatase, receptor type C | Haematopoietic cells, multiple isoforms from alternative splicing |
| CD56 | Neural cell adhesion molecule-1 | NK subset, T-cell subset |
| CD57 | B3GAT1, Beta-1,3-glucuronyltransferase 1 | NK subset, T-cell subset |
| CD61 | ITGB3, Integrin subunit beta 3 | Platelets, megakaryocytes |
| CD64 | FCGR1A, Fc fragment of IgG receptor Ia | Monocytes, neutrophils |
| CD71 | Transferrin receptor | Proliferating cells, erythroid precursors, reticulocytes |
| CD79b | Membrane-bound immunoglobulin-associated protein | B-cells, plasma cells |
| CD103 | ITGAE, Integrin subunit alpha E | B- and T-cell subsets |
| CD117 | KIT, KIT proto-oncogene receptor tyrosine kinase | Haematopoietic progenitors, mast cells |
| CD123 | IL3RA, Interleukin 3 receptor subunit alpha | Basophils, dendritic cell subset, haematopoietic progenitors |
| CD133 | PROM1, Prominin-1 | Haematopoietic stem cells subset |
| CD138 | SDC1, Syndecan-1 | |
| CD200 | OX-2 membrane glycoprotein | Thymocytes, T-cell and B-cell subsets |
| CD235a | Glycophorin A | Erythropoietic precursors |
a CD: cluster of differentiation. For a comprehensive list and characteristics please see www.hcdm.org, for other antigens studied mostly by IHC see Table 19.7
Flow cytometers are equipped with lasers and during the acquisition stained cells are streamed through the laser light source. Fluorochromes absorb the light from the laser and emit light at longer wavelengths. Flow cytometers measure the amount of light emitted by fluorochromes bound to individual cells. Hence, in modern FCM laboratories, eight to ten antigens can be analyzed for each cell. Acquired FCM data are electronically stored in list-mode files that are a part of the medical record of the patient and should be available for review similarly to electronically stored imaging data.
During interpretation of the results, data from list-mode files is most often presented as two-parameter dot plots, where each signal (cell) is visualized by one dot and given a parameter on the x– and y-axes. Various cell populations can then be gated (i.e. ‘painted’ using software) with different colours and visualized on other plots (also called ‘back-gating’). Modern software packages also provide the possibility of more advanced analysis of several parameters simultaneously using principal component analysis [4] or radar plots [5].
Two light-scatter channels provide an approximate measure of cell size (forward scatter, FSC) and granularity (side scatter, SSC). Cells with high granularity, such as granulocytes or monocytes, will have higher SSC than those with no granules, such as lymphocytes or immature precursor (blast) cells. Larger cells, such as monocytes, will have higher FSC in addition to higher SSC as compared to lymphocytes (Figure 19.1).
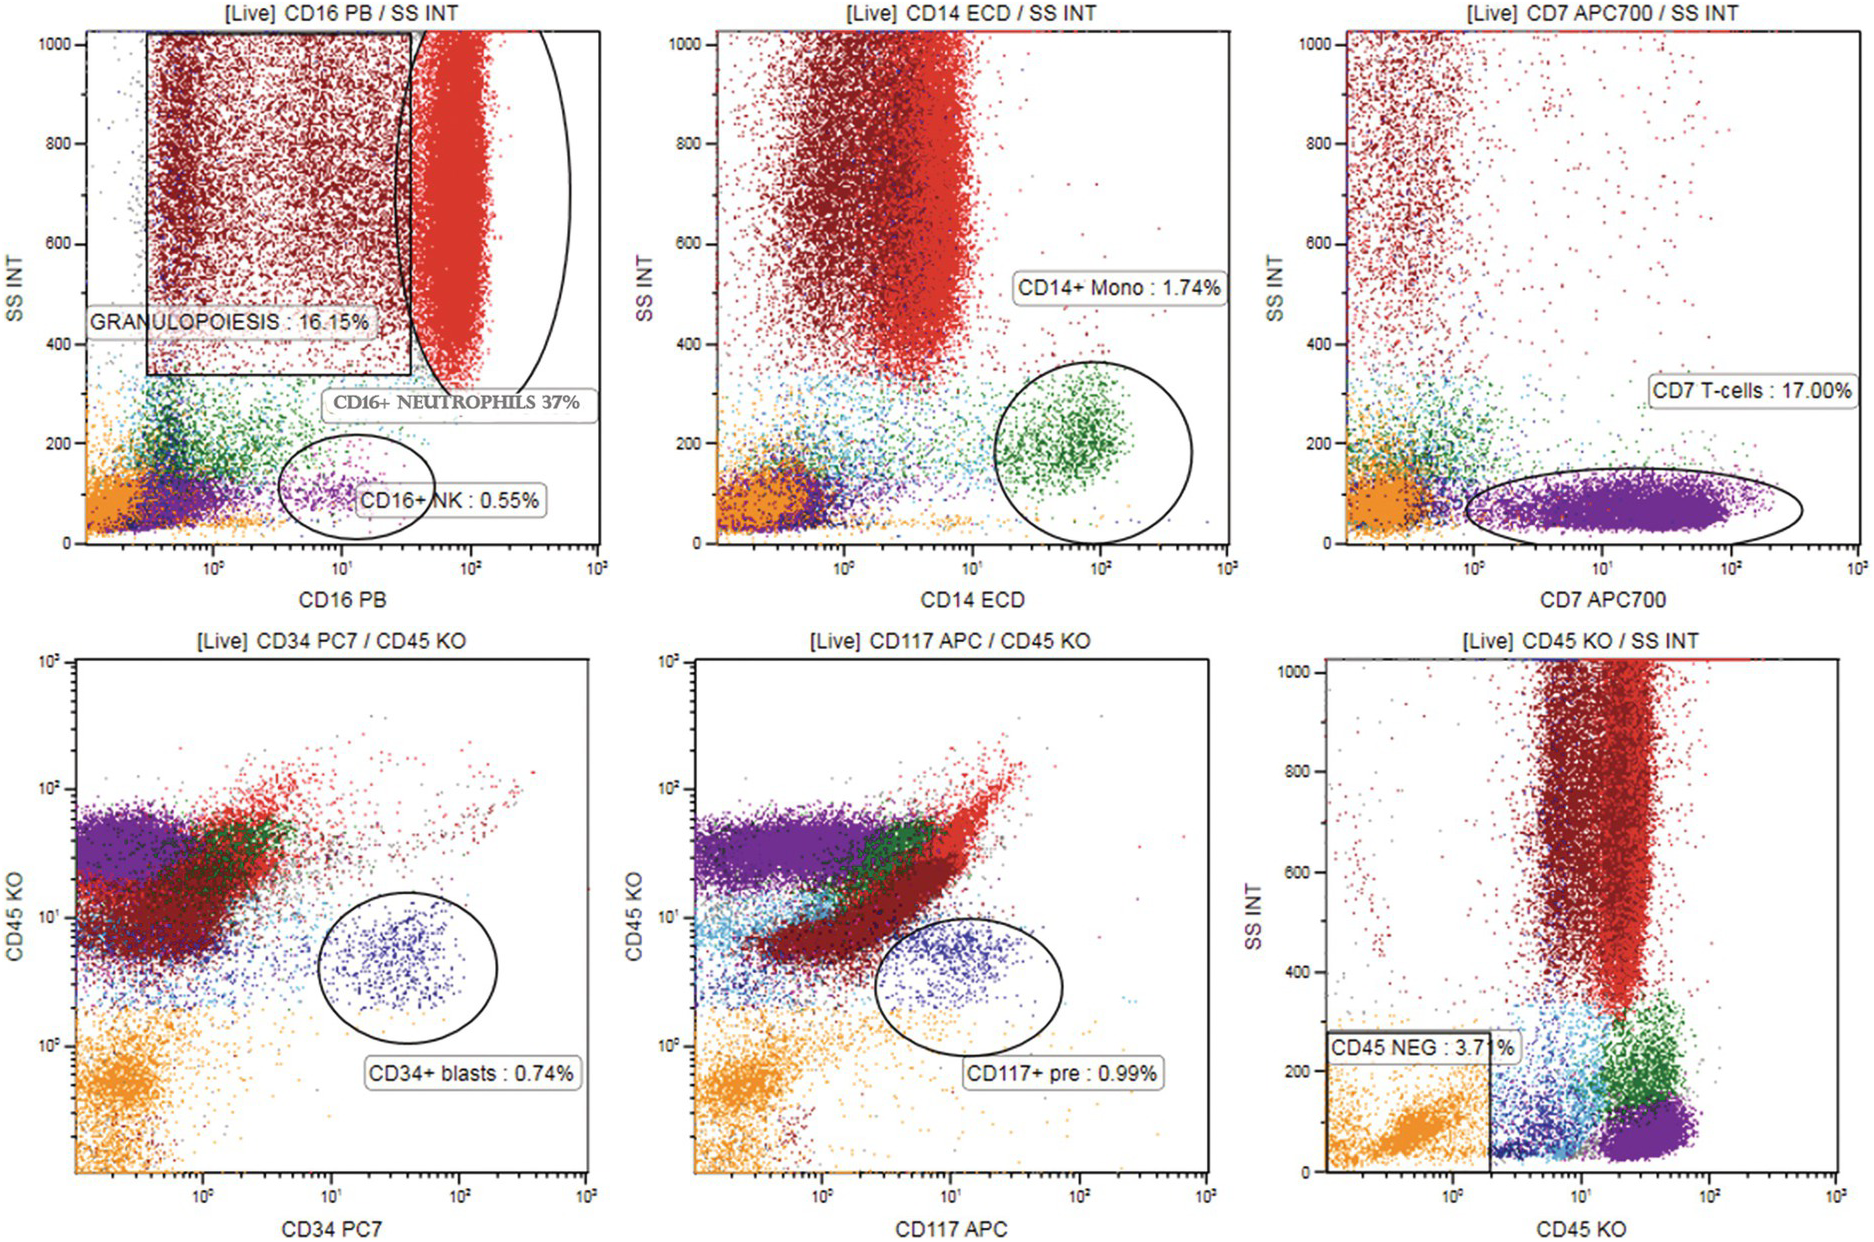
Figure19.1 Mapping various cell subsets in the normal/reactive bone marrow sample on CD45/SSC plot using colour coding and back-gating. Multicolour flow cytometry was performed with CD16 PB visualizing neutrophils (high SSC, red dots, upper left plot) and NK cells (violet dots, low SSC), CD14-ECD visualizing monocytes (green dots, middle upper plot), CD7-APC700 visualizing T and NK lymphocytes (violet dots, upper right plot). Other granulopoietic precursors were identified using CD33 and CD13 (not shown, high scatter, brown dots). Cells that are CD45dim and do not correspond to any mature cell population were painted cyan (blast region, lower right plot). CD34-PC7 and CD117-APC show precursors in the CD45dim region (dark blue dots, lower left and middle plot). All cell populations were ‘back-gated’ at SSC/CD45 plot (right lower plot) mapping the bone marrow [7]. CD45 negative cells (orange dots, low scatter) correspond to erythropoiesis.
In BM immunophenotyping, differential identification of populations that correlate to cell populations defined by morphology is usually applied by gating various BM cell subsets on CD45/SSC plot (Table 19.2) [6]. The localization of various subpopulations on the CD45/SSC plot can be confirmed by multicolour staining of lineage-associated antigens together with CD45. Cell clusters positive for given antigen combinations are visualized on the CD45/SSC plot by back-gating using colour coding. Harmonization of colour coding for mature cell populations (lymphocytes: in magenta; granulocytes: in red; monocytes: in green) and the precursor population (in cyan) has been proposed by the European Leukaemia Net Flow Cytometry Atlas (www.leukemia-net.org) and the publication from the GEIL group [7] (Figure 19.1). CD45 fluorescence intensity is determined as bright (CD45bright) if similar to normal T-lymphocytes (Figure 19.1), intermediate (CD45int) if similar to granulocytes and dim if similar to blasts (CD45dim).
Table 19.2 Characteristics of various bone marrow cell subsets on the CD45/SSC plot.
| Mature lymphocytes | bright CD45, low SSC |
| Monocytes | bright CD45, SSC higher than lymphocytes |
| Granulopoietic precursors and granulocytes | dim CD45, high SSC |
| Early haematopoietic precursors | dim CD45, low SSC |
| Erythropoietic precursors | CD45 negative, low SSC |
Flow Cytometry Panels
All FCM PB/BM specimens should be accompanied by a request form on which the purpose of the test and relevant clinical data, including complete blood count (CBC), are indicated. The choice of the panel will depend on the clinical question (Table 19.3). Newly established panels have to be validated according to the international and national guidelines [8, 9]. It is very important that each FCM laboratory obtains a good knowledge of normal BM reference patterns seen using all panels applied in diagnostics [7].
Table 19.3 Examples of 8 to 10-colour flow cytometry panels in immunophenotyping of leukaemia and lymphoma.
| Panel | FITCa | PE | ECD | PC5.5 or PerCPCy5.5 | PECy7 | APC | APC-AF700 or AF700 or APCH7 | APC-AF750 or APCCY7 | PacB/BV421 | KO/PO AmCyan |
|---|---|---|---|---|---|---|---|---|---|---|
| Screening BMa | Kappa/CD4 | Lambda/CD8 | CD3/CD14 | CD33 | CD20/CD56 | CD34 | CD19 | CD10 | CD5 | CD45 |
| Screening PBa | Kappa/CD8 | Lambda/CD4 | CD3/CD14 | CD38 | CD20/CD56 | CD10 | CD19 | CD5 | CD57/CD23 | CD45 |
| LPDb Orientation | Kappa | Lambda | CD4 | CD5 | CD8 | CD3 | CD56 | CD19 | CD20 | CD45 |
| Screening LSc | Lambda/CD8 | Kappa/CD56 | CD5 | CD19/TCRγδ | mCD3 | CD38 | CD4/CD20 | CD45 | ||
| CLL vs. MCLa | CD81 | CD79b | CD23 | CD11c | CD5 | CD200 | CD19 | CD43 | CD22 | CD45 |
| HCL vs. SMZL vs. LPLa | Lambda | Kappa | CD123 | CD11c | CD20 | CD103 | CD19 | CD25 | IgM | CD45 |
| AML/MDS-granuloa | CD56 | CD13 | CD14 | CD10 | CD117 | CD11b | CD34 | CD33 | CD16 | CD45 |
| AML/MDS-monoa | CD36 | CD7 | CD64 | HLA-DR | CD117 | CD123 | CD34 | CD33 | CD38 | CD45 |
| AML/MDS-granuloc | CD16 | CD13 | CD34 | CD117 | CD11b | CD10 | HLA-DR | CD45 | ||
| AML/MDS-monoc | CD35 | CD64 | CD34 | CD117 | CD300e | CD14 | HLA-DR | CD45 | ||
| AMLb A | CD65/CD15 | CD14 | CD13 | CD33 | CD34 | CD117 | CD7 | CD11b | CD16 | CD45 |
| AMLb B | CD64 | CD10 | CD4 | CD33 | CD34 | CD123 | CD56 | CD19 | CD38 | CD45 |
| AMLb C | CD36 | CD61 | CD24 | CD33 | CD34 | CD15 | CD2 | CD71 | HLA-DR | CD45 |
| ALL-Ba | CD66 | CD58 | CD20 | CD38 | CD19 | CD123 | CD34 | CD10 | CD22 | CD45 |
| ALL-Bc MRD | CD81 | CD66/CD123 CD73/CD304 | CD34 | CD19 | CD10 | CD38 | CD20 | CD45 | ||
| ALL-B b A B | CD58 CD81 | CD10 CD10 | CD13 | CD33 | CD34 CD34 | CD123 CD15 | CD22 | CD19 CD19 | CD38 CD20 | CD45 CD45 |
| ALL-Ta | CD99 | CD1a | CD3 | CD4 | CD5 | CD7 | CD2 | CD10 | CD8 | CD45 |
| MPALa | nTdT | cytMPO | CD2 | HLA-DR | CD19 | cytCD79 | CD34 | CD33 | cytCD3 | CD45 |
| ALOTc | cytMPO | cytCD79a | CD34 | CD19 | CD7 | mCD3 | cytCD3 | CD45 |
Abbreviations: APC: allophycocyanin, APC H7: APC cyanine tandem, AF: Alexa Fluor, AmCyan: anaemonia majano cyan, BV421: Brillant violet421, Cy: cyanine dye, ECD: PE-texas red, FITC: Fluorescein isothiocyanate, KO: Krome Orange, PacB: Pacific Blue, PE: R-phycoerythrin, PerCP: Peridinin chlorophyll protein, PO: Pacific Orange. BM: bone marrow, PB: peripheral blood, AML: acute myeloid leukaemia, MDS: myelodysplastic syndrome, CLL: chronic lymphocytic leukaemia, MCL: mantle cell lymphoma, HCL: hairy cell leukaemia, SMZL: splenic marginal zone lymphoma, LPL: lymphoplasmacytic lymphoma, ALL: acute lymphoblastic leukaemia, MPAL: mixed phenotype acute leukaemia, cyt: cytoplasmic, n: nuclear, m: membrane.
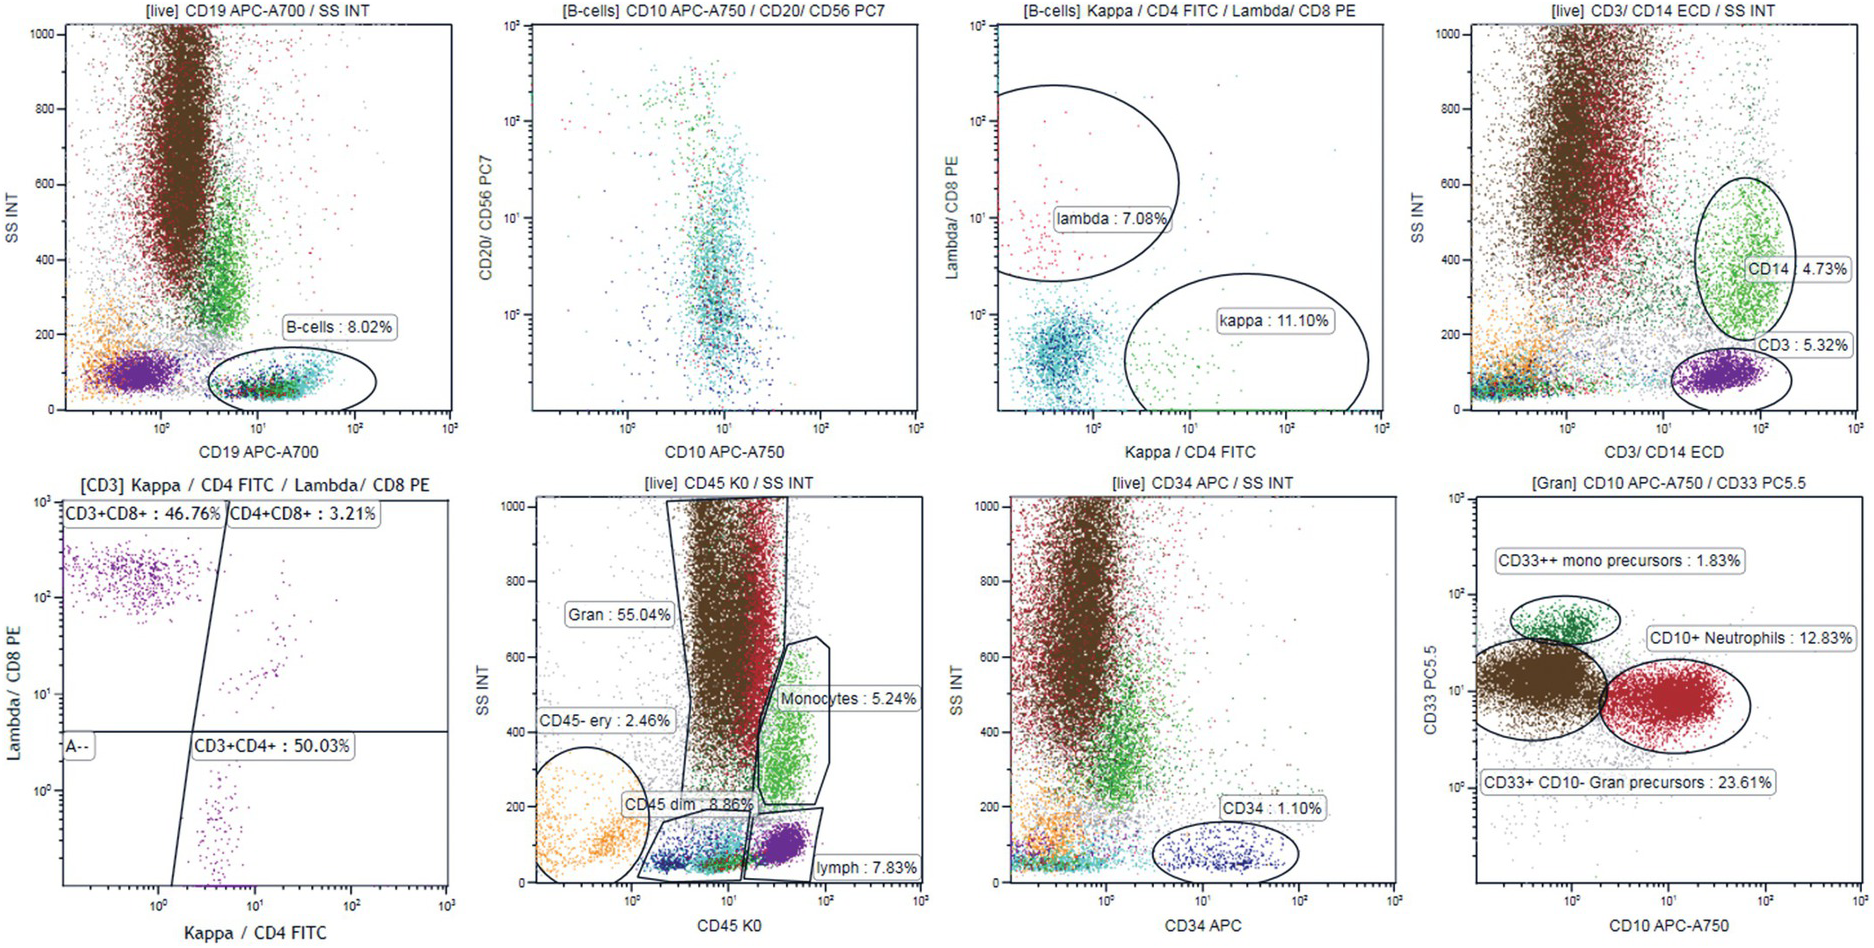
In patients with recently discovered cytopaenias, a screening panel providing general information on BM cell subsets may be applied (Table 19.3). The BM screening panel applied in our laboratory (Figure 19.2) gives quick information on both lymphatic and myeloid BM compartments [10]. Using this panel, it is easy to exclude an aberrant B-cell population (CD10+, CD5+, with monotypic kappa or lambda expression). The panel also gives some information about T-cell subsets (CD3+, CD5+, CD4/CD8 ratio), the myeloid compartment (CD33+, CD10+ neutrophils, CD14 monocytes) and the immature cell compartment (CD34+ cells and CD33+CD34+ myeloid vs. CD34+CD19+ B-lymphoid precursors). In case of aberrant findings, a comprehensive panel should be chosen. The secondary panel may be focused on B- or T-cell lymphoma immunophenotyping, on lineage assignment and abnormal features of leukaemic blasts in acute lymphoblastic or myeloid leukaemia, or on maturation disturbances in the myeloid compartment (if a myelodysplastic syndrome (MDS) is suspected) (examples in Table 19.3).
Figure 19.2 Ten-colour 14-antibody panel [10] for screening of bone marrow samples for abnormal B-cell and for orientation in the myeloid and T-cell compartment. The panel includes kappa+CD4 FITC, Lambda+CD8 PE, CD3+ CD14 ECD, CD34 APC, CD20+CD56 PC7, CD10 APC-A750, CD19 APC-A700, CD33 PC5.5, CD5 PB and CD45 KO. B-cells are gated using CD19 (left plot upper panel) and B-cell maturation is evaluated using CD20 vs. CD10 plot showing CD10+ B-cell precursors with increasing expression of CD20 during maturation (cyan dots, left middle plot, upper panel). Kappa (green dots) vs. lambda (red dots) plot shows polytypic expression of membrane light chains in the mature-cell population and lack of kappa/lambda expression in the B-cell precursors (right middle plot, upper panel). Right upper plot shows gating of T-cells (CD3+, violet dots, low scatter) and monocytes (CD14+, higher scatter, green dots). CD4 and CD8 expression is evaluated on gated CD3+ cells (left plot, lower panel) generating CD4/CD8 ratio. CD34+ blasts are painted dark blue (right middle plot, lower panel). CD10+ CD33+ neutrophils are painted red and CD33+CD10– granulopoietic precursors are painted brown (right plot, lower panel). CD33++CD10– cells that are CD14– correspond to monocytic precursors (dark green dots, right lower panel). All cell populations can be visualized in the CD45/SSC plot (lower panel, left middle plot). CD45– cells correspond to erythropoiesis (orange dots).
Aberrant Flow Cytometry Findings in the Bone Marrow
Detailed descriptions of diagnostic findings in the specific disease entities are provided in the respective chapters. A general approach to FCM evaluation of various BM cell compartments is provided below.
Both normal immature cells and leukaemic blasts are usually found in the CD45dim/SSClow/int region [6, 11](Figures 19.1 and 19.3). Normal CD34+ cells include myeloid progenitors, CD34+ B-lymphoid progenitors¸ monocytic progenitors, erythroid progenitors and dendritic cell progenitors [5]. CD34– cells found in the CD45dim region include plasma cells, CD34–CD10+ B-cell precursors, basophils, plasmacytoid dendritic cells, early monocytic cells and CD45dim erythroid precursors [5].
(a) Abnormal population is found in the granulopoiesis region (left plot, dark blue dots) showing no CD34 but strong CD117 expression (left middle plot), strong CD33 and heterogeneous CD13 (right middle plot) but no CD16 expression (right plot). Further the cells were negative for HLA-DR, CD11b and CD11c. This immunophenotype is characteristic for acute promyelocytic leukaemia.
(b) Acute myeloid leukaemia with no differentiation. CD33+/CD45dim blasts with low/intermediate scatter are almost 90% of bone marrow cells (left two plots). The blast population is CD117+ and a subset is CD34+ (green and dark blue dots, respectively). No signs of monocytic differentiation were noted (CD14 negative, right plot, CD36 and CD64 negative, not shown). Cytoplasmic staining showed MPO expression but no CD11b or CD15 was found (not shown).
(c) Acute myeloid leukaemia with monocytic differentiation. Leukaemic blasts (dark blue dots) are in the monocytic region (left plot). Blasts are positive for CD34 and CD117 (left middle plot), and show strong expression of CD14, CD33, CD36 and CD64 (right plots).
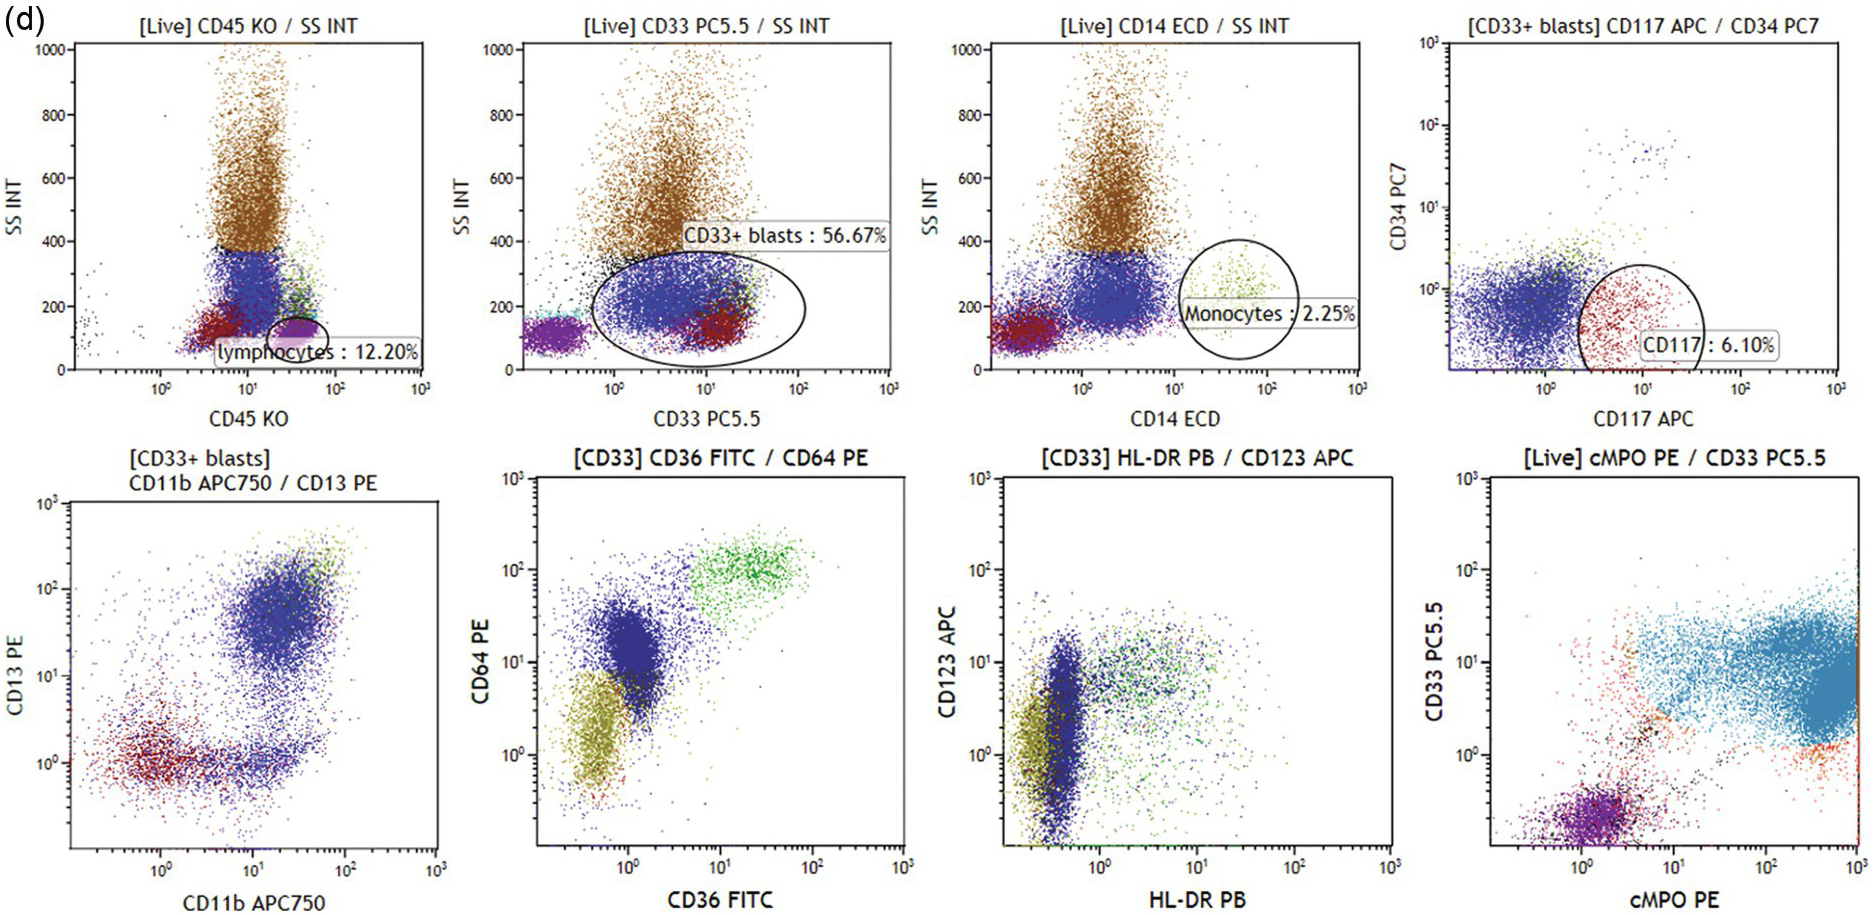
(d) Acute myeloid leukaemia with NPM1-mutation. Blasts show positivity for CD33/CD45dim and low/intermediate scatter (dark blue and dark red dots, left plots, upper panel). Only few mature monocytes are noted (right middle plot, upper panel). CD34 is negative and a fraction of blasts is CD117+ (right plot, upper panel). CD117+ blasts have lower CD45 expression, lower scatter, and are CD13–/CD11b– as opposed to CD33+CD117– blasts (right plot, upper panel and left plot, lower panel). Blasts show variable CD64 expression and are negative for HLA-DR (lower panel, middle plots). Strong expression of myeloperoxidase was noted (cyan dots, right plot, lower panel).
Various categories of acute leukaemias show immunophenotypes corresponding to various precursor populations as exemplified in Figure 19.3a–d.
Abnormal promyelocytes in acute promyelocytic leukaemia are an exception and are located in the region of granulopoietic precursors and neutrophils (CD45dim/SSChigh) (Figure 19.3a). In most cases leukaemic blasts are positive for CD34 and/or CD117 and show low to intermediate SSC (Figure 19.3b). Leukaemic blasts and promonocytes of some acute monocytic leukaemias may fall in the monocyte region (CD45int/bright/SSCint/high) and may show or do not show CD34 and/or CD117 expression (Figure 19.3c). Acute myeloid leukaemia with NPM1 mutation is usually characterized by negative CD34 and HLA-DR with intermediate SSC characteristics (Figure 19.3d).
Lineage assignment of acute leukaemia depends on lineage-associated marker expression (Table 19.4). Cases with co-expression of the markers of different lineages belong to the category of mixed phenotype acute leukaemia (MPAL, Figure 19.4) [12]. Intracellular markers such as myeloperoxidase (MPO), CD79a, cytoplasmic CD3 and lysozyme have to be evaluated after permeabilization of the cells (intracellular staining)[13]. Mixed phenotype acute leukaemia cases can present either with one population of blast cells that fulfils criteria for assignment to two (or rarely three) lineages (B-myeloid, T-myeloid, B-T or B-T-myeloid) or have subsets of blasts that show immunophenotype of AML or ALL or have a subset of blasts co-expressing lineage specific markers and separate subsets of AML and/or ALL blasts.
Table 19.4 Flow cytometry criteria for lineage assignment in diagnosis of mixed phenotype acute leukaemia[1, 12] to a single blast population.
| Myeloid lineage |
|---|
| MPO |
| or |
| Monocytic differentiation (at least two of markers: CD11c, CD14, CD64, lysozyme) |
| or |
| if MPO is negative in the blast population, it should fulfil criteria for AML with minimal differentiation |
| T-cell lineage |
| Cytoplasmic CD3 with antibodies to CD3 epsilon chain. |
| or |
| Surface CD3 (rare) |
| B-cell lineage |
| Strong CD19 with at least one strongly expressed: cytoplasmic CD22 or CD79a or CD10 |
| or |
| Weak CD19 with two or more strongly expressed: cytoplasmic CD22 and CD79a or CD10 |
Stay updated, free articles. Join our Telegram channel

Full access? Get Clinical Tree


