Protein and Exposure level (μg/mL)a
Intra-cellular signals
Bik
Adpn
AdipoR1357-375
Calcium (nM)b
MAPK p38c (% change)
MAPK ERKc (% change)
0
0
0
93
8 %
0 %
0
20
0
82
−14 %
7 %
0
40
0
Not measured
10
−33 %
20
0
0
4
−17 %
−5 %
0
0
20
84
0 %
5 %
0
0
40
Not measured
13 %
6 %
0
20
20
Not measured
19 %
7 %
0
40
40
Not measured
−14 %
−38 %
20
20
20
72
nm
nm
20
0
20
9
−13 %
6 %
20
20
0
91
−10 %
−14 %
Cardiomyocytes (C2C12) cultures typically maintain intra-cellular Ca2+ in an 80–90 nM constant range. Intra-cellular Ca2+ decreased to >5 nM with when cells were exposed to 20 μg/mL bikunin (Bik). The addition of bikunin (Bik) served as a means to strip cells of intra-cellular calcium and allowing means to diminished Ca2+ to zero base line for measuring increases in viable cells (See Chap. 12 for further information). Cells lysates showed Bik was maintained on cell surfaces during this treatment. Cells were further treated with Adpn or CTF 25 mer in presence and absence of Bik.
The addition of Adpn to Ca2+ depleted cell to restored intra-cellular Ca2+ to 91 nM (Table 5.1). Adpn binding of AdipoR signals activation of AMPK which regenerates the ATP major pathway and promotes the cytosolic localization of liver kinase B and a minor pathway (the phospholipase Ca2+/calmodulin-dependent protein kinase kinase-dependent pathway) that stimulates Ca2+ release from intracellular stores restoring cytosolic calcium (Jessen and Goodyear 2005; Zhou et al. 2009). Thus Ca2+ restoration is a good measure of Adpn activation of AMPK. The addition of AdipoR1357-375 CTF had no impact on intra-cellular Ca2+ whether cells were depleted by Bik or loaded with calcium (See Table 5.1). The Adpn restoration is useful tool to determine that receptor function is not impaired during CTF formation and release.
Over all, the mechanism of Ig-CTF formation and release remains unclear. However calcium depleted cardiomyocytes cell model do appear useful for study of enzymes and proteins required for Ig-CTF formation and release. As a pathway tool, cardiomyocytes could be grown with enzyme inhibitors and blockers in serum free media to examine factors required for Ig-CTF formation and release. Cardiomyocytes also allow monitoring Adpn activation of AMBK via normal adiponectin receptor function.
5.3.2 Cellular Insulin Uptake
Breast cancer cells (SKBR-3) did not contain any detectable CTF or AdipoR1 but did contain IDE and TACE (See on-line supplement for cell and tissue staining procedure at www.extras.springer.com/2015/978-3-319-21926-4). As CTF is absent in the cell but the target downstream protease IDE are present, SKBR-3 makes a good model for measuring the impact of CTF on intra-cellular insulin. Treatment of SKBR-3 with CTF increases the amount of intercellular insulin (See Fig. 5.1). The number of insulin loaded cells double when exposed to 10 ug/mL of CTF. The insulin loaded cells clearly showed intercellular fluorescence from the labeled insulin. The insulin loading cell model allows screening of compound to block CTF inhibition of IDE.
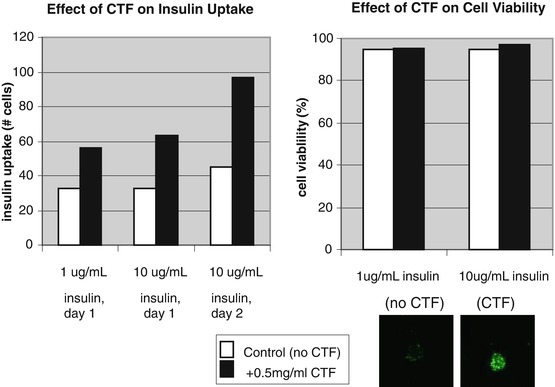

Fig. 5.1
Effect of CTF-25 mer on insulin uptake and cell viability in SKBR3 cell model. Breast cancer cells (SKBR) did not contain any detectable CTF or AdipoR1 but did contain IDE and TACE (by ICC method). This makes SKBR a good model for measuring the impact of CTF on cellular insulin degradation. Treatment of SKBR with CTF doubled the cellular labeled insulin. Cells treated with CTF maintain viability (proliferation) with no observable cell death (apoptosis). Insulin loading was demonstrated by fluorescence inside cells due to label on insulin
Cells treated with CTF maintain viability (proliferation) with no observable cell death (apoptosis) (See Fig. 5.1). Cardiomyocytes exposed to CTF also did not modulate phosphorylation of ERK and MAPK-p38 or slow proliferation (See Table 5.1). No observable cell death was noted. As insulin signaling of the PI3K/AKT/mTOR pathway increases proliferation and decreases apoptosis, insulin loading of cells would be expected to have reduce insulin receptor response and proliferation. However no impact to proliferation observed. It appears that CTF does not inhibit PI3K/AKT/mTOR intercellular signaling. This could be due to the excess of insulin used in cell culture media. An insulin straved model was not done. This proliferation effect contrasts the apoptotic impact of Adpn, which did suppress phosphorylation of ERK in cardiomyocytes (See Table 5.1) and restored intra-cellular Ca2+. Restored intra-cellular Ca2 would inhibit calcium dependent PI3K pathway and desensitize insulin response.
5.3.3 Impact on In-Vivo Insulin
Normal and diabetic rats were injected with CTF as part of a glucose tolerance challenge (See Tables 5.2–5.4 and Fig. 5.2). Normal and diabetic rats showed different behaviors. In normal rat showed substantial plasma insulin increases compared to control (See top two graphs of Fig. 5.2). Glucose was not reduced and insulin levels in plasma doubled in normal rats. This behavior matched an insulin resistance behavior. Diabetic rats which already had with impair insulin production (<10 % plasma insulin levels of normals) did not exhibit an increase in plasma insulin upon CTF exposure (See bottom two graphs of Fig. 5.2). It was further shown that diabetic rats post treatment had CTF loading in liver, pancreas, brain and lymph nodes where as normal rats did not (See Chap. 4).
Table 5.2
Glucose, insulin, HbA1c and CTF response in normal and diabetic rats: non diabetic rat group
Animal # | week | Animal ID | Body weight (g) | HbA1c % | Glucose (mg/dl) | Insulin (pg/mL) | CTF (pg/mL) | ||||||
|---|---|---|---|---|---|---|---|---|---|---|---|---|---|
Minutes after dose | – | pre | 60 | 120 | pre | 60 | 120 | pre | 60 | 120 | |||
ZDSD rat 1 | 0 | 815004001 | 544 | 5.25 | 105.0 | 263.0 | 164.0 | 595.6 | 1086 | 984.4 | 1.3 | 113.8 | 285.7 |
ZDSD rat 2 | 0 | 815004002 | 428 | 4.43 | 101.0 | 246.0 | 172.0 | 575.4 | 874.5 | 963.4 | 41.8 | 261.7 | 110.0 |
ZDSD rat 3 | 0 | 815004003 | 544 | 4.74 | 110.0 | 236.0 | 180.0 | 868.4 | 1307 | 1167 | 67.0 | 319.7 | 181.3 |
ZDSD rat 4 | 0 | 815004004 | 531 | 5.33 | 105.0 | 257.0 | 234.0 | 490.6 | 770.1 | 1093 | 78.0 | 350.5 | 139.8 |
ZDSD rat 5 | 0 | 815004005 | 483 | 5.17 | 99.0 | 304.0 | 250.0 | 595.1 | 808.4 | 876.4 | 111.8 | 184.0 | 74.8 |
ZDSD rat 6 | 0 | 815004006 | 552 | 5.50 | 108.0 | 261.0 | 176.0 | 559.9 | 791.9 | 1222. | 28.5 | 182.0 | 135.5 |
– | – | Mean | 513.67 | 5.07 | 104.7 | 261.2 | 196.0 | 614.2 | 939.5 | 1051. | 54.7 | 235.3 | 154.5 |
– | – | St. Dev. | 48.76 | 0.40 | 4.1 | 23.3 | 36.4 | 130.5 | 213.6 | 132.1 | 39.1 | 90.9 | 73.3 |
– | – | SEM
Stay updated, free articles. Join our Telegram channel
Full access? Get Clinical Tree
 Get Clinical Tree app for offline access

| |||||||||||

