Prevalence of Mobility Problems among Older Adults
Problems with mobility in older adults are common. In the United States, among noninstitutionalized persons 65 years and older, approximately 13% have difficulty in performing activities of daily living. Approximately 9% have difficulty with bathing, 8% have difficulty with walking, and 6% have difficulty with bed or chair transfers. The rate at which these problems occur increases progressively after the age of 65 years and climbs sharply after the age of 80 years, so that, for example, more than 34% of noninstitutionalized persons who are 85 years or older have mobility problems.
Age and Gender Differences in Falls and Fall-Related Injury Rates
Perhaps the most serious problem of mobility impairment is the tendency of older adults to fall and to be injured by falls. Death rates from falls per 100, 000 persons in 1999 were 9.1 for those between 65 and 74 years, 31.7 for those between 75 and 84 years, and 109.7 for those 85 years or older. For comparison, in those aged 75 years and older, the death rate from falls (67.9 per 100,000) is more than double that from motor vehicle accidents (29.8 per 100, 000). Falls and fall injuries are of substantial concern because of their frequency and because of their physical, psychological, and social consequences. Even a fall that does not result in injury can have a substantially adverse effect on an older person’s self-confidence, mobility, and independence. Indeed, fear of falling, which can accompany decreased mobility, can lead to decreased physical activity outside and avoidance of social activities because of the possibility of embarrassment as well as injury in connection with a fall.
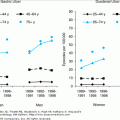
Older females are substantially more prone to fall and to be injured in a fall than are older males. Three studies of rates of falls, involving more than 4500 adults ages 65 years or older, found those rates to range from 137 to 690 falls per 1000 persons per year, with older females falling from 1.3 to 2.2 times more often than older males. Three studies of rates of fall injuries requiring medical attention, involving more than 38, 000 adults, found that fall injuries leading to hospital admission or death occurred in males and females at rates per 1000 persons per year of 1.88 and 0.83, respectively, for those aged 20 to 29 years and increased steadily with age to 6.97 and 15.58, respectively, for those aged 70 to 79 years. Correspondingly, female-to-male ratios of these serious fall injury rates increased with age from 0.44 to 2.24.
In 1996, there were 340,000 hip fractures requiring hospital admission. The direct medical and other costs for the injury have been estimated as being at least $16,300 in the first year following the injury. With current trends, approximately 500, 000 hip fractures are expected to occur in the year 2040, with an associated total annual cost of $240 billion. Most hip fractures occur in old adults, and more than 95% of those hip fractures result from a fall; the remainder fracture spontaneously during a physically stressful activity or prior to the fall.
Hip fractures can be devastating, particularly in older women. In 1998, there were 863 hip fractures per 100,000 adults older than 65 years (1056 and 593 per 100,000 in women and men, respectively), with the highest rate in white women 85 years and older (2690 hip fractures per 100,000). Approximately 20% of women who fracture their hip do not survive the first year after fracture, and another 20% do not regain the ability to walk unassisted. The incidence of hip fractures rises much faster with age than that of falls. This increase in hip fractures with age is not fully accounted for by increases in the number of falls or decreases in bone mass of the hip with age. Therefore, other factors must increase susceptibility to hip fractures. The biomechanics of the fall arrest responses are likely to be among these factors. More than 85% of wrist fractures involve falls. The incidence of wrist fractures rises from the age of 50 to 65 years and then reaches a plateau after the age of 65 years, but why this occurs is not yet known.
Most falls (78.3%) in those 65 years and older occur in or within the immediate vicinity of the home. Much is known about the epidemiology of falls, but little is known about the mechanisms responsible for the remarkable increase with aging in falls and fall-related injury rates. Diagnosis of specific diseases does not discriminate elderly fallers from elderly nonfallers. Individual risk factors for falls may be grouped into intrinsic and extrinsic factors. Intrinsic factors include decreased level of physical activity, cognitive impairment, depression, visual deficits, sensory and strength deficits in the lower limbs, previous stroke, dizziness, medications, abnormal balance and gait, use of assistive devices, and age more than 80 years. Extrinsic factors include environmental factors including stairs and obstacles in the gait path that can cause trips or slips. The presence of multiple risk factors substantially increases the risk of a fall. Little is known about the changes with age in impending fall response biomechanics that must, in part, be responsible for the rate changes. For example, tripping is commonly self-reported by older persons as a cause of falls: In a 1-year study of 1042 persons greater than 65 years of age, tripping was reported to be the cause of the fall in 53% of the 356 falls that were documented. Whatever the underlying neurological and physiological mechanisms, responses to trips are ultimately expressed in terms of biomechanical factors.
There probably are a number of factors that determine whether a fall will result in an injury: the initial conditions under which the fall begins, the biomechanics of the response during the fall, the passive and active mechanisms for dissipating energy on impact with the ground or other surfaces, and the proneness to injury of the hard and soft tissues that are impacted. However, the biomechanics of fall arrests and of fall-related injuries have received little attention. Clear need exists to examine them, in order to improve assessments of risk and programs for both intervention and prevention.
The risk of bony fracture has been defined by Hayes and colleagues as the ratio of the magnitude of the force applied to the bone divided by the force necessary to cause fracture. A fall from standing height directly onto the greater trochanter carries a 21-fold higher risk for hip fracture than landing on another body part. This is because the loss in potential energy associated with such a fall is an order of magnitude greater than the average energy required to fracture the proximal femur in elderly cadaver specimens. Hence, falls in a lateral direction, which carry a higher risk for landing on the hip than other directions, must be avoided if possible. This is particularly true in an individual with reduced bone mineral density and reduced body mass index. Reductions in the latter are associated with less soft tissue over the hip to dissipate the impact energy. Hip pad protectors can be effective in reducing the risk of hip fracture in frail ambulatory elderly. By diverting the impact energy to adjacent tissues, the impact force on the hip may be more than halved. However, patient compliance has been problematic because the pads are uncomfortable to sleep with and the garment in which they are located can impede dressing and undressing.
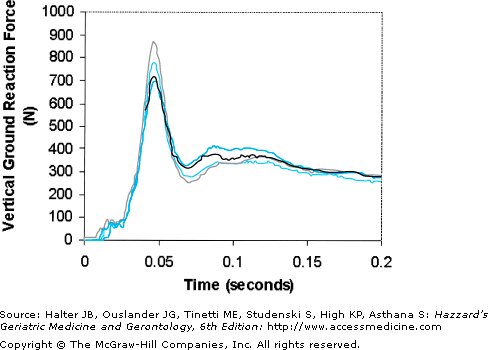
Once a fall is initiated, fall arrests have two post initiation phases: a preimpact phase and an impact phase. In a fall from standing height, the preimpact phase lasts approximately 0.7 seconds as the body falls to the ground. The impact phase lasts only tens of milliseconds for structures near the impact site (Figure 113-1) to a few tenths of a second at more proximal body sites further from impact. Thus, for structures near the impact site, like the hands and elbows in a forward fall, short- and long-loop neuromuscular reflexes are simply too long to be able to alter the fall arrest strategy during the impact phase.
Figure 113-1.
Example of the measured wrist impact force plotted versus time for one hand in four consecutive forward falls onto both arms for a young subject weighing 620 N. The subject fell onto a lightly padded surface from a shoulder height of 1 m. Note that (1) the time-to-peak force is less than any upper extremity neuromuscular reflex, rendering reflexes unable to protect the wrist, and (2) the magnitude of the peak impact force on one hand exceeds as much as one body weight for a brief time in two of the four trials, mainly as a result of the ground arresting the downward momentum of the upper extremity over a relatively short distance. (Data from DeGoede KM, Ashton-Miller JA: Fall arrest strategy affects peak hand impact force in a forward fall. J Biomech. 2002;35:843.)
The hands and arms are commonly used to protect the head and torso during a fall. The factors that determine the risk of Colles fracture, the most common upper extremity fall-related injury, are the height of the fall and the compliance of the surface. Moreover, at impact, the relative velocity of the hand as it strikes the surface, the elbow flexion angle, the angle of the lower arm with respect to the ground, and, of course, forearm bone mineral density status play a role. There is almost always time for older women or men to deploy their upper extremities in the event of a fall. But our research shows that a fall by an older woman from 25 cm or more onto a stiff surface, when landing with a straight arm, will almost certainly break the wrist. However, falling onto a slightly flexed arm will reduce this risk, although triceps and shoulder muscle strength is required to prevent the elbow from buckling. If the elbow buckles then the head, face, and cervical spine are placed at risk of injury. This justifies encouraging elderly people to maintain extensor muscle strength in the upper extremities so that they can better protect themselves in a fall.
Age Changes in Components of Biomechanical Capability
The biomechanical factors that underlie mobility impairments among older adults in general, and falling and fall injuries in particular, are not well understood. To come to that understanding, examination of the changes in biomechanical capabilities that occur with natural aging and with disease is merited. This section discusses the changes that occur in myoelectric latencies, reaction times, proprioception, joint ranges of motion (ROM), and muscular strengths and the rapid development of those strengths.
The myoelectric latency or premotor time is the delay from a test stimulus cue to the onset of the first measurable change in myoelectric activity in a muscle. Myoelectric activity refers to the electrical signals sent through the nerves to initiate or modify the muscle contraction process. At the latency time, the muscle will not have yet developed any significant contractile force or, if already contracted, changed that force. Myoelectric latencies typically range from 30 to 50 milliseconds for myotatic reflexes involving the muscle spindles, 50 to 80 milliseconds when cerebellar or cortex neural pathways are involved, 80 to 120 milliseconds when afferent receptors and higher motor centers are involved, and 120 to 180 milliseconds for volitional actions.
The term “reaction time” refers to the delay from a stimulus signaling a needed reaction to making a movement or developing a force. Reaction time is longer than myoelectric latency because it includes both the myoelectric latency and the finite time required for a muscle to develop or change its force magnitude after myoelectric activity begins. This additional time interval is called the motor time.
Researchers define reaction time in different ways. For example, in studies of postural control, reaction time is often defined as the delay between stimulus onset and the first measurable change in the forces exerted by the feet on the floor support. This reaction force is usually measured with an instrumented force plate. This force development reaction time incorporates the myoelectric latency and the motor time required for the muscles to contract in order to alter the body configuration enough to change the support force. This happens with little discernible foot movement or limb-segment acceleration. Reaction time has also been defined to be the delay from stimulus onset until the first detectable acceleration of a body segment. This might be termed segment acceleration reaction time. Reaction time has also been defined as the delay from stimulus onset until a limb has been moved to a target. This movement-to-target reaction time incorporates myoelectric latencies, body-segment acceleration reaction times, and body-segment movement times. Movement reaction times depend on how far body segments have to be moved. Reaction times also depend on how many choices a subject has in responding to a cue. Simple reaction times are those exhibited when no choices are given to the subject. Choice reaction times are those exhibited when the subject must decide between two or more courses of action, depending on which of two or more cues is presented. Choice reaction time increases in proportion to the logarithm of the number of choices to be made. Choice reaction times are, therefore, considerably longer than simple reaction times. A speed-accuracy tradeoff is also found in reaction time measurements. As the accuracy requirement of the task is increased, reaction time increases. These differing definitions of reaction time and differing circumstances in which it is measured make it difficult to compare results from different studies of reaction times. Meaningful data on group differences in reaction times seem best obtained by comparing those times among different groups performing the same task, with the reaction time measure defined in the same way among the different groups.
Many studies report statistically significant age differences, but not gender differences, among healthy adults in myoelectric latencies. Myoelectric latencies are typically 10 to 20 milliseconds longer in healthy old than in young adults.
Age systematically increases force development reaction times. Older, compared with younger, adults require perhaps 10 to 30 milliseconds longer to volitionally develop from rest modest levels of ankle torque or to begin to take a step upon loss of balance. Systematic age differences in movement-to-target reaction times are often found. These increase on the order of 2 milliseconds per age decade between the second and 10th decades. Age differences increase when subjects are not warned several seconds in advance of the cue that it is imminent. Much larger increases with age occur in choice reaction times than in simple reaction times. For example, in 10-choice button pushing tasks, where choices were identified by letter or color or both, choice reaction times increased 27% to 86% more in subjects aged 65 to 72 years compared with those aged 18 to 33 years. No notable gender differences in reaction times have been reported.
Despite these statistically significant age differences, of 10 to 20 milliseconds in latencies and of 15 to 30 milliseconds in some reaction times, these seem seldom critical to mobility function. Even rapid responses in time-critical situations take place during perhaps 200 to 500 milliseconds, so these latency and reaction time differences compared with the task execution times are not large. For example, among healthy older adults, the time required to fully contract a muscle is on the order of 400 milliseconds. The time to lift a foot in order to take a quick step is on the order of 200 to 400 milliseconds. Adults need warning times on the order of 400 to 500 milliseconds to be able to stop before reaching or to turn away from obstacles that come suddenly to attention.
Reaction times, which include muscle latencies, are task and strategy dependent. These are modifiable by central command. Reaction times of older adults are not always slower than those of young. Moreover, reaction times do not necessarily predict performance on complex mobility tasks. For example, one of our studies found that simple reaction times in lifting a foot immediately upon a visual cue did not predict how well the same young or older subjects could avoid stepping on a suddenly appearing obstacle during level gait. In fact, age-group differences in simple reaction times were substantially larger than age-group differences in the response times needed to avoid the obstacles successfully.
Proprioception describes awareness of body-segment positions and orientations. Relatively few studies have examined changes with aging in proprioception. One study found joint position sense in the knee to deteriorate with age. Joint angles could be reproduced to within 2 degrees by 20-year-olds, but only to within 6 degrees by 80-year-olds. Twenty-year-olds could detect passive joint motions of 4 degrees, but 80-year-olds could detect only motions larger than 7 degrees. Other studies have found no major decline with age in motion perception in finger and toe joints but have found declines with aging in sensing vibration. Proprioceptive acuity at a joint is significantly better when muscles at the joint are active than when these are passive. Proprioceptive thresholds during weight bearing are at least an order of magnitude lower than those typically reported during non-weight-bearing tests. Recent studies exploring the effect of age on thresholds for sensing ankle rotations show that healthy adults can sense quite small rotations in the sagittal and frontal planes under the weight-bearing conditions of upright stance. The probability of successful detection of rotation increases with increasing magnitude and speed of imposed foot rotation. A 10-fold reduction in the angular threshold was observed on increasing the speed of rotation from 0.1 to 2.5 degrees per second, but thresholds did not further reduce at higher speeds. In healthy adults between the third and eighth decades, age, rotation angle, and rotation speed also significantly affected the threshold for sensing the direction of foot rotation. Threshold angles were three to four times larger in older females than in younger females.
Individuals with central or peripheral proprioceptive impairments can exhibit articular pathology. Examples include Charcot changes occurring in the upper or lower extremities owing to central nervous system damage by syringeomyelia over several levels of the spinal cord and changes in the foot or ankle owing to lower extremity peripheral neuropathy often associated with diabetes. Indeed it is prudent to warn older diabetic patients planning an exercise program about the risk of developing Charcot feet if they try to return to activities requiring the feet to impact the ground in order to abruptly change direction (i.e., racquet sports or running), since they simply may not feel compression fractures of the bones comprising the arches of the feet. These can lead to skin breakdown, thereby increasing the risk for serious infection and even amputation.
Peripheral neuropathy increases the proprioceptive threshold at the ankle nearly fivefold compared with age-matched healthy controls. This increased threshold adversely affects postural stability and raises the risk of obstacle contact during gait, suggesting one mechanism that might underlie the 20-fold increase in fall risk and the 6-fold increase in fall-induced fractures that these patients have.
Body joint ROM have generally been found to diminish with age, but not all findings are consistent. For example, studies have reported approximately a 20% decline between ages 45 and 70 years in hip rotation and 10% declines in wrist and shoulder ROM. Comparisons of the ROM of lower extremity joints for young and middle-aged adults with those for older adults showed declines ranging from negligible to 57%. At the age of 79 years, one-fifth of a large group of subjects had restricted knee joint motion and two-thirds had restricted hip joint motion. Among more than 3000 blue-collar workers with ages ranging from 20 to 60 years, a 25% decline with age was found in ability to bend to the side and a 45% decline in shoulder motion. Declines of 25% to 50% have been found in various ROM of the lumbar spine between ages of 20 to 80 years. However, a comparison between two groups with mean ages of approximately 65 and 80 years found no significant differences in 28 different joint ROM. At least one study suggests that passive or active stretching exercises can increase hip extension ROM in young adults by 8 to 17 degrees, and another study suggested that exercises with a focus on stretching improve spine flexibility in older adults.
The effects of decreased ROM on abilities to perform activities of daily living are not well understood in young or old adults. One study of adults with arthritis found that the ability to move around in one’s environment correlated well with ROM in knee flexion, the ability to bend down correlated with hip flexion ROM, and the abilities in activities requiring use of hands and arms correlated well with ROM of the upper extremities. Another study found that restricted knee motion in 79-year-olds correlated with disability in entering public transport vehicles but that ROM impairment did not generally associate with commitment to institutional care. A third study found the majority of a group of 134 people aged 79 years to have enough spinal mobility to perform common activities of daily living.
The loss of strength with age, even in healthy and physically active older adults (Table 113-1), has long been recognized. Isometric strengths peak at approximately the age of 25 years and then decline. The loss is approximately one-third by the age of 65 years. Isometric strength is more reliably measured, and considerably greater values are recorded, when the patient exerts force on a fixed force transducer, rather than one held by an examiner. To express the strength developed about the joint in units of torque, the force (in Newtons) developed by the limb segment against a force-measuring transducer is multiplied by its lever arm (in meters) about the joint being tested. Muscle strength about a joint is, therefore, expressed in torque units (i.e., Nm), and these torque units can be normalized by body size (i.e., body height * body weight) to facilitate gender or age comparisons. Dominant limb strengths are typically approximately 10% greater than nondominant strengths. It has long been recognized that mean strengths of female adults of any age are on the order of one-third lower than those of male adults (see Table 113-1). However, when those strengths are normalized by body size, then the difference may no longer be significant. Reports of strength values vary widely because these depend on many factors, for example substantially on whether subjects have impairments or experience pain or discomfort during testing, at which joint angles, whether under isometric or constant velocity conditions, and, at constant velocity, whether muscle shortening or lengthening is occurring. As an example, maximum knee extensor torque in healthy individuals decreases by 14%, 23%, 41%, and 53% of isometric values at joint rotation speeds of 30, 60, 90, and 180 degrees/s, respectively. Isokinetic dynamometers do not measure maximum torque or power accurately at speeds above 180 degrees/s because of substantial measurement artifacts.
HEALTHY YOUNG ADULTS* | HEALTHY OLDER ADULTS† | |||
|---|---|---|---|---|
DATA SOURCE | Females | Males | Females | Males |
Toe flexors | 14 | 24 | 11 | 16 |
Ankle dorsiflexors | ||||
Sepic et al. | 44 | 78 | 46 | 74 |
Thelen et al. | 28 | 43 | 22 | 37 |
Ankle plantarflexors | ||||
Sepic et al. | 100 | 129 | 82 | 131 |
Thelen et al. | 130 | 181 | 88 | 137 |
Knee flexors | ||||
Borges | 100 | 155 | 65 | 109 |
Knee extensors | ||||
Borges | 183 | 289 | 128 | 188 |
Hip flexors | ||||
Cahalan et al. | 66 | 108 | 51 |
|
