Sample
Sample n (%)
Total
38,630 (100)
Gender
Women
Men
Missing
21,606 (56)
17,024 (44)
0 (0)
Age (years)
15–54
55–74
75+
Missing
24,312 (63)
12,028 (31)
2290 (6)
0 (0)
Marital status
Married
Single
Separated
Missing
16,884 (44)
7631 (20)
6075 (16)
8040 (21)
Education
With degree
Without degree
Missing
6932 (18)
23,661 (61)
8037 (21)
Employment
Employed
Not employed
Retired
Missing
15,601 (40)
7211 (19)
8051 (21)
7767 (20)
Quintile of area income deprivation
1 (least deprived)
2
3
4
5 (most deprived)
Missing
4595 (12)
5490 (14)
8118 (21)
8316 (22)
12,111 (31)
0 (0)
1.3.1 Knowledge About the Most Common Types of Cancer
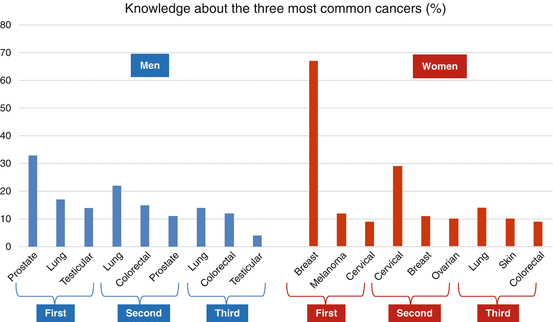
The correct answers were that in England the first, second and third most common types of cancer are: prostate, lung and colorectal cancer in men, and breast, lung and colorectal cancer in women [2]. This is very similar to cancer incidence worldwide, where lung, prostate and colorectal cancer in men, and breast, colorectal and lung cancer in women take the first, second and third place, respectively [1].
Knowledge about the most common types of cancer among men and women was poor. Only 12% of participants correctly reported that colorectal cancer is the third most common cancer in men, and only 9% correctly reported this for women (Fig. 1.1). Only 10% of participants correctly reported that lung cancer is the second most common cancer in men, while only 8% were aware that this is also the second most common cancer in women. The majority of participants correctly reported that breast cancer is the first most common cancer in women (67%), but only a third (33%) were aware that prostate cancer is the most common type of cancer in men (Fig. 1.1). About a third of participants thought colorectal cancer was in the top three cancers (36%).


Fig. 1.1
Frequencies of reported most common types of cancer in men and women (%)
1.3.2 Awareness of Colorectal Cancer Symptoms
Almost a half of participants in our sample (46%) could not recall any of the four common symptoms of colorectal cancer: unexplained bleeding, change in bowel habit, unexplained weight loss or unexplained pain. Only 3% of participants were able to recall all these symptoms. When participants were asked to recognise the symptoms from the list (prompted), their results were better as 61% of participants recognised all four symptoms of colorectal cancer. Participants recognised on average 3 (mean: 3.3; SD: 1.0), and recalled less than one symptom out of a possible four (mean: 0.9; SD: 1.0).
Participants most frequently recalled “unexplained bleeding” (26%); and least frequently recalled “change in bowel habit” (14%) (Table 1.2). They most frequently recognised “change in bowel habit” (86%); and least frequently recognised ‘unexplained persistent pain’ (78%) as potential symptoms of colorectal cancer. There were statistically significant differences between socio-demographic groups in cancer symptom awareness (Table 1.2). Overall, participants who least frequently recalled and recognised the four cancer symptoms were men, the youngest, participants with low SEP, currently unemployed and single. For example, ‘unexplained bleeding’ was recalled by 23% of men (vs. 28% women), 18% of participants between 15 and 34 years old (vs. 31% of 55–74 year-olds), 23% of those with the lowest SEP (vs. 28% of the highest SEP), 25% of participants without a university degree (vs. 31% with a degree), 22% of the unemployed (vs. 27% of the employed), and 18% of single participants (vs. 28% of married ones).
Table 1.2
Recognition of symptoms of colorectal cancer and anticipated delay >2 weeks to help-seeking % (n)
Recognition of four symptoms of colorectal cancer and anticipated time to help-seeking % (n) | ||||||||||||
|---|---|---|---|---|---|---|---|---|---|---|---|---|
Unexplained bleeding | Anticipated delay > weeks | Change in bowel habit | Anticipated delay > weeks | Unexplained pain | Anticipated delay > weeks | Unexplained weight loss | Anticipated delay > weeks | |||||
Unprompted | Prompted | Unprompted | Prompted | Unprompted | Prompted | Unprompted | Prompted | |||||
All participants | 26 (9951) | 85 (32,811) | 5 (1793) | 14 (5577) | 86 (33,240) | 19 (7193) | 24 (9130) | 78 (30,135) | 12 (4567) | 23 (9000) | 84 (32,301) | 38 (14,281) |
Gender | ||||||||||||
Men | *23 (3951) | *82 (13,971) | 5 (812) | *13 (2312) | *84 (14,314) | 13 (2100) | *23 (3848) | 78 (13,317) | *13 (2100) | *22 (3760) | *81 (13856) | *37 (6153) |
Women | 28 (6000) | 87 (18,840) | 5 (981) | 15 (3265) | 88 (19,026) | 12 (2467) | 24 (5282) | 78 (16,818) | 12 (2467) | 24 (5240) | 85 (18,445) | 39 (8128) |
Age group | ||||||||||||
15–34 | *18 (1848) | *78 (7856) | *5 (479) | *9 (879) | *79 (7983) | *19 (1834) | *21 (2097) | *77 (7683) | *11 (1138) | *21 (2082) | *76 (7604) | *40 (3940) |
35–54 | 27 (3825) | 86 (12,293) | 5 (746) | 13 (1914) | 87 (12,449) | 21 (2890) | 24 (3446) | 79 (11,263) | 13 (1827) | 25 (3527) | 85 (12,149) | 40 (5628) |
55–74 | 31 (3736) | 89 (10,763) | 4 (480) | 20 (2431) | 92 (10,935) | 19 (2171) | 26 (3071) | 79 (9520) | 12 (1380) | 24 (2915) | 89 (10,673) | 36 (4045) |
75+ | 24 (542) | 83 (1899) | 4 (88) | 15 (353) | 86 (1973) | 13 (298) | 22 (516) | 73 (1669) | 10 (222) | 21 (476) | 82 (32,301) | 30 (668) |
Quintile of area income deprivation | ||||||||||||
1 (most affluent) | *28 (1294) | *88 (4063) | *6 (268) | *17 (771) | *90 (4131) | *24 (1088) | *26 (1191) | *81 (3720) | *15 (697) | *21 (983) | *85 (3925) | *44 (2009) |
2 | 28 (1557) | 88 (4854) | 5 (281) | 17 (928) | 90 (4935) | 21 (1143) | 24 (1309) | 81 (4437) | 13 (720) | 21 (1145) | 86 (4752) | 41 (2186) |
3 | 27 (2183) | 86 (7027) | 5 (416) | 16 (1322) | 88 (7148) | 20 (1582) | 25 (2014) | 80 (6513) | 13 (1033) | 23 (1883) | 85 (6913) | 40 (3124) |
4 | 25 (2111) | 83 (6844) | 4 (369) | 14 (1216) | 85 (7076) | 18 (1426) | 24 (1988) | 77 (6380) | 11 (922) | 27 (2227) | 82 (6829) | 34 (4005) |
5 (most deprived) | 23 (2806) | 92 (9923) | 4 (459) | 11 (1340) | 83 (10,050) | 17 (1954) | 22 (2628) | 75 (9085) | 10 (1195) | 23 (2762) | 82 (9882) | 38 (14,281) |
Education | ||||||||||||
With degree | *31 (2198) | *89 (6177) | 5 (356) | *19 (1328) | *91 (6282) | *24 (1618) | *30 (2100) | *84 (5836) | *14 (970) | *31 (2146) | *88 (6071) | *44 (2999) |
No degree | 25 (5831) | 85 (20,186) | 5 (1101) | 14 (3210) | 87 (20,629) | 18 (4159) | 22 (5213) | 76 (18,117) | 12 (2721) | 22 (5284) | 84 (19,939) | 35 (8051) |
Missing | 24 (1922) | 80 (6448) | 4 (336) | 13 (1039) | 80 (6429) | 19 (1416) | 23 (1817) | 77 (6182) | 11 (876) | 19 (1570) | 78 (6291) | 42 (3231) |
Employment | ||||||||||||
Employed | *27 (4235) | *87 (13,613) | *5 (790) | *15 (2331) | *89 (13,840) | *21 (3180) | *25 (3948) | *80 (12,422) | *13 (2021) | *26 (4093) | *85 (13,289) | *40 (6092) |
Unemployed | 22 (1561) | 80 (5798) | 5 (385) | 10 (728) | 82 (5939) | 19 (1307) | 21 (1488) | 75 (5422) | 12 (839) | 22 (1605) | 81 (5829) | 35 (2474) |
Retired | 30 (2437) | 89 (7162) | 4 (278) | 21 (1723) | 91 (7357) | 17 (1294) | 26 (2117) | 78 (6295) | 11 (832) | 24 (1980) | 88 (7118) | 33 (2466) |
Missing | 22 (1718) | 80 (6238) | 4 (340) | 10 (795) | 80 (6204) | 18 (1412) | 20 (1577) | 77 (5996) | 11 (875) | 17 (1322) | 78 (6065) | 43 (3249) |
Marital status | ||||||||||||
Married | *28 (4807) | *88 (14,864) | *4 (719) | *17 (2815) | *90 (15,169) | 19 (3140) | *26 (4327) | *79 (13,373) | *12 (1952) | *25 (4200) | *87 (14,692) | *37 (6093) |
Single | 18 (1413) | 80 (6122) | 6 (438) | 8 (594) | 82 (6301) | 19 (1443) | 19 (1423) | 76 (5837) | 13 (967) | 22 (1703) | 79 (6019) | 37 (2739) |
Separated | 28 (1718) | 88 (5364) | 5 (290) | 17 (1044) | 90 (5442) | 19 (1129) | 25 (1529) | 77 (4707) | 13 (725) | 24 (1491) | 87 (5288) | 36 (2064) |
Missing | 25 (2013) | 80 (6461) | 4 (346) | 14 (1124) | 80 (6428) | 19 (1481) | 23 (1851) | 77 (30,135) | 12 (923) | 20 (1606) | 78 (6302) | 43 (3385) |
These results persisted in the multivariable logistic regression analysis, where age group, gender, marital status, educational level, employment status, and SEP were all associated with recognition of each cancer symptom (Table 1.3). Women were more likely than men to recognise cancer symptoms, except “unexplained persistent pain”. For example, the odds of recognising “unexplained bleeding” were about 50% higher in women than men (OR = 1.49; 95% confidence interval (CI): 1.41–1.58). The youngest participants were least likely to recognise each of the symptoms, with the exception of an “unexplained, persistent pain” which was least likely recognised by 75+ year-olds (OR = 0.70; 95%CI: 0.63–0.77). Participants aged between 55 and 74 were most likely to recognise each of the four possible symptoms of cancer. There was a strong trend suggesting that the lower the SEP, the less likely the participants were to recognise the symptoms.
Table 1.3
Recognition of symptoms of colorectal cancer by socio-demographic group, in models adjusted for age group, gender and area income deprivation (n = 38,630)
Recognition of symptoms OR (95%CI, *p-value < 0.05) | ||||
|---|---|---|---|---|
Unexplained bleeding | Change in bowel/bladder habit | Unexplained persistent pain | Unexplained weight loss | |
Gender a | ||||
Men Women | 1.00 1.49* (1.41–1.58) | 1.00 1.40* (1.32–1.49) | 1.00 0.97 (0.93–1.02) | 1.00 1.33* (1.26–1.40) |
Age group a | ||||
15–34 | 0.43* (0.40–0.46) | 0.40* (0.37–0.43) | 0.88* (0.82–0.94) | 0.40* (0.37–0.43) |
35–54 | 0.73* (0.67–0.79) | 0.68* (0.63–0.74) | 0.99 (0.93–1.05) | 0.72* (0.67–0.78) |
55–74 | 1.00 | 1.00 | 1.00 | 1.00 |
75+ | 0.56* (0.49–0.63) | 0.61* (0.53–0.69) | 0.70* (0.63–0.77) | 0.56* (0.50–0.64) |
Quintile of area income deprivation a | ||||
1 (most affluent) | 1.00 | 1.00 | 1.00 | 1.00 |
2 | 0.98 (0.87–1.11) | 0.98 (0.86–1.21) | 0.98 (0.89–1.09) | 1.08 (0.96–1.21) |
3 | 0.84* (0.75–0.94) | 0.83* (0.73–0.93) | 0.94 (0.86–1.04) | 0.98 (0.88–1.09) |
4 | 0.67* (0.60–0.75) | 0.65* (0.58–0.73) | 0.77* (0.70–0.84) | 0.80* (0.72–0.88) |
5 (most deprived) | 0.60* (0.54–0.67) | 0.56* (0.50–0.62)
Stay updated, free articles. Join our Telegram channel
Full access? Get Clinical Tree
 Get Clinical Tree app for offline access

| ||


