- Carlo Brugnara
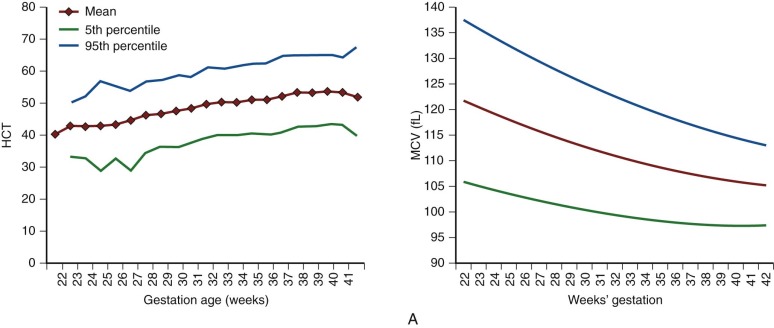
| Week of Gestation | Hemoglobin (g/dL) | RBCs (×10 6 /mL) | Hematocrit (%) | Mean Corpuscular Volume (fL) | Total WBCs (×10 6 /µL | Corrected WBCs (×10 6 /µL) | Platelets (×10 6 /µL) |
|---|---|---|---|---|---|---|---|
| 18-21 (N = 760) | 11.69 ± 1.27 | 2.85 ± 0.36 | 37.3 ± 4.32 | 131.1 ± 11.0 | 4.68 ± 2.96 | 2.57 ± 0.42 | 234 ± 57 |
| 22-25 (N = 1200) | 12.2 ± 1.6 | 3.09 ± 0.34 | 38.59 ± 3.94 | 125.1 ± 7.8 | 4.72 ± 2.82 | 3.73 ± 2.17 | 247 ± 59 |
| 26-29 (N = 460) | 12.91 ± 1.38 | 3.46 ± 0.41 | 40.88 ± 4.4 | 118.5 ± 8.0 | 5.16 ± 2.53 | 4.08 ± 0.84 | 242 ± 69 |
| >30 (N = 440) | 13.64 ± 2.21 | 3.82 ± 0.64 | 43.55 ± 7.2 | 114.4 ± 9.3 | 7.71 ± 4.99 | 6.4 ± 2.99 | 232 ± 87 |
* Hematologic data obtained with a Coulter S plus II instrument. Total WBC count included nucleated red blood cells. Corrected WBC count included only WBCs, after subtracting the nucleated red cell component, based on a 100-cell manual differential.
| Week of Gestation | Lymphocytes (%) | Neutrophils (%) | Eosinophils (%) | Basophils (%) | Monocytes (%) | Nucleated RBCs (% of WBCs) |
|---|---|---|---|---|---|---|
| 18-21 (N = 186) | 88 ± 7 | 6 ± 4 | 2 ± 3 | 0.5 ± 1 | 3.5 ± 2 | 45 ± 86 |
| 22-25 (N = 230) | 87 ± 6 | 6.5 ± 3.5 | 3 ± 3 | 0.5 ± 1 | 3.5 ± 2.5 | 21 ± 23 |
| 26-29 (N = 144) | 85 ± 6 | 8.5 ± 4 | 4 ± 3 | 0.5 ± 1 | 3.5 ± 2.5 | 21 ± 67 |
| >30 (N = 172) | 68.5 ± 15 | 23 ± 15 | 5 ± 3 | 0.5 ± 1 | 3.5 ± 2 | 17 ± 40 |
| Characteristic | Study Sample (N = 167) | Vaginal Delivery (N = 63) | Cesarean Section (N = 104) | P-value 2 | |||
|---|---|---|---|---|---|---|---|
| Median | Range | Median | Range | Median | Range | ||
| WBC (×10 9 per l) | 15.1 | 5.54-39.7 | 18.4 | 12.0-34.1 | 13.6 | 8.54-39.7 | <0.0001 |
| RBC (×10 12 per l) | 4.7 | 3.46-6.62 | 4.78 | 3.89-6.30 | 4.62 | 3.46-6.62 | NS |
| Hb (g l −1 ) | 174 | 130-234 | 176 | 140-230 | 171 | 130-234 | NS |
| Hct (%) | 53.6 | 40.1-73.1 | 54.7 | 41.9-73.1 | 52.6 | 40.1-72.2 | NS |
| MCV (fl) | 112 | 97.7-127 | 114 | 105-127 | 112 | 97.7-125 | NS |
| MCH (pg) | 36.5 | 31.4-41 | 36.5 | 31.4-41 | 36.6 | 32-39.9 | NS |
| MCHC (g l −1 ) | 324 | 303-359 | 323 | 308-359 | 324 | 303-344 | NS |
| RDW (%) | 17.4 | 14.2-23.6 | 17.4 | 14.9-23.6 | 17.4 | 14.2-23.3 | NS |
| PLT (×10 9 per l) | 270 | 161-607 | 297 | 169-607 | 254 | 161-424 | 0.0053 |
| MPV (fl) | 8.7 | 7.5-11.5 | 8.7 | 7.7-11.4 | 8.8 | 7.5-11.5 | NS |
| Plateletcrit (%) | 0.24 | 0.15-0.48 | 0.26 | 0.15-0.48 | 0.23 | 0.15-0.36 | 0.0056 |
| CD34+ cells (×10 6 per l) | 43.9 | 7.14-253 | 47.7 | 15.9-253 | 39.9 | 7.14-120 | 0.007 |
* aP-values of the differences between vaginal delivery and cesarean section. The concentrations were standardized to exclude the varying effect of the anticoagulant.
| Mean ± SD | |
|---|---|
| Red Blood Cells | |
| Hb (g/dL) | 15.3 ± 1.3 |
| Hct (%) | 49 ± 5 |
| RBC (×10 6 /µL) | 4.3 ± 0.4 |
| MCV (fL) | 112 ± 6 |
| MCH (pg) | 36.2 ± 2.2 |
| MCHC (g/dL) | 30.9 ± 1.3 |
| CHCM (g/dL) | 30.4 ± 1.2 |
| % HYPO (MCHC <28 g/dL) | 17.3 ± 11.9 |
| % HYPER (MCHC >41 g/dL) | 0.6 ± 0.3 |
| % MICRO (MCV <61 fL) | 0.8 ± 0.3 |
| % MACRO (MCV >120 fL) | 31.8 ± 9.7 |
| Reticulocytes | |
| % | 3.63 ± 1.11 |
| Absolute reticulocytes (×10 9 /L) | 156.1 ± 47.7 |
| MCVr (fL) | 125.8 ± 7.3 |
| CHCMr (g/dL) | 25.6 ± 1.2 |
| CHr (pg) | 31.3 ± 1.4 |
* Values obtained with Technicon H*2 and H*3 Hematology analyzers (Bayer Diagnostics) in neonates delivered at term with weight ≥2500 g.
| Parameter | Mean | SD | Reference Range * |
|---|---|---|---|
| Blood Count and Cellular Indices | |||
| Hb, g/L | 159 | 15 | 146-189 |
| HCT, L/L | 0.49 | 0.05 | 0.44-0.58 |
| MCV, fL | 109 | 4 | 102-118 |
| MCVr, fL | 124 | 6 | 115-136 |
| MCH, pg | 35 | 1 | 33-38 |
| MCHC, g/L | 325 | 10 | 306-342 |
| %Retic, % | 4.0 | 0.8 | 2.6-5.4 |
| IRF-H, % | 24.1 | 7.8 | 10.2-40.0 |
| CHm, pg | 34.9 | 1.3 | 32.5-37.2 |
| CHr, pg | 35.6 | 1.3 | 33.1-38.6 |
| %HYPOm, % | 3.0 | 3.0 | 0.4-9.9 |
| %HYPOr, % | 42.0 | 15.6 | 18.3-76.8 |
| Serum Measurements | |||
| TfR, mg/L | 2.0 | 0.7 | 1.2-4.0 |
| Ferritin, µg/L | 198 | 137 | 45-636 |
| TfR-F index | 0.95 | 0.43 | 0.49-2.1 |
| Iron, µmol/L | 27.4 | 7.7 | 12.2-42.1 |
| Transferrin, g/L | 2.0 | 0.4 | 1.2-2.9 |
| TfSat, % | 55 | 19 | 21-111 |
* For reference range calculations, only samples in which Hb was greater than 146 g/L were included.
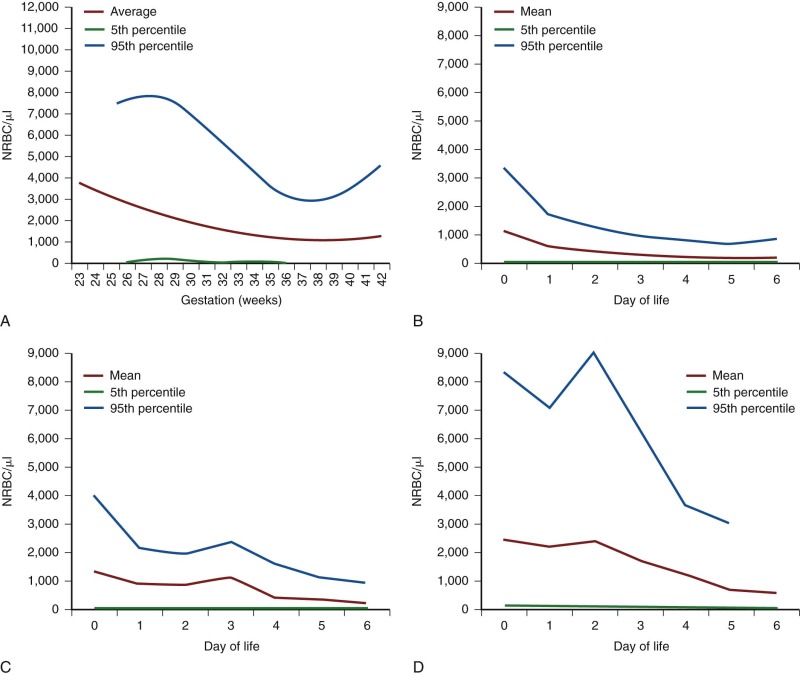
| Type of Delivery | Erythroblast Count (×10 9 /L) | Leukocyte Count (×10 9 /L) |
|---|---|---|
| Spontaneous, vaginal (N = 55) | 0.75 (0.0-5.3) | 13.8 (7.25-48.0) |
| Elective cesarean section (N = 39) | 0.30 (0.0-0.49) | 10.6 (6.2-17.7) |
| Emergency cesarean section (N = 55) | 1.10 (0.0-15.9) | 13.5 (4.2-40.3) |
* Values are expressed as mean (range). Erythroblast counts were significantly higher in the spontaneous vaginal and emergency cesarean section groups compared with the elective cesarean group.
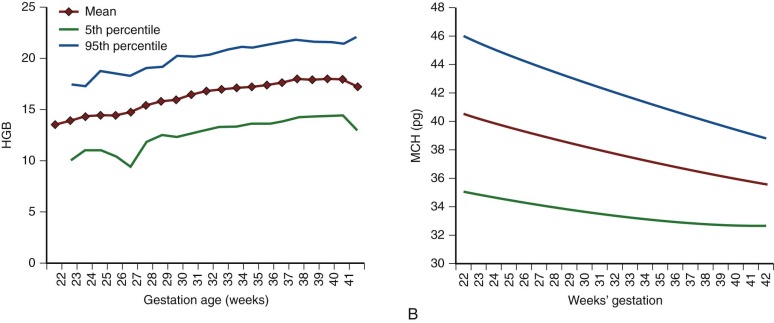
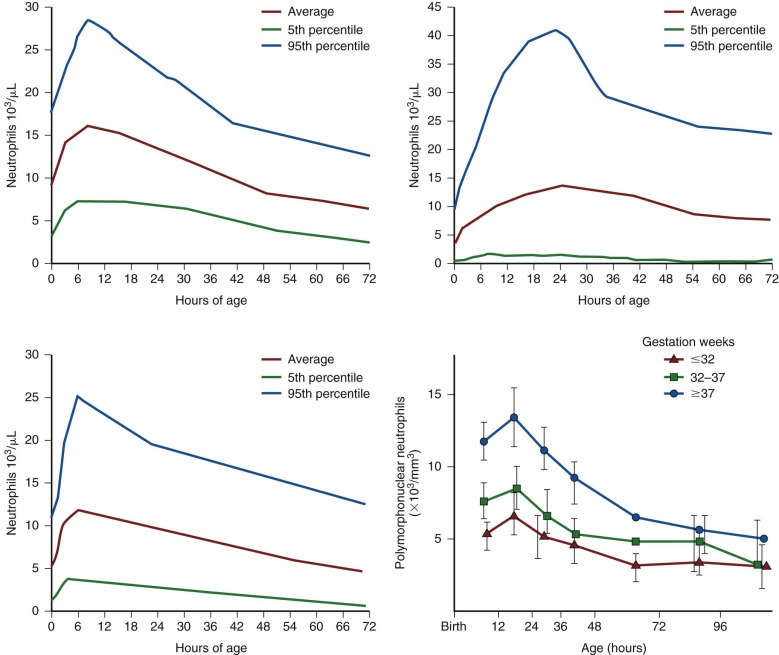
| Age, Week | Hb | Hct | Reticulocyte | CHr | IRF | S-TfR | ||||||||||||
|---|---|---|---|---|---|---|---|---|---|---|---|---|---|---|---|---|---|---|
| Reference Interval | Reference Interval | Reference Interval | Reference Interval | Reference Interval | Reference Interval | |||||||||||||
| mean | lower | upper | mean | lower | upper | mean | lower | upper | mean | lower | upper | mean | lower | upper | mean | lower | upper | |
| 0.5 | 150.5 | 101.8 | 222.4 | 0.45 | 0.30 | 0.65 | 35.7 | 31.5 | 39.9 | 36.6 | 13.5 | 59.7 | ||||||
| 1.5 | 138.7 | 97.9 | 196.3 | 0.41 | 0.29 | 0.58 | 59.5 | 20.2 | 175.6 | 35.0 | 31.1 | 38.9 | 35.5 | 13.7 | 57.2 | 1.4 | 0.9 | 2.4 |
| 2.5 | 128.8 | 94.0 | 176.5 | 0.38 | 0.28 | 0.52 | 66.8 | 24.7 | 181.1 | 34.3 | 30.6 | 38.1 | 34.3 | 13.6 | 55.1 | 1.3 | 0.8 | 2.3 |
| 3.5 | 120.6 | 90.0 | 161.5 | 0.36 | 0.27 | 0.47 | 74.1 | 29.2 | 187.9 | 33.7 | 30.1 | 37.4 | 33.3 | 13.1 | 53.4 | 1.3 | 0.8 | 2.1 |
| 4.5 | 113.8 | 86.2 | 150.3 | 0.34 | 0.26 | 0.44 | 81.2 | 33.7 | 195.8 | 33.1 | 29.5 | 36.7 | 32.2 | 12.4 | 52.1 | 1.2 | 0.7 | 2.0 |
| 5.5 | 108.3 | 82.5 | 142.1 | 0.32 | 0.25 | 0.42 | 87.9 | 37.8 | 204.3 | 32.6 | 29.0 | 36.2 | 31.3 | 11.6 | 50.9 | 1.2 | 0.7 | 1.9 |
| 7.0 | 101.9 | 77.8 | 133.7 | 0.30 | 0.23 | 0.39 | 96.7 | 43.1 | 216.7 | 31.9 | 28.3 | 35.5 | 29.9 | 10.3 | 49.6 | 1.1 | 0.7 | 1.8 |
| 9.0 | 96.9 | 73.5 | 127.7 | 0.29 | 0.22 | 0.38 | 105.2 | 48.4 | 228.8 | 31.2 | 27.5 | 34.8 | 28.4 | 8.6 | 48.1 | 1.1 | 0.7 | 1.8 |
| 11.0 | 94.9 | 71.7 | 125.7 | 0.28 | 0.21 | 0.37 | 109.0 | 51.3 | 231.9 | 30.6 | 26.9 | 34.3 | 27.0 | 7.4 | 46.7 | 1.1 | 0.7 | 1.9 |
| 13.0 | 96.1 | 72.6 | 127.3 | 0.28 | 0.21 | 0.37 | 107.6 | 51.4 | 225.2 | 30.2 | 26.5 | 33.9 | 25.9 | 6.7 | 45.0 | 1.2 | 0.7 | 2.0 |
| 15.0 | 100.5 | 75.9 | 133.1 | 0.30 | 0.22 | 0.39 | 101.2 | 48.1 | 212.9 | 30.0 | 26.4 | 33.6 | 24.9 | 6.7 | 43.3 | 1.3 | 0.8 | 2.2 |
| Age, Week | Ferritin * | Ferritin, No Transfusions * | ||||
|---|---|---|---|---|---|---|
| Reference Interval | Reference Interval | |||||
| mean | lower | upper | mean | lower | upper | |
| 1.5 | 221.4 | 77.0 | 636.8 | 215.5 | 73.5 | 631.6 |
| 2.5 | 199.9 | 65.6 | 609.2 | 178.5 | 56.9 | 559.8 |
| 3.5 | 180.4 | 52.8 | 616.5 | 149.2 | 43.9 | 507.2 |
| 4.5 | 162.8 | 41.4 | 640.2 | 125.9 | 34.1 | 465.4 |
| 5.5 | 147.0 | 32.3 | 668.4 | 107.2 | 26.8 | 429.7 |
| 7.0 | 126.0 | 22.6 | 702.3 | 85.7 | 19.2 | 382.1 |
| 9.0 | 102.6 | 14.9 | 708.7 | 65.7 | 13.3 | 324.6 |
| 11.0 | 83.5 | 10.6 | 659.1 | 52.3 | 10.1 | 271.7 |
| 13.0 | 68.0 | 8.2 | 563.0 | 43.2 | 8.3 | 224.0 |
| 15.0 | 55.3 | 6.9 | 444.8 | 37.0 | 7.5 | 182.9 |
* The information under the column “Ferritin” shows values calculated for the neonates who had not been transfused during the preceding 2 weeks of measurements. The information under the column “Ferritin, no transfusions” shows the values calculated for those neonates who had not been transfused at all (indicating ferritin level development in the most stable preterm neonates).
| Age, Weeks | Hb, g/L | Hct | RBC count, × 10 12 /L | MCV, fL | MCH, pg | Retic, × 10 9 /L | ||||||
|---|---|---|---|---|---|---|---|---|---|---|---|---|
| Mean | 95% RI | Mean | 95% RI | Mean | 95% RI | Mean | 95% RI | Mean | 95% RI | Mean | 95% RI | |
| Preterm | ||||||||||||
| 20 | 112.2 | 92.0-136.8 | 0.327 | 0.271-0.395 | 4.03 | 3.15-4.92 | 81.6 | 73.2-90.0 | 28.1 | 25.2-31.0 | 77.4 | 39.0-153.5 |
| 25 | 116.8 | 98.7-138.1 | 0.340 | 0.287-0.401 | 4.27 | 3.48-5.07 | 80.1 | 72.3-88.0 | 27.7 | 24.8-30.5 | 69.7 | 36.7-132.5 |
| 30 | 120.8 | 103.6-140.9 | 0.351 | 0.300-0.411 | 4.47 | 3.70-5.25 | 79.0 | 71.2-86.7 | 27.3 | 24.4-30.3 | 64.1 | 34.3-119.6 |
| 35 | 124.3 | 106.7-144.7 | 0.360 | 0.309-0.421 | 4.64 | 3.83-5.44 | 78.1 | 70.1-86.0 | 27.1 | 24.0-30.2 | 60.1 | 32.4-111.8 |
| 40 | 127.0 | 108.5-148.6 | 0.368 | 0.315-0.431 | 4.76 | 3.92-5.60 | 77.5 | 69.3-85.7 | 26.9 | 23.7-30.1 | 57.6 | 30.9-107.2 |
| 45 | 129.0 | 109.6-151.8 | 0.374 | 0.319-0.438 | 4.85 | 3.98-5.71 | 77.3 | 68.9-85.6 | 26.8 | 23.5-30.0 | 56.3 | 30.1-105.1 |
| 50 | 130.2 | 110.3-153.6 | 0.378 | 0.323-0.442 | 4.89 | 4.03-5.75 | 77.3 | 69.0-85.6 | 26.7 | 23.6-29.9 | 56.1 | 30.0-105.2 |
| 55 | 130.6 | 111.1-153.6 | 0.380 | 0.326-0.442 | 4.90 | 4.07-5.73 | 77.6 | 69.6-85.7 | 26.8 | 23.7-29.8 | 57.2 | 30.3-107.7 |
| 60 | 130.2 | 112.0-151.3 | 0.379 | 0.329-0.437 | 4.87 | 4.11-5.62 | 78.2 | 70.7-85.8 | 26.9 | 24.0-29.7 | 59.4 | 31.1-113.5 |
| Full-Term | ||||||||||||
| 20 | 120.0 | 102.2-140.9 | 0.345 | 0.293-0.407 | 4.32 | 3.76-4.87 | 80.3 | 74.2-86.4 | 27.9 | 25.6-30.2 | 45.5 | 25.3-82.2 |
| 25 | 118.9 | 101.9-138.8 | 0.345 | 0.296-0.402 | 4.38 | 3.84-4.92 | 79.0 | 73.1-84.9 | 27.3 | 24.9-29.6 | 45.2 | 25.1-81.5 |
| 30 | 118.3 | 101.5-137.7 | 0.345 | 0.298-0.400 | 4.44 | 3.90-4.98 | 78.1 | 72.3-83.9 | 26.8 | 24.3-29.2 | 45.4 | 26.1-78.9 |
| 35 | 118.0 | 101.5-137.3 | 0.346 | 0.300-0.400 | 4.48 | 3.93-5.03 | 77.6 | 71.8-83.4 | 26.5 | 23.9-29.0 | 46.0 | 27.6-76.6 |
| 40 | 118.2 | 102.0-137.1 | 0.348 | 0.303-0.400 | 4.51 | 3.96-5.06 | 77.4 | 71.6-83.2 | 26.3 | 23.7-28.9 | 47.1 | 28.8-76.8 |
| 45 | 118.9 | 102.9-137.3 | 0.351 | 0.307-0.401 | 4.54 | 3.99-5.08 | 77.6 | 71.7-83.5 | 26.3 | 23.6-29.0 | 48.7 | 28.7-82.5 |
| 50 | 120.0 | 104.2-138.1 | 0.354 | 0.313-0.402 | 4.55 | 4.01-5.08 | 78.2 | 72.2-84.1 | 26.5 | 23.8-29.2 | 50.9 | 26.9-96.3 |
| 55 | 121.5 | 105.4-140.0 | 0.359 | 0.319-0.403 | 4.55 | 4.04-5.06 | 79.1 | 73.1-85.1 | 26.9 | 24.2-29.6 | 53.7 | 23.9-121.0 |
| Age, Weeks | Ferritin, µg/L | S-TfR, mg/L | CHr, pg | WBC count, × 10 9 /L | Platelet count, × 10 9 /L | |||||||
| Mean | 95% RI | Mean | 95% RI | Mean | 95% RI | Mean | 95% RI | Mean | 95% RI | |||
| Preterm | ||||||||||||
| 20 | 37.8 | 7.37-193.9 | 1.52 | 1.07-2.16 | 29.8 | 26.6-33.1 | 9.48 | 5.63-16.0 | 478 | 294-777 | ||
| 25 | 30.1 | 7.48-120.8 | 1.54 | 1.10-2.15 | 29.6 | 26.4-32.8 | 9.60 | 5.73-16.1 | 465 | 290-744 | ||
| 30 | 24.7 | 7.06-86.6 | 1.56 | 1.12-2.16 | 29.4 | 26.2-32.7 | 9.71 | 5.82-16.2 | 452 | 286-714 | ||
| 35 | 21.1 | 6.41-69.5 | 1.57 | 1.14-2.17 | 29.3 | 26.0-32.6 | 9.83 | 5.92-16.3 | 439 | 280-687 | ||
| 40 | 18.6 | 5.80-59.9 | 1.59 | 1.16-2.19 | 29.2 | 25.9-32.6 | 9.94 | 6.01-16.5 | 427 | 274-663 | ||
| 45 | 17.1 | 5.41-53.8 | 1.61 | 1.17-2.21 | 29.2 | 25.8-32.6 | 10.1 | 6.09-16.6 | 415 | 268-642 | ||
| 50 | 16.2 | 5.25-49.8 | 1.63 | 1.18-2.25 | 29.3 | 25.8-32.7 | 10.2 | 6.17-16.8 | 403 | 260-623 | ||
| 55 | 15.9 | 5.31-47.5 | 1.65 | 1.18-2.30 | 29.4 | 25.8-32.9 | 10.3 | 6.24-17.0 | 391 | 252-607 | ||
| 60 | 16.2 | 5.44-47.9 | 1.67 | 1.18-2.36 | 29.5 | 25.9-33.2 | 10.4 | 6.31-17.2 | 380 | 244-593 | ||
| Full-Term | ||||||||||||
| 20 | 71.7 | 21.5-239.7 | 1.49 | 1.06-2.08 | 29.8 | 27.4-32.1 | 9.36 | 5.84-15.0 | 426 | 282-646 | ||
| 25 | 51.1 | 16.1-162.2 | 1.52 | 1.08-2.12 | 29.2 | 25.7-32.6 | 9.19 | 5.73-14.7 | 415 | 269-640 | ||
| 30 | 38.5 | 11.5-128.7 | 1.54 | 1.09-2.19 | 28.8 | 24.7-32.9 | 9.02 | 5.57-14.6 | 404 | 258-634 | ||
| 35 | 30.6 | 8.76-107.0 | 1.57 | 1.09-2.27 | 28.7 | 24.5-32.9 | 8.85 | 5.37-14.6 | 394 | 247-628 | ||
| 40 | 25.8 | 7.46-89.1 | 1.60 | 1.08-2.37 | 28.9 | 25.1-32.6 | 8.68 | 5.14-14.7 | 383 | 237-621 | ||
| 45 | 22.9 | 7.01-75.0 | 1.63 | 1.07-2.48 | 29.2 | 26.4-32.1 | 8.52 | 4.88-14.9 | 373 | 227-614 | ||
| 50 | 21.6 | 6.78-68.6 | 1.66 | 1.05-2.62 | 29.9 | 27.6-32.2 | 8.36 | 4.61-15.2 | 363 | 218-607 | ||
| 55 | 21.5 | 5.90-78.0 | 1.69 | 1.04-2.76 | 30.8 | 27.0-34.5 | 8.21 | 4.33-15.5 | 354 | 209-599 | ||
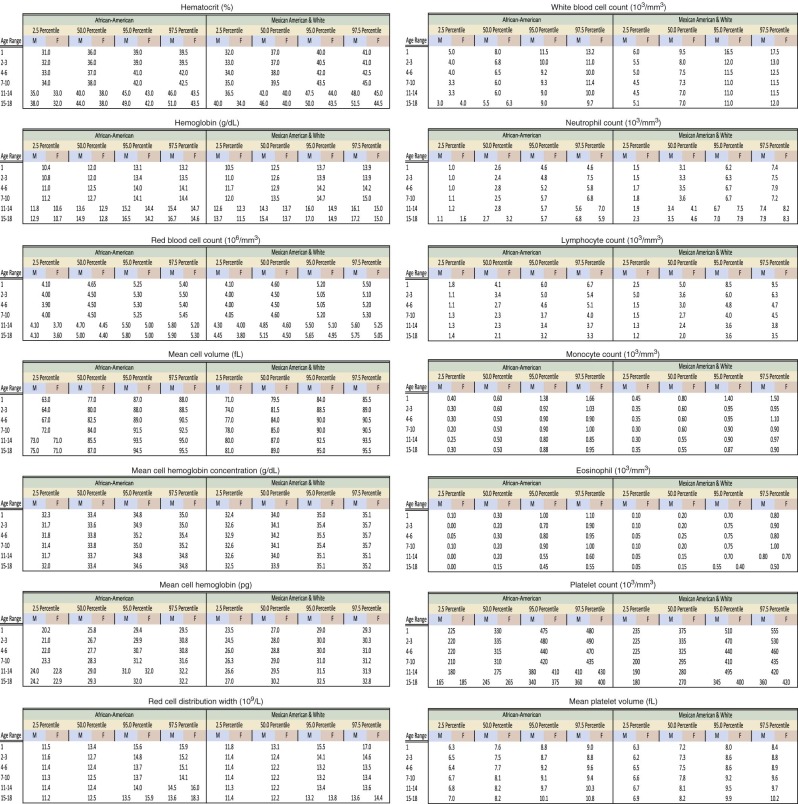
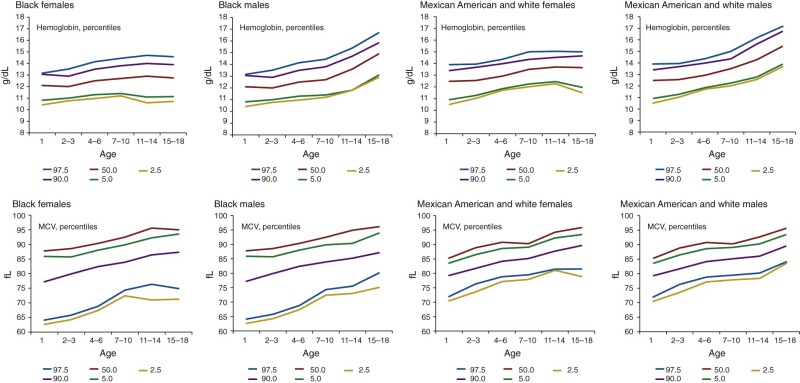
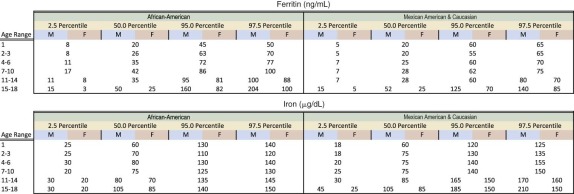
| African-American [Hb (g/dL)] | African-American [Hct (%)] | African-American [MCV (fl)] | |||||
|---|---|---|---|---|---|---|---|
| Age (years) | African American (mean WBC) | Mean | −2 STD | Mean | −2 STD | Mean | −2 STD |
| 2-5 | 7.33 | 11.94 | 10.37 | 35.98 | 31.54 | 79.81 | 74.65 |
| 6-10 | 6.74 | 12.44 | 10.3 | 37.27 | 32.71 | 81.44 | 76.45 |
| 11-15 male | 6.32 | 13.2 | 10.97 | 39.29 | 32.91 | 83.20 | 77.99 |
| 11-15 female | 6.58 | 12.67 | 10.1 | 37.95 | 33.41 | 83.60 | 78.01 |
| 16-18 male | 5.91 | 14.35 | 11.30 | 43.50 | 37.62 | 86.02 | 80.85 |
| 16-18 female | 6.92 | 12.55 | 10.27 | 37.39 | 31.87 | 85.26 | 79.43 |
* Sample size is 5039. Mean values obtained from NHANES (National Health and Nutrition Examination Survey) and Robins studies.
| 12-18 Years: WBC | >18 Years: WBC | 12-18 Years: ANC | >18 Years: ANC | |||||
|---|---|---|---|---|---|---|---|---|
| N | N | N | N | |||||
| NHBM | 401 | 3.2-9.3 (5.6) | 547 | 3.1-9.9 (6.1) | 401 | 1.0-6.2 (2.9) | 547 | 1.3-6.6 (3.1) |
| MAM | 493 | 4.1-11.4 (6.9) | 776 | 4.1-11.4 (7.1) | 492 | 1.8-8.2 (4.1) | 776 | 2.1-7.9 (4.2) |
| NHWM | 342 | 4.1-11.4 (6.8) | 1473 | 4.1-11.8 (7.0) | 342 | 1.8-7.2 (3.8) | 1471 | 2.1-8.0 (4.3) |
| MAM, NHWM | 835 | 4.1-11.4 (6.8) | 2249 | 4.1-11.6 (7.1) | 834 | † | 2247 | 2.1-8.0 (4.3) |
| NHBF | 329 | 3.7-10.1 (6.2) | 344 | 3.4-11 (6.3) | 329 | 1.2-6.6 (3.1) | 344 | 1.4-7.5 (3.4) |
| MAF | 401 | 4.1-12.0 (7.6) | 552 | 4.5-11.8 (7.5) | 401 | 1.9-8.4 (5.3) | 550 | 2.2-8.0 (4.9) |
| NHWF | 322 | 4.1-11.3 (7.2) | 1222 | 3.9-11.6 (7.0) | 322 | 1.9-7.7 (4.0) | 1221 | 2.0-7.9 (4.7) |
| MAF, NHWF | 723 | † | 1774 | † | 723 | † | 1771 | 2.0-7.9 (4.8) |
* Data are presented as reference intervals (2.5-97.5 percentile limits) and mean values (in parentheses).
† Could not be pooled because of variation within and between populations.
| Enzyme | Activity at 37° C (mean ± SD) |
|---|---|
| Acetylcholinesterase | 36.93 ± 3.83 |
| Adenosine deaminase | 1.11 ± 0.23 |
| Adenylate kinase | 258 ± 29.3 |
| Aldolase | 3.19 ± 0.86 |
| Bisphosphoglyceromutase (2,3- diphosphoglyceromutase) | 4.78 ± 0.65 |
| Catalase | 15.3 ± 2.4 × 10 4 |
| Enolase | 5.39 ± 0.83 |
| Epimerase | 0.23 ± 0.06 |
| Galactokinase | 0.029 ± 0.004 |
| Galactose-1-phosphate uridyltransferase | 28.4 ± 6.94 |
| Glucose phosphate isomerase | 60.8 ± 11.0 |
| Glucose-6-phosphate dehydrogenase | 8.34 ± 1.59 |
| WHO method | 12.1 ± 2.09 |
| Glutamic oxaloacetic transaminase without PLP | 3.02 ± 0.67 |
| Glutamic oxaloacetic transaminase with PLP | 5.04 ± 0.90 |
| γ-Glutamylcysteine synthetase | 0.43 ± 0.04 |
| Glutathione peroxidase | 30.82 ± 4.65 |
| Glutathione reductase without FAD | 7.18 ± 1.09 |
| Glutathione reductase with FAD | 10.4 ± 1.50 |
| Glutathione S-transferase | 6.66 ± 1.81 |
| Glyceraldehyde phosphate dehydrogenase | 226 ± 41.9 |
| Hexokinase | 1.78 ± 0.38 |
| Hypoxanthine phosphoribosyltransferase | 1.72 ± 0.30 |
| Lactate dehydrogenase | 200 ± 26.5 |
| Methemoglobin reductase | 2.60 ± 0.71 |
| Monophosphogylceromutase | 37.71 ± 5.56 |
| NADH-methemoglobin reductase | 19.2 ± 3.85 (30°) |
| NADPH diaphorase | 2.26 ± 0.16 |
| Phosphofructokinase | 11.01 ± 2.33 |
| Phosphoglucomutase | 5.50 ± 0.62 |
| Phosphoglycerate kinase | 320 ± 36.1 |
| Phosphoglycolate phosphatase | 1.23 ± 0.10 |
| Pyrimidine 5′ nucleotidase | 0.11 ± 0.03 |
| Pyruvate kinase | 15.0 ± 1.99 |
| 6-Phosphogluconate dehydrogenase | 8.78 ± 0.78 |
| Triose phosphate isomerase | 2111 ± 397 |
| Metabolite | CONCENTRATION (mean ± 1 SD) | |||
|---|---|---|---|---|
| Abbreviation | nmol/g Hb | nmol/mL Red Cells | µmol/L in Whole Blood | |
| Adenosine-5′-diphosphate | ADP | 6635 ± 105 | 216 ± 36 | — |
| Adenosine-5-monophosphate | AMP | 62 ± 10 | 21.1 ± 3.4 | — |
| Adenosine-5-triphosphate | ATP | 4230 ± 290 (whites) 3530 ± 301 (blacks) | 1438 ± 99 1200 ± 102 | — |
| 2,3-Diphosphoglycerate | 2,3-DPG | 1227 ± 1870 | 4171 ± 636 | — |
| Glutathione | GSH | 6570 ± 1040 | 2234 ± 354 | — |
| Glutathione (oxidized) | GSSG | 12.3 ± 4.5 | 4.2 ± 1.53 | — |
| Glucose-6-phosphate | G6P | 82 ± 22 | 27.8 ± 7.5 | — |
| Fructose-6-phosphate | F6P | 27 ± 5.8 | 9.3 ± 2.0 | — |
| Fructose-6-diphosphate | FDP | 5.6 ± 1.8 | 1.9 ± 0.6 | — |
| Dihydroxyacetone phosphate | DHAP | 27.6 ± 8.2 | 9.4 ± 2.8 | — |
| 3-Phosphoglyceric acid | 3-PGA | 132 ± 15.0 | 44.9 ± 5.1 | — |
| 2-Phosphoglyceric acid | 2-PGA | 21.5 ± 7.35 | 7.3 ± 2.5 | — |
| Phosphoenolpyruvate | PEP | 35.9 ± 6.47 | 12.2 ± 2.2 | — |
| Creatine | 1310 ± 310 (male) 1500 ± 250 (female) | 445 ± 105 510 ± 85 | — | |
| Lactate | — | — | 932 ± 211 | |
| Pyruvate | — | — | 53.3 ± 21.5 | |
| Premature Infants (N = 11) | Term Infants (N = 10) | Normal Adults (N = 50) | 95% Adult * Reticulocytes | |
|---|---|---|---|---|
| Hexokinase (HK) | 3.6 ± 0.6 a | 2.7 ± 0.3 a | 1.15 ± 0.35 | 9.9 a |
| Glucosephosphate isomerase (PGI) | 94.5 ± 15.2 a | 88 ± 16 a | 67.7 ± 12.0 | 95.7 c |
| Phosphofructokinase (PFK) | 8.0 ± 1.3 d | 7.1 ± 1.5 c | 8.4 ± 3.4 | 14.1 d |
| Aldolase (ALD) | 4.3 ± 0.8 c | 5.3 ± 1.7 b | 3.55 ± 1.07 | 9.5 a |
| Triosephosphate isomerase (TIM) | 2961 ± 1378 d | 1787 ± 380 d | 2700 ± 700 | 3220 d |
| Glyceraldehyde-3-phosphate dehydrogenase (GAPDH) | 131 ± 76 d | 164 ± 45 d | 134 ± 93 | 240 d |
| Phosphoglycerate mutase (PGK) | 591 ± 114 b | 436 ± 119 b | 312 ± 86 | 438 d |
| Diphosphoglycerate mutase (DPGM) | 8.3 ± 3.6 c | 6.7 ± 1.9 c | 5.3 ± 2.5 | 7.3 d |
| Enolase (ENO) | 15.1 ± 3.4 a | 14.6 ± 2.1 a | 7.8 ± 2.2 | 8.1 d |
| Pyruvate kinase (PK) | 19.4 ± 3.5 a | 17.3 ± 2.5 a | 11.4 ± 2.8 | 54.2 a |
| Glucose-6-phosphate dehydrogenase (G6PD) | 21.3 ± 3.8 a | 19.1 ± 4.3 a | 10.9 ± 3.8 | 30.6 a |
| 6-Phosphogluconate dehydrogenase (6PGD) | 9.1 ± 2.1 d | 9.9 ± 1.6 c | 8.4 ± 1.0 | 14.4 a |
| Glutathion reductase (GR) | 9.5 ± 1.7 a | 11.0 ± 2.6 a | 7.2 ± 2.2 | 11.3 c |
| Acetyl choline esterase (ACE) | 17.5 ± 3.5 a | 18.5 ± 4.1 a | 36.9 ± 3.8 | 44.4 c |
* Obtained after Percoll density gradient centrifugation of red cells from a patient with a hemolytic syndrome. Statistical interpretation versus normal adult group: P <.001; P <.01; P <.1; not significant.
| Metabolite | Normal Adults (10) | Term Infants (10) | Premature Infants (11) | Normals (5) |
|---|---|---|---|---|
| Glucose-6-phosphate | 24.8 ± 9.8 | 45.2 ± 8.7 | 66.8 ± 34.8 | 27 ± 2.4 |
| Fructose-6-phosphate | 5.4 ± 1.0 | 9.9 ± 2.3 | 20.5 ± 8.9 | 11 ± 2.5 |
| Fructose, 1,6-diphosphate | 4.6 ± 1.0 | 3.8 ± 0.7 | 3.6 ± 0.8 | 5 ± 0.9 |
| Dihydroxyacetone phosphate | 4.9 ± 3.5 | 11.9 ± 5.0 | 18.6 ± 10.7 | 12 ± 3.7 |
| Glyceraldehyde-3-phosphate | 2.6 ± 0.7 | 1.9 ±1.6 | 6.5 ± 3.2 | 4 ± 1.5 |
| 3-Phosphoglycerate | 61.6 ± 12.4 | 58.2 ± 14.4 | 47.5 ± 14.2 | 48 ± 16.1 |
| 2-Phosphoglycerate | 4.3 ± 1.8 | 4.9 ± 1.6 | 4.4 ± 2.5 | 7 ± 1.7 |
| Phosphoenolpyruvate | 8.8 ± 2.6 | 7.6 ± 2.9 | 7.4 ± 3.0 | 12 ± 0.9 |
| Pyruvate | 73.5 ± 33.1 | 70.4 ± 32.3 | 78.4 ± 4.15 | 71 ± 17.7 |
| 2,3-Diphosphoglycerate | 4423 ± 1907 | 3609 ± 800 | 3152 ± 2133 | 4000 |
* Infant samples were obtained from newborns weighing more than 2800 g whose gestational age was 39 weeks or greater. Blood was drawn within 24 hours of birth. All the newborns were clinically healthy. Adult samples were obtained from healthy normal volunteers.
| Normal Adult (N = 28) Mean ± SD | ELBWI (N = 28) Mean ± SD | Reticulocyte Rich (N = 20) Mean ± SD | ELBWI Versus Reticulocyte Rich | ELBWI Versus Normal Adults | |
|---|---|---|---|---|---|
| Hexokinase (HK) | 1.05 ± 0.11 | 3.28 ± 0.47 | 3.45 ± 1.78 | NS | High ( P <.0001) |
| Glucosephosphate isomerase (GPI) | 58.4 ± 5.0 | 83.4 ± 6.2 | 65.2 ± 8.5 | High ( P <.0001) | High ( P <.0001) |
| Phosphofructokinase (PFK) | 13.3 ± 1.7 | 10.1 ± 1.6 | 15.8 ± 2.4 | Low ( P <.0001) | Low ( P <.0001) |
| Aldolase (ALD) | 3.09 ± 0.53 | 4.73 ± 5.13 | 5.12 ± 0.94 | NS | High ( P <.0001) |
| Triosephosphate isomerase (TPI) | 1760 ± 253 | 2215 ± 339 | 2077 ± 375 | NS | High ( P <.0001) |
| Glyceraldehyde-3-phosphate dehydrogenase (GA3PD) | 191 ± 34 | 252 ± 39 | 232 ± 51 | NS | High ( P <.0001) |
| Phosphoglycerate kinase (PGK) | 288 ± 31 | 469 ± 67 | 355 ± 43 | High ( P <.0001) | High ( P <.0001) |
| Monophosphoglycerate mutase (MPGM) | 23.5 ± 2.8 | 33.8 ± 6.9 | 29.9 ± 5.3 | High ( P = .0412) | High ( P <.0001) |
| Enolase (ENL) | 6.9 ± 1.0 | 23.9 ± 3.0 | 9.3 ± 1.7 | High ( P <.0001) | High ( P <.0001) |
| Pyruvate kinase (PK) | 16.3 ± 2.1 | 29.7 ± 4.0 | 27.6 ± 8.1 | NS | High ( P <.0001) |
| Lactate dehydrogenase (LDH) | 195 ± 17 | 248 ± 28 | 264 ± 34 | NS | High ( P <.0001) |
| Glucose-6-phosphate dehydrogenase (G6PD) | 7.6 ± 0.8 | 18.1 ± 2.2 | 12.8 ± 2.0 | High ( P <.0001) | High ( P <.0001) |
| 6-Phosphogluconate dehydrogenase (6PGD) | 8.1 ± 1.0 | 8.2 ± 1.5 | 13.2 ± 1.8 | Low ( P <.0001) | NS |
| Glutathione reductase (GR) | 7.1 ± 1.2 | 9.2 ± 1.8 | 7.8 ± 1.8 | High ( P = .0090) | High ( P <.0001) |
| GR + flavin adenine dinucleotide (FAD) | 9.9 ± 1.6 b | 10.9 ± 1.7 b | 10.4 ± 1.7 | NS | NS |
| Glutathione peroxidase (GSH-Px) | 31.8 ± 5.7 | 22.5 ± 4.0 | 41.3 ± 7.4 | Low ( P <.0001) | Low ( P <.0001) |
| Adenylate kinase (AK) | 252 ± 35 | 132 ± 18 | 253 ± 26 | Low ( P <.0001) | Low ( P <.0001) |
| Adenosine deaminase (ADA) | 1.25 ± 0.33 | 0.96 ± 0.30 | 1.60 ± 0.60 | Low ( P <.0001) | Low ( P = .0010) |
| Acetylcholinesterase (AchE) | 31.7 ± 4.7 | 16.7 ± 3.3 | 37.6 ± 10.1 | Low ( P <.0001) | Low ( P <.0001) |
| Pyrimidine 5′-nucleotidase | 9.1 ± 1.4 | 17.0 ± 4.0 | 19.1 ± 4.5 | ns | High ( P <.0001) |
| NADH methemoglobin reductase (MetHbR) | 14.9 ± 1.8 b | 11.5 ± 2.1 a | 14.1 ± 2.3 a | Low ( P = .0087) | Low ( P <.0001) |
| Catalase (CAT) | 13.6 ± 2.1 b | 11.8 ± 2.7 a | 15.6 ± 3.2 a | Low ( P = .0048) | Low ( P = .0459) |
| Reduced glutathione (GSH) (mg/dL RBC) | 67.8 ± 9.3 | 76.9 ± 13.8 | 69.4 ± 12.0 | NS | High ( P = .0059) |
* All enzyme activities are represented as units/g Hb, except for CAT (10 4 units/g Hb) and P5N (µmol Pi liberated/hr/g Hb). N = 12; N = 20.
| Category (U/g Hb) | No. | Median Value | IQR | Min-Max | G6PD Phenotype | Probable Genotype * † |
|---|---|---|---|---|---|---|
| Male (N = 1502) | ||||||
| <7.0 | 243 (16.2%) | 0.28 | 0.21-0.39 | 0.01-6.20 | Deficient | Deficient hemizygote |
| ≥9.0 | 1256 (83.8%) | 18.76 | 17.27-21.68 | 9.00-34.66 | Normal | Normal hemizygote |
| Female (N = 1298) | ||||||
| <7.0 | 81 (6.2%) | 4.84 | 0.45-6.16 | 0.06-6.96 | Deficient | Deficient homozygote |
| 7.0-9.4 | 64 (4.9%) | 8.61 | 7.67-9.00 | 7.04-9.46 | Intermediate | Heterozygote |
| ≥9.5 | 1153 (88.8%) | 18.36 | 16.21-20.63 | 9.54-35.50 | Normal | Normal homozygote |
* In females, because of nonrandom X chromosome inactivation among heterozygotes, accurate genotype categories may be difficult to determine based on phenotype. The term “probable” genotype is therefore used.
† Male genotype based on phenotype may be assumed with reasonable accuracy.
| Birth Weight (g) | Males Hb A (%) | Females Hb A (%) |
|---|---|---|
| <1501 | 7.1 ± 1.3 (9) | 13.2 ± 11.3 (14) |
| 1501-2000 | 12.2 ± 8.2 (36) | 13.1 ± 10.4 (44) |
| 2001-2500 | 12.6 ± 5.2 (139) | 14.9 ± 6.5 (206) * |
| 2501-3000 | 15.8 ± 6.4 (635) | 17.8 ± 6.2 (776) * |
| 3001-3500 | 18.2 ± 6.5 (1289) | 19.9 ± 6.8 (1204) * |
| 3501-4000 | 20.0 ± 6.6 (803) | 20.9 ± 7.2 (590) * |
| 4001-4500 | 19.7 ± 6.3 (200) | 22.6 ± 8.6 (94) * |
| >4500 | 21.7 ± 7.0 (45) | 20.9 ± 7.2 (20) |
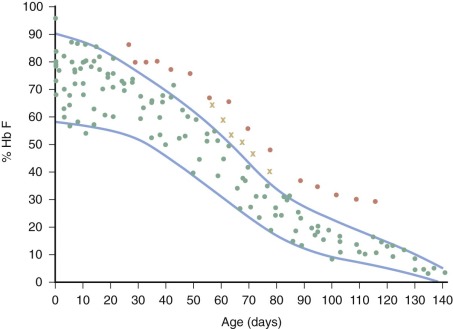
| % Hb F (Gα : Aα ratio) | % Hb A2 | |
|---|---|---|
| Newborn | 60-90 (3 : 1) | <1.0 |
| Adult | <1.0 (2 : 3) | 1.6-3.5 |
* The α chains of fetal hemoglobin contain either a glycyl residue or an alanyl residue at position 136. The Gα : Aα ratio in the newborn undergoes a considerable change between the third and fourth months of life, at which time it approximates that of the Hb F of adults.
| METHEMOGLOBIN (g/dL) | METHEMOGLOBIN AS PERCENTAGE OF TOTAL HEMOGLOBIN | |||||||||
|---|---|---|---|---|---|---|---|---|---|---|
| No. Cases | No. Det. | Mean | Range | Standard Dev. | No. Cases | No. Det. | Mean | Range | Standard Dev. | |
| Prematures (birth-7 days) | 29 | 34 | 0.43 | (0.02-0.83) | ±0.07 | 24 | 28 | 2.3 | (0.08-4.4) | ±1.26 |
| Prematures (7-72 days) | 21 | 29 | 0.31 | (0.02-0.78) | ±0.19 | 18 | 23 | 2.2 | (0.02-4.7) | ±1.07 |
| Prematures (total) | 50 | 63 | 0.38 | (0.02-0.83) | ±0.10 | 42 | 51 | 2.2 | (0.08-4.7) | ±1.10 |
| Cook County Hospital, prematures (1-14 days) | 8 | 8 | 0.52 | (0.18-0.83) | ±0.08 | — | — | — | — | — |
| Newborns (1-10 days) | 39 | 39 | 0.22 | (0.00-0.58) | ±0.17 | 25 | 30 | 1.5 | (0.00-2.8) | ±0.81 |
| Infants (1 month-1 year) | 8 | 8 | 0.14 | (0.02-0.29) | ±0.09 | 8 | 8 | 1.2 | (0.17-2.4) | ±0.78 |
| Children (1-14 years) | 35 | 35 | 0.11 | (0.00-0.33) | ±0.09 | 35 | 35 | 0.79 | (0.00-2.4) | ±0.62 |
| Adults (14-78 years) | 30 | 30 | 0.11 | (0.00-0.28) | ±0.09 | 27 | 27 | 0.82 | (0.00-1.9) | ±0.63 |
* The premature and full-term infants were free of known disease. None had respiratory distress or cyanosis. Analysis of milk and water ingested by these infants revealed a nitrate level less than 0.027 ppm. The premature infants routinely received vitamin C orally each day from the seventh day of life.
| PERCENTILE | ||||||
|---|---|---|---|---|---|---|
| Mean ± SD | 10th | 25th | 50th | 75th | 90th | |
| Boys | ||||||
| Hb (g/dL) | 14.7 ± 0.831 | 135 | 14.2 | 14.7 | 15.2 | 15.7 |
| Transferrin saturation (%) | 32.7 ± 10.25 | 21.2 | 25.7 | 31.7 | 38.6 | 46.3 |
| Serum ferritin (µg/L) | 26.4 ± 17.71 | 13.2 | 22 | 29 | 40.8 | 52 |
| MCV (fL) | 88.4 ± 3.87 | 83.5 | 85.5 | 88.1 | 90.9 | 93.2 |
| RDW (%) | 13.0 ± 0.95 | 12.3 | 12.5 | 12.9 | 13.2 | 13.5 |
| MCH (pg) | 29.4 ± 1.43 | 27.7 | 28.6 | 29.2 | 30.2 | 31.0 |
| Girls | ||||||
| Hb (g/dL) | 13.4 ± 0.763 | 12.3 | 12.9 | 13.4 | 13.9 | 14.3 |
| Transferrin saturation (%) | 29.9 ± 10. 7 | 17.2 | 22.8 | 29 | 35.2 | 43.4 |
| Serum ferritin (µg/L) | 18.2 ± 1.98 | 7.5 | 12 | 18.2 | 28.5 | 41.5 |
| MCV (fL) | 90.1 ± 3.86 | 84.8 | 87.6 | 90.3 | 92.8 | 94.8 |
| RDW (%) | 12.8 ± 0.71 | 12.1 | 12.4 | 12.7 | 13.2 | 13.6 |
| MCH (pg) | 29.6 ± 1.43 | 27.8 | 28.8 | 29.5 | 30.6 | 31.3 |
* Data for serum ferritin are presented as geometric means ± antilog of logarithmic values.
† Data collected in 197 to 207 boys and 215 to 220 girls, from ages 15 to 16.
| 2 m | 6 m | 9 m | |||||||
|---|---|---|---|---|---|---|---|---|---|
| Mean ± SD | 5-95 Percentiles | N | Mean ± SD | 5-95 Percentiles | N | Mean ± SD | 5-95 Percentiles | N | |
| Hemoglobin | |||||||||
| (g/L) | 115 ± 8 | 101-130 | 68 | 116 ± 9 | 105-130 | 57 | 117 ± 7 | 103-129 | 94 |
| (mmol/L) | 7.1 ± 0.5 | 6.3-8.1 | 7.2 ± 0.6 | 6.5-8.1 | 7.3 ± 0.5 | 6.4-8 | |||
| Serum ferritin * (µg/L) | 301 | 134-675 | 63 | 59 | 23-140 | 54 | 37 | 17-78 | 84 |
| Erythrocyte protoporphyrin (nmol/l erythrocytes) | 679 ± 185 † | 479-1148 | 65 | 475 ± 109 | 304-659 | 48 | 556 ± 133 † | 369-763 | 83 |
| Serum transferrin (µmol/L) | 26 ± 4 † | 20-33 | 65 | 31 ± 4 | 24-38 | 57 | 35 ± 7 † | 26-47 | 90 |
| Serum iron (µmol/L) | 13.1 ± 3.5 † | 7.5-19.1 | 59 | 9.9 ± 3.1 | 6.3-17.3 | 46 | 8.8 ± 3.4 | 3.9-14.9 | 80 |
| Transferrin saturation (%) | 26 ± 8 † | 15-40 | 59 | 16 ± 6 | 10-29 | 46 | 13 ± 6 | 5-25 | 77 |
| Mean red cell volume (fl) | 86 ± 5 † | 78-94 | 64 | 76 ± 4 | 69-82 | 49 | 76 ± 6 | 68-85 | 89 |
† Significantly different ( P <.001) from values at 6 months (Student’s paired t -test).
| Age | Male Subjects | Female Subjects | |||||
|---|---|---|---|---|---|---|---|
| Ferritin | ng/mL | µg/L | ng/mL | µg/L | |||
| 1-30 d * | 6-400 | 6-400 | 6-515 | 6-515 | |||
| 1-6 m * | 6-410 | 6-410 | 6-340 | 6-340 | |||
| 7-12 m * | 6-80 | 6-80 | 6-45 | 6-45 | |||
| 1-5 y † ‡ | 6-24 | 6-24 | 6-24 | 6-24 | |||
| 6-9 y † ‡ | 10-55 | 10-55 | 10-55 | 10-55 | |||
| 10-14 y ‡ | 23-70 | 23-70 | 6-40 | 6-40 | |||
| 14-19 y ‡ | 23-70 | 23-70 | 6-40 | 6-40 | |||
| Iron | µg/dL | µmol/L | µg/dL | µmol/L | |||
| 1-5 y † ‡ | 22-136 | 4-25 | 22-136 | 4-25 | |||
| 6-9 y † ‡ | 39-136 | 7-25 | 39-136 | 7-25 | |||
| 10-14 y ‡ | 28-134 | 5-24 | 45-145 | 8-26 | |||
| 14-19 y ‡ | 34-162 | 6-29 | 28-184 | 5-33 | |||
| Iron-Binding Capacity | |||||||
| 1-5 y † ‡ | 268-441 | 48-79 | 268-441 | 48-79 | |||
| 6-9 y † ‡ | 240-508 | 43-91 | 240-508 | 43-91 | |||
| 10-14 y ‡ | 302-508 | 54-91 | 318-575 | 57-103 | |||
| 14-19 y ‡ | 290-570 | 52-102 | 302-564 | 52-101 | |||
| Transferrin Saturation | |||||||
| 1-5 y † ‡ | 0.07-0.44 | 0.07-0.44 | |||||
| 6-9 y † ‡ | 0.17-0.42 | 0.17-0.42 | |||||
| 10-14 y ‡ | 0.11-0.36 | 0.02-0.40 | |||||
| 14-19 y ‡ | 0.06-0.33 | 0.06-0.33 | |||||
| Transferrin | U/L (Males and Females) | ||||||
| 0-5 d § | 1.43-4.46 | ||||||
| 1-3 y § | 2.18-3.47 | ||||||
| 4-6 y § | 2.08-3.78 | ||||||
| 7-9 y § | 2.25-3.61 | ||||||
| 10-13 y § | 2.24-4.42 | ||||||
| 14-19 y § | 2.33-4.44 | ||||||
* Soldin SJ, Morales A, Albalos F, et al: Pediatric reference ranges on the Abbott IMx for FSH, LH, prolactin, TSH, T 4, T 3 , free T3, T-uptake, IgE, and ferritin. Clin Biochem 28:603, 1995. Study based on hospitalized patients; values represent 2.5th and 97.5th percentiles.
† No significant differences between males and females; range derived from combined data.
‡ Lockitch, G; Halstead, AC; Wadsworth, et al: Age- and sex-specific pediatric reference intervals and correlations for zinc, copper, selenium, iron, vitamins A and E, and related proteins. Clin Chem 34:1625, 1988. Study based on healthy children; values represent the 0.025 and 0.975 fractiles. Transferrin saturation calculated from iron (µmol/L)/total iron binding capacity. Note that the lower reference limits for serum iron and transferrin saturation in this study are below the limits used to define acceptable levels for these two analytes (O’Neal RM, Johnson OC, Schaefer AE: Guidelines for classification and interpretation of group blood and urine data collected as part of the National Nutrition Survey. Pediatr Res 4:103, 1970.)
§ Lockitch, G; Halstead, AC; Quigley G, et al: Age- and sex-specific pediatric reference intervals: study design and methods illustrated by measurement of serum proteins with the Behring LN nephelometer. Clin Chem 34:1618, 1988. Results are 2.5th and 97.5 percentiles.
| Age Groups | Blood ZPP Reference Ranges 2.5th–97.5th Percentiles (µg/dL) * | Blood ZPP Reference Ranges 2.5th–97.5th Percentiles (µmol/mol heme) | N | |||
|---|---|---|---|---|---|---|
| Males | Females | Males | Females | Males | Females | |
| 0-12 months | 8.5-34.5 | 9-40 | 15.6-63.5 | 16.6-73.6 | 145 | 203 |
| 13-24 months | 10-34 | 11-32 | 18.4-62.6 | 20.2-58.9 | 605 | 725 |
| 2-5 years | 5-35 | 10-31 | 9.2-64.4 | 18.4-57.0 | 1926 | 1822 |
| 6-9 years | 6-31 | 9-30 | 11.0-57.0 | 16.6-55.2 | 522 | 408 |
| 10-17 years | 5.5-31.5 | 5-33.5 | 10.1-58.0 | 9.2-61.6 | 61 | 61 |
| Total | 3259 | 3219 | ||||
| Age Groups | 2.5% Reference Limit mg/L | 97.5% Reference Limit mg/L |
|---|---|---|
| 6 months to 4 years | 1.5 (1.4-1.5) | 3.3 (3.1-3.4) |
| 4 to 10 years | 1.3 (1.3-1.4) | 3.0 (2.9-3.2) |
| 10 to 16 years | 1.2 (1.1-1.2) | 2.7 (2.7-2.8) |
| >16 years | 0.9 (0.9-1.0) | 2.3 (2.2-2.4) |
* The 95% confidence interval for each limit is given in parentheses.
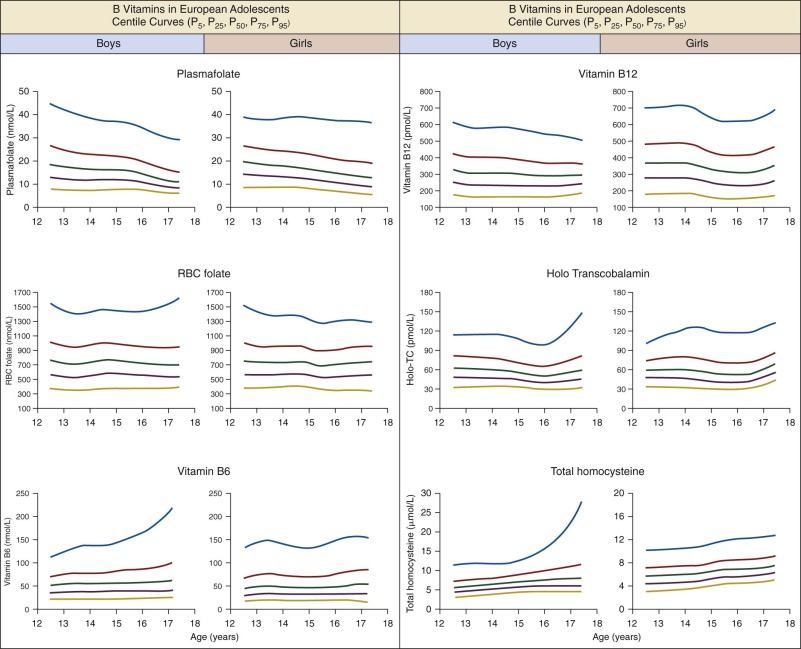
| PF(nmol/L) | RBC Folate nmol/L | PLP (nmol/L) | Cbl (pmol/L) | Holo-TC (pmol/L) | tHcy (µmol/L) | ||
|---|---|---|---|---|---|---|---|
| N | 1049 | 1040 | 974 | 1051 | 1017 | 1050 | |
| Mean | 18.7 | 784.2 | 63.2 | 349.4 | 63.4 | 7.4 | |
| SD | 10.5 | 340.9 | 51.9 | 143.5 | 33.7 | 3.8 | |
| Percentile | 2.5 | 6.4 | 315.5 | 16.6 | 154.4 | 27.4 | 3.7 |
| 5 | 7.6 | 378.8 | 20.0 | 170.8 | 30.9 | 3.9 | |
| 10 | 9.1 | 428.9 | 25.0 | 193.0 | 35.2 | 4.4 | |
| 25 | 11.8 | 553.0 | 34.7 | 240.0 | 44.4 | 5.4 | |
| 50 | 16.0 | 721.9 | 49.1 | 319.0 | 57.8 | 6.7 | |
| 75 | 22.1 | 942.3 | 75.7 | 434.9 | 73.0 | 8.4 | |
| 90 | 31.7 | 1214.0 | 113.9 | 557.0 | 91.7 | 10.5 | |
| 95 | 39.0 | 1389.3 | 149.7 | 638.0 | 107.1 | 12.3 | |
| 97.5 | 46.4 | 1582.6 | 187.3 | 696.0 | 127.1 | 15.7 |
| Age | MALES AND FEMALES | |
|---|---|---|
| µmol/L | µg/mL | |
| Premature * | 1-8 | 0.5-3.5 |
| Full Term | 2-8 | 0.5-3.5 |
| 2-5 m * | 5-14 | 2.0-6.0 |
| 6-24 m * | 8-19 | 3.5-80 |
| 2-12 y * | 13-21 | 5.5-9.0 |
| 1-6 y † | 7-21 | 3.0-9.0 |
| 7-12 y † | 10-21 | 4.0-9.0 |
| 13-19 y † | 13-24 | 6.0-10.1 |
* Meites S, editor: Pediatric clinical chamistry, 3rd ed. Washington, DC, 1989, AACC Press, p. 295–296.
† Lockitch G, Halstead AC, Wadsworth L, et al: Age- and sex-specific pediatric reference intervals for zinc, copper, selenium, iron, vitamins A and E and related proteins. Clin Chem 34:1625, 1988. Study based on healthy children; values represent the 0.025th and 0.975th fractiles.
| Days After Birth | Erythropoietin (mU/mL) | Hemoglobin (g/dL) | RBC (×10 6 /µL) |
|---|---|---|---|
| 0-6 | 33.0 ± 31.4 (11) | 15.6 ± 2.2 (11) | 4.51 ± 0.74 (11) |
| 7-50 | 11.7 ± 3.6 (7) | 12.8 ± 1.1 (5) | 3.92 ± 0.35 (5) |
| 51-100 | 21.1 ± 5.5 (13) | 11.4 ± 1.0 (10) | 4.09 ± 0.51 (10) |
| 101-150 | 15.1 ± 3.9 (5) | 11.2 ± 1.1 (3) | 4.21 ± 0.31 (3) |
| 151-200 | 17.8 ± 6.3 (6) | — | — |
| >201 | 23.1 ± 9.7 (10) | 11.8 ± 0.8 (9) | 4.57 ± 0.25 (9) |
* Values are expressed as mean ± standard deviation; number of specimens is within parentheses.
| Age (y) | MALE SUBJECTS | FEMALE SUBJECTS | ||
|---|---|---|---|---|
| 2.5% | 97.5% | 2.5% | 97.5%) | |
| 1-3 | 1.7 | 17.9 | 2.1 | 15.9 |
| 4-6 | 3.5 | 21.9 | 2.9 | 8.5 |
| 7-9 | 1.0 | 13.5 | 2.1 | 8.2 |
| 10-12 | 1.0 | 14.0 | 1.1 | 9.1 |
| 13-15 | 2.2 | 14.4 | 3.8 | 20.5 |
| 16-18 | 1.5 | 15.2 | 2.0 | 14.2 |
* Data obtained from a total of 1122 hospitalized and outpatient children ages 1 to 18 years. Levels found in anemic patients cannot be compared with normal values. In fact, as long as the erythropoietin-generating apparatus in the kidney is efficient, serum levels increase exponentially as the hematocrit concentration decreases. Serum erythropoietin must therefore be evaluated in relation to the degree of anemia, and every single laboratory should determine the exponential regression of serum erythropoietin versus hematocrit (or hemoglobin) in a home-made reference population of anemic subjects and define the 95% confidence limits. The patients gathered to calculate a reference regression equation should have an anemia with a single simple mechanism and no evidence of either renal failure or excessive cytokine production (i.e., normal values for C-reactive protein and α 2 -globulins). Patients with chronic iron-deficiency anemia caused by nonneoplastic and noninflammatory chronic blood loss have the advantages of being easily found, unequivocably defined, and homogeneous. They could become the universal reference population, although patients with hemolytic anemia or thalassemia intermedia also may be studied as reference subjects. Serum erythropoietin levels are also much higher for hemoglobin concentration in hypoplastic than in hyperplastic states. Thus for the same hemoglobin concentration, serum erythropoietin levels are lower in thalassemia intermedia than in Diamond-Blackfan anemia.
Stay updated, free articles. Join our Telegram channel

Full access? Get Clinical Tree


