Antigen-Antibody Interactions and Monoclonal Antibodies
Jay A. Berzofsky
Ira J. Berkower
INTRODUCTION
The basic principles of antigen-antibody interaction are those of any bimolecular reaction. Moreover, the binding of antigen by antibody can, in general, be described by the same theories and studied by the same experimental approaches as the binding of a hormone by its receptor, of a substrate by enzyme, or of oxygen by hemoglobin. There are several major differences, however, between antigen-antibody interactions and these other situations. First, unlike most enzymes and many hormone-binding systems, antibodies do not irreversibly alter the antigen they bind. Thus, the reactions are, at least in principle, always reversible. Second, antibodies can be raised, by design of the investigator, with specificity for almost any substance known. In each case, one can find antibodies with affinities as high as and specificities as great as those of enzymes for their substrates and receptors for their hormones. The interaction of antibody with antigen can thus be taken as a prototype for interactions of macromolecules with ligands in general. In addition, these same features of reversibility and availability of a wide variety of specificities have made antibodies invaluable reagents for identifying, quantitating, and purifying a growing number of substances of biologic and medical importance.
One other feature of antibodies that in the past proved to be a difficulty in studying and using them, compared to, say, enzymes, is their enormous heterogeneity. Even “purified” antibodies from an immune antiserum, all specific for the same substance and sharing the same overall immunoglobulin (Ig) structure, will be a heterogeneous mixture of molecules of different subclass, different affinity, and different fine specificity and ability to discriminate among crossreacting antigens. The advent of hybridoma monoclonal antibodies1,2,3 has made available a source of homogeneous antibodies to almost anything to which antisera can be raised. Nevertheless, heterogeneous antisera are still in widespread use and even have advantages for certain purposes, such as precipitation reactions. Therefore, it is critical to keep in mind throughout this chapter, and indeed much of the volume, that the principles derived for the interaction of one antibody with one antigen must be modified and extended to cover the case of heterogeneous components in the reaction.
In this chapter, we examine the theoretical principles necessary for analyzing, in a quantitative manner, the interaction of antibody with antigen and the experimental techniques that have been developed to study these interactions as well as to make use of antibodies as quantitative reagents. Furthermore, we discuss the derivation, use, and properties of monoclonal antibodies.
THERMODYNAMICS AND KINETICS
The Thermodynamics of Affinity
The basic thermodynamic principles of antigen-antibody interactions, as we indicated previously, are the same as those for any reversible bimolecular binding reaction. We review these as they apply to this particular immunologic reaction.
Chemical Equilibrium in Solution
For this purpose, let S = antibody binding sites, L = ligand (antigen) sites, and SL = the complex of the two. Then for the reaction

the mass action law states

where KA = association constant (or affinity) and square brackets = molar concentration of the reactants enclosed. The import of this equation is that for any given set of conditions such as temperature, pH, and salt concentration, the ratio of the concentration of the complex to the product of the concentrations of the reactants at equilibrium is always constant. Thus, changing the concentration of either antibody or ligand will invariably change the concentration of the complex, provided neither reactant is limiting, that is, neither has already been saturated, and provided sufficient time is allowed to reach a new state of equilibrium. Moreover, because the concentrations of antibody and ligand appear in this equation in a completely symmetrical fashion, doubling either the antibody concentration or the antigen concentration results in a doubling of the concentration of the antigen-antibody complex, provided the other reactant is in sufficient excess. This proviso, an echo of the one just discussed, is inherent in the fact that [S] and [L] refer to the concentrations of free S and free L, respectively, in solution, not the total concentration, which would include that of the complex. Thus, if L is not in great excess, doubling [S] results in a decrease in [L] as some of it is consumed in the complex, so the net result is less than a doubling of [SL]. Similarly, halving the volume results in a doubling of the total concentration of both antibody and
ligand. If the fraction of both reactants tied up in the complex is negligibly small (as might be the case for low-affinity binding), the concentration of the complex quadruples. However, in most practical cases, the concentration of complex is a significant fraction of the total concentration of antigen or antibody or both, so the net result is an increase in the concentration of complex but by a factor of <4. The other important, perhaps obvious, but often forgotten, principle to be gleaned from this example is that because it is concentration, not amount, of each reactant that enters into the mass action law (Equation 2), putting the same amount of antigen and antibody in a smaller volume will increase the amount of complex formed, and diluting them in a larger volume will greatly decrease the amount of complex formed. Moreover, these changes go approximately as the square of the volume, so volumes are critical in the design of an experiment.
ligand. If the fraction of both reactants tied up in the complex is negligibly small (as might be the case for low-affinity binding), the concentration of the complex quadruples. However, in most practical cases, the concentration of complex is a significant fraction of the total concentration of antigen or antibody or both, so the net result is an increase in the concentration of complex but by a factor of <4. The other important, perhaps obvious, but often forgotten, principle to be gleaned from this example is that because it is concentration, not amount, of each reactant that enters into the mass action law (Equation 2), putting the same amount of antigen and antibody in a smaller volume will increase the amount of complex formed, and diluting them in a larger volume will greatly decrease the amount of complex formed. Moreover, these changes go approximately as the square of the volume, so volumes are critical in the design of an experiment.
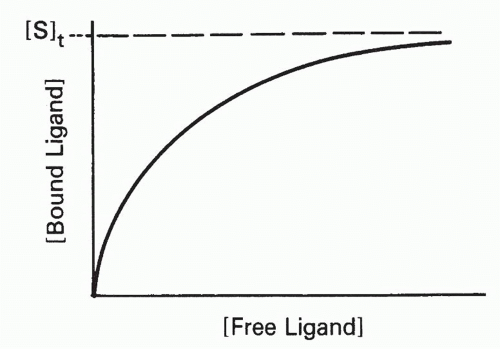
The effect of increasing free ligand concentration [L], at constant total antibody concentration, on the concentration of complex, [SL], is illustrated in Figure 7.1. The mass action law (Equation 2) can be rewritten as

or

where [S]t = total antibody site concentration; that is, [S] + [SL]. Initially, when the complex [SL] is a negligible fraction of the total antibody [S]t, the concentration of complex increases nearly linearly with increasing ligand. However, as a larger fraction of antibody is consumed, the slope tapers off and the concentration of complex, [SL], asymptotically approaches a plateau value of [S]t as all the antibody becomes saturated. Thus, the concentration of antibody-binding sites can be determined from such a saturation binding curve (see Fig. 7.1), taking the concentration of (radioactively or otherwise labeled) ligand bound at saturation as a measure of the concentration of antibody sites.* This measurement is sometimes referred to as antigen-binding capacity.
The total concentration of ligand at which the antibody begins to saturate is a function not only of the antibody concentration but also of the association constant, KA, also called the affinity. This constant has units of molar (M-1) or L/mol, if all the concentrations in Equation 2 are molar. Thus the product KA[L] is unitless. It is the value of this product relative to 1 that determines how saturated the antibody is, as can be seen from Equation 3′. For example, an antibody with an affinity of 107 M-1 will not be saturated if the ligand concentration is 10-8 M (product KA[L] = 0.1) even if the total amount of ligand is in great excess over the total amount of antibody. From Equation 3′ the fraction of antibody occupied would be only 0.1/1.1, or about 9%, in this example. These aspects of affinity and the methods for measuring affinity are analyzed in greater detail in the next section.
Free Energy
Regarding thermodynamics, the affinity, KA, is also the central quantity because it is directly related to the free energy, ΔF, of the reaction by the equations


where R = so-called gas constant (1.98717 cal/°K•mol), T = absolute temperature (in degrees Kelvin), ln = natural logarithm, and e = base of the natural logarithms. The minus sign is introduced because of the convention that a negative change in free energy corresponds to positive binding. The ΔF° is the standard free-energy change defined as the ΔF for 1 mol antigen + 1 mol antibody sites combining to form 1 mol of complex at unit concentration.
It is also instructive to note an apparent discrepancy in Equations 4 and 4′. As defined in Equation 2, KA has dimensions of M-1 (ie, L/mol), whereas in Equation 4′, it is dimensionless. The reason is that for Equation 4′ to hold strictly, KA must be expressed in terms of mole fractions rather than concentrations. The mole fraction of a solute is the ratio of moles of that solute to the total number of moles of all components in the solution. Because water (55 M) is by far the predominant component of most aqueous solutions, for practical purposes, one can convert KA into a unitless ratio of mole fractions by dividing all concentrations in Equation 2 by 55 M. This transformation makes Equation 4′ strictly correct, but it introduces an additional term, -RT ln 55 (corresponding to the entropy of dilution), into Equation 4. This constant term cancels out when one is subtracting ΔF values but not when one discusses ratios of ΔF values.
An important rule of thumb can be extracted from these equations. Because ln 10 = 2.303, a 10-fold increase in affinity of binding corresponds to a free-energy change ΔF of only 1.42 kcal/mol at 37°C (310.15°K). (The corresponding values for 25 and 4°C are 1.36 and 1.27 kcal/mol, respectively.) This is less than one-third the energy of a single hydrogen bond (about 4.5 kcal/mol). Looked at another way, a very high affinity of 1010 M-1 corresponds to a ΔF of only 14.2 kcal/mol, approximately the bonding energy of three hydrogen bonds. (Of course, because hydrogen bonds with water are broken during the formation of hydrogen bonds between
antigen and antibody, the net energy per hydrogen bond is closer to 1 kcal/mol.) It is apparent from this example that of the many interactions (hydrophobic and ionic as well as hydrogen bonding) that occur between the contact residues in an antibody-combining site and the contacting residues of an antigen (such as a protein), almost as many are repulsive as attractive. It is this small difference of a few kilocalories between much larger numbers corresponding to the total of attractive and the total of repulsive interactions that leads to net “high-affinity” binding. If ΔF were any larger, binding reactions would be of such high affinity as to be essentially irreversible. Viewed in this way, it is not surprising that a small modification of the antigen can result in an enormous change in affinity. A single hydrogen bond can change the affinity manyfold, and similar arguments apply to hydrophobic interactions and other forms of bonding. This concept is important when we discuss specificity and antigen structure later.
antigen and antibody, the net energy per hydrogen bond is closer to 1 kcal/mol.) It is apparent from this example that of the many interactions (hydrophobic and ionic as well as hydrogen bonding) that occur between the contact residues in an antibody-combining site and the contacting residues of an antigen (such as a protein), almost as many are repulsive as attractive. It is this small difference of a few kilocalories between much larger numbers corresponding to the total of attractive and the total of repulsive interactions that leads to net “high-affinity” binding. If ΔF were any larger, binding reactions would be of such high affinity as to be essentially irreversible. Viewed in this way, it is not surprising that a small modification of the antigen can result in an enormous change in affinity. A single hydrogen bond can change the affinity manyfold, and similar arguments apply to hydrophobic interactions and other forms of bonding. This concept is important when we discuss specificity and antigen structure later.
Effects of Temperature, pH, Salt Concentration, and Conformational Flexibility
It was mentioned previously that KA is constant for any given set of conditions such as temperature, pH, and salt concentration. However, it varies with each of these conditions. We have already seen that the conversion of free energy to affinity depends on temperature. However, the free energy itself is also a function of temperature

where ΔH = change in enthalpy (the heat of the reaction),† ΔS = entropy (a term related to the change in disorder produced by the reaction),2 and T = absolute temperature (in degrees Kelvin).
It can be shown that the association constant KA will thus vary with temperature as follows:

or equivalently,

The derivation of these equations is beyond the scope of this book.4 However, the practical implications are as follows. First, one can determine the standard ΔH° of the reaction from the slope of a plot of ln KA versus 1/T. Second, for an interaction that is primarily exothermic (ie, driven by a large negative ΔH, such as the formation of hydrogen bonds and polar bonds), the affinity decreases with increasing temperature. Thus many antigen-antibody interactions have a higher affinity at 4°C than at 25°C or 37°C, so maximum binding for a given set of concentrations can be achieved in the cold. In contrast, apolar or hydrophobic interactions are driven largely by the entropy term T ΔS, and ΔH° is near zero. In this case, there is little effect of temperature on the affinity.
As for the effects of pH and salt concentration (or ionic strength) on the affinity, these vary depending on the nature of the interacting groups. Most antigen-antibody reactions are studied near neutral pH and at physiologic salt concentrations (0.15 M NaCl). If the interaction is dominated by ionic interactions, high salt concentration lowers the affinity.
Conformational flexibility of an antigen can also affect the affinity by affecting the entropy term in Equation 5. An outstanding example comes from the thermodynamics of binding of a series of broadly neutralizing monoclonal antibodies to the human immunodeficiency virus (HIV) envelope protein gp120. The energetics of binding between HIV gp120 and its cellular receptor cluster of differentiation (CD)45 or to a panel of monoclonal antibodies6 has been studied in detail. The results provide insight into the ways protein flexibility can help the virus to evade antibody immunity. They may also explain part of the difficulty in eliciting antibodies of this type when immunizing with the native protein.
GP120 is a glycoprotein that exhibits at least two conformational states: one exists on the virus, and it changes to the other when it binds the CD4 receptor on the cell surface. Monoclonal antibodies F105 and b12 bind residues within the CD4 binding site on gp120 while monoclonal 2G12 binds the opposite surface. The CD4 binding site defines a neutralizing surface that is conserved among a broad range of HIV isolates.
As shown in Table 7.1, CD4 and each antibody demonstrated a strongly negative ΔF, corresponding to high affinity binding. However, as shown by microcalorimetry, they arrived at the affinity in different ways. The CD4 and F105 have a strong negative ΔH of binding, but they also have a large negative entropy due to the conformational change required, as shown by strongly positive values for -TΔS. This entropy effect greatly reduces the overall ΔF of binding, so they depend on a very large negative ΔH to bind. In contrast, monoclonal b12 has moderate levels of both ΔH and -TΔS, resulting in a nearly identical ΔF. Monoclonal 2G12 binds gp120 with a less favorable ΔH but no entropy cost.
The two discrete conformations of gp120 may be called the open and closed forms. The excursion between these two conformations affects the entropy of binding. CD4 and F105 only bind the open form, which reduces randomness and creates an entropy barrier. Monoclonal b12 is less dependent on one conformation, so it binds with less entropy cost, and 2G12 is indifferent to the two forms, so it has no entropy effect at all.
The strong entropy effect observed for these monoclonals may illustrate one way for the virus to evade antibody binding, through a mechanism called conformational masking.
The randomness of gp120, as found on the virus, means that it is rarely in the open conformation, making it difficult for most antibodies such as F105 to bind. Only the rare antibody that is b12-like can bind multiple forms and eventually pull gp120 into its most favorable conformation.
The randomness of gp120, as found on the virus, means that it is rarely in the open conformation, making it difficult for most antibodies such as F105 to bind. Only the rare antibody that is b12-like can bind multiple forms and eventually pull gp120 into its most favorable conformation.
TABLE 7.1 Energetics of Antibody Binding to gp120 Core Structure | ||||||||||||||||||||||||
|---|---|---|---|---|---|---|---|---|---|---|---|---|---|---|---|---|---|---|---|---|---|---|---|---|
| ||||||||||||||||||||||||
The same effect may explain the difficulty in eliciting antibodies to this site using native gp120. If it is rarely in the open form, it will be unable to trigger B cells to make antibodies that require this form, and it will deliver only a weak antigenic stimulus to those that bind partially to different conformations, such as b12. These considerations suggest that a more favorable vaccine antigen could be made if gp120 could be anchored in the open conformation, so it could stimulate B cells to make antibodies that require this form. The hallmark of this structure would be its ability to bind F105 and b12 with a good ΔH and reduced values of -TΔS.
Kinetics of Antigen-Antibody Reactions
A fundamental connection between the thermodynamics and kinetics of antigen-antibody binding is expressed by the relationship

where k1 and k-1 are the rate constants for the forward (association) and backward (dissociation) reactions.
The forward reaction is determined largely by diffusion rates (theoretical upper limit 109 L/mol/sec) and by the probability that a collision will result in binding, that is, largely the probability that both the antigen and the antibody will be oriented in the right way to produce a good fit as well as the activation energy for binding. The diffusive rate constant can be shown7 to be approximated by the Smoluchowski equation

where a = sum of the radii in centimeters of the two reactants, D = sum of the diffusion constants in cm2/sec for the individual reactants, and the constant 6 ×10²⁰ is necessary to convert the units to M-1. • sec-1. For example, if a = 10-6 cm and D = 10-7 cm2/sec, then kd1 ≈ 7.5 × 10⁸ M-1. • sec-1. Association rates will generally be slower for large protein antigens than for small haptens. This observation may be due to the smaller value of D, to the orientational effects in the collision, and to other nondiffusional aspects of protein-protein interactions. Therefore, association rates for protein antigens are more frequently on the order of 105 to 106 M-1. • sec-1 (see following discussion). However, this observation can also be partly understood from diffusion-limited rates alone. If the radii of hypothetically spherical reactants are r1 and r2, then in Equation 7a, a = r1 + r2, whereas D is proportional to 1/r1 + 1/r2. The diffusive rate constant is therefore proportional to

From this result, it can be seen that if r1 = r2 =r, then r cancels out and the whole term in Equation 7b is simply equal to 4. Thus, for the interaction between two molecules of equal size, the diffusive rate constant is the same regardless of whether those molecules are large or small.8 However, if one molecule is large and the other small, the rate is greater than if both molecules are large. This difference occurs because reducing the radius r1 while keeping r2 constant (and larger than r1) has a greater effect on increasing the diffusion constant term D, proportional to (1/r1 + 1/r2), in which the smaller radius produces the larger term than it has on the term a, which is still dominated by the larger radius r2. For example, if r2 = r as shown, but r1 = 0.1r, then the numerator in Equation 7b is only reduced from 4r2 to 1.21r2, whereas the denominator is reduced from 1r2 to 0.1r2. Thus, the ratio is increased from 4 to 12.1. Viewed another way, the greater diffusive mobility of the small hapten outweighs its diminished target area relative to a large protein antigen because the larger target area of the antibody is available to both.
The dissociation rate (or “off rate”) k-1 is determined by the strength of the bonds (as it affects the activation energy barriers for dissociation) and the thermal energy kT (where k is Boltzmann constant), which provides the energy to surmount this barrier. The activation energy for dissociation is the difference in energy between the starting state and the transition state of highest energy to which the system must be raised before dissociation can occur.
As pointed out by Eisen,9 if one compares a series of related antigens, of similar size and other physical properties, for binding to an antibody, the association rates are all very similar. The differences in affinity largely correspond to the differences in dissociation rates.
A good example is that of antibodies to the protein antigen staphylococcal nuclease.10 Antibodies to native nuclease were fractionated on affinity columns of peptide fragments to isolate a fraction specific for residues 99 through 126. The antibodies had an affinity of 8.3 × 10⁸ M-1 for the native antigen and an association rate constant, kon, of 4.1 × 10⁵ M-1. • sec-1. This kon was several orders of magnitude lower than had been observed for small haptens,11 as discussed previously. A value of koff of 4.9 × 10⁻⁴ sec-1 was calculated using these results in Equation 7. This is a first-order rate constant from which one can calculate a halftime for dissociation (based on t1/2 = ln 2/koff) of 23 minutes. These rates are probably typical for high-affinity (KA ≈ 109 M-1) antibodies to small protein antigens such as nuclease (molecular weight [MW] ≈ 17,000). The dissociation rate is important to know in designing experiments to measure binding because if the act of measurement perturbs the equilibrium, the time one has to make the measurement (eg, to separate bound and free) is determined by this halftime for dissociation. For instance, a 2-minute procedure that involves dilution of the antigen-antibody mixture can be completed before significant dissociation has occurred if the dissociation halftime is 23 minute. However, if the on rate is the same, but the affinity 10-fold lower, still a respectable 8 × 10⁷ M-1, then the complex could be 50% dissociated in the time required to complete the procedure. This caution is relevant when we discuss methods of measuring binding and affinity in the following.
Because knowledge of the dissociation rate can be so important in the design of experiments, a word should be said about techniques to measure it. Perhaps the most widely applicable one is the use of radiolabeled antigen. After equilibrium is reached and the equilibrium concentration of bound radioactivity determined, a large excess of unlabeled antigen is added. Because any radioactive antigen molecule that dissociates is quickly replaced by an unlabeled one, the probability of a radioactive molecule associating again is very small. Therefore, one can measure the decrease in radioactivity bound to antibody with time to determine the dissociation rate.‡
AFFINITY
It is apparent from the previous discussion that a lot of information about an antigen-antibody reaction is packed into a single value, its affinity. In this section, we examine affinity more closely, including methods for measuring affinity and the heterogeneity thereof, the effects of multivalency of antibody and/or of antigen, and the special effects seen when the antigen-antibody interaction occurs on a solid surface (two-phase systems).
Interaction in Solution with Monovalent Ligand
The simplest case is that of the interaction of antibody with monovalent ligand. We may include in this category both antihapten antibodies reacting with truly monovalent haptens and antimacromolecule antibodies, which have been fractionated to obtain a population that reacts only with a single, nonrepeating site on the antigen.** In the latter case, the antigen behaves as if monovalent in its interaction with the particular antibody population under study. The proviso that the site recognized (antigenic determinant) be nonrepeating, that is, occur only once per antigen molecule, of course, is critical.
If the combining sites on the antibody are independent (ie, display no positive or negative cooperativity for antigen binding), then for many purposes one can treat these combining sites, reacting with monovalent ligands, as if they were separate molecules. Thus, many, but not all, of the properties we discuss can be analyzed in terms of the concentration of antibody-combining sites, independent of the number of such sites per antibody molecule (2 for IgG and IgA, 10 for IgM).
To determine the affinity of an antibody, one generally determines the equilibrium concentrations of bound and free ligand, at increasing total ligand concentrations, but at constant antibody concentration. Alternatively, one can vary the antibody concentration, but then, the analysis is slightly more complicated. Perhaps the theoretically most elegant experimental method to determine these quantities is equilibrium dialysis,12,13 depicted and explained in Figure 7.2, in which ligand (antigen) is allowed to equilibrate between two chambers, only one of which contains antibody, separated by a semipermeable membrane impermeable to antibody. The important feature of this method, as opposed to most others, is that the concentrations of ligand in each chamber can be determined without perturbing the equilibrium. The disadvantage of this method is that it is applicable only to antigens small enough to permeate freely a membrane that will exclude antibody. Another technical disadvantage is that bound antigen, determined as the difference between bound plus free antigen in one chamber and free antigen in the other, is not measured independently of free antigen.
Another category of method uses radiolabeled ligand in equilibrium with antibody and then physically separates free antigen bound to antibody and quantitates each separately. The methods used to separate bound and free antigen are discussed in the section on radioimmunoassay (RIA). These methods generally allow independent measurement of bound and free antigen but may perturb the equilibrium.
Scatchard Analysis
Once data are obtained, there are a number of methods of computing the affinity, of which we shall discuss two.
Perhaps the most widely used is that described by Scatchard14 (Fig. 7.315). The mass action equilibrium law is plotted in the form of Equation 3
Perhaps the most widely used is that described by Scatchard14 (Fig. 7.315). The mass action equilibrium law is plotted in the form of Equation 3
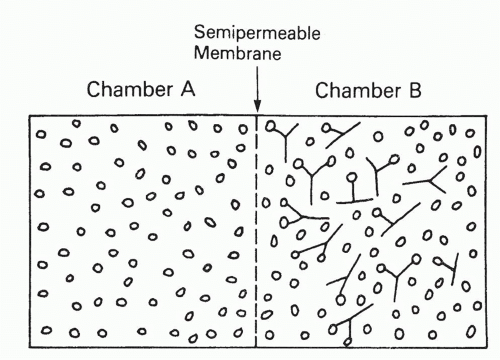 FIG. 7.2. Equilibrium Dialysis. Two chambers are separated by a semipermeable membrane that is freely permeable to ligand but not at all to antibody. Antibody is placed in one chamber (B) and ligand in one or both chambers. Regardless of how the ligand is distributed initially, after sufficient time to reach equilibrium, it will be distributed as follows. The concentration of free ligand will be identical in both chambers, but chamber B will have additional ligand bound to antibody. The concentration of bound ligand is thus the difference between the ligand concentration in the two chambers, whereas the free concentration is the concentration in chamber A. Because these concentrations must obey the mass action law, Equation 2, they can be used to determine the affinity KA, from Equation 3 or 3′, by any of several graphical procedures, such as Scatchard analysis (described in the text). |
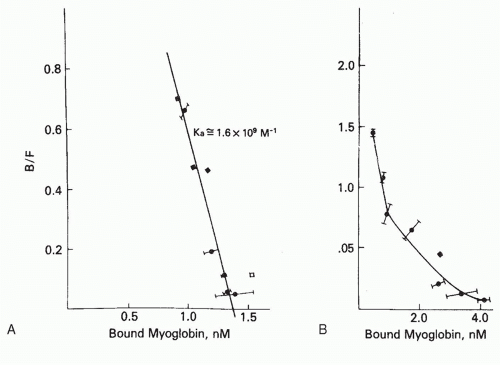 FIG. 7.3. Scatchard analysis of the binding of [3H]-sperm whale myoglobin by a monoclonal antibody to myoglobin (A) and by the serum antibodies from the same mouse whose spleen cells were fused to prepare the hybridoma (B). The monoclonal antibody (clone HAL 43-201E11, clone 5) produces a linear Scatchard plot, whose slope, -1.6 × 10⁹ M-1, equals -KA, and whose intercept on the abscissa gives the concentration of antibodybinding sites. In contrast, the serum antibodies produce a curved (concave up) Scatchard plot, indicative of heterogeneity of affinity. From Berzofsky et al.,15 with permission. |

and B is substituted for [SL] and F for [L], referring to bound and free ligand, respectively. Then the Scatchard equation is

Note that a very critical implicit assumption was made in this seemingly very simple conversion. The [SL] within the parentheses in Equation 3 was intended to be the concentration of bound antibody sites so that ([S]t – [SL]) = free [S]. However, in Equation 8, we have substituted B, the concentration of bound ligand. If the ligand behaves as monovalent, then this substitution is legitimate, as every bound ligand molecule corresponds to an occupied antibody site. However, if the ligand is multivalent and can bind more than one antibody site, then Equation 8 is valid only in ligand excess where the frequency of ligands with more than one antibody bound is very low. In this section, we are discussing only monovalent ligands, but this proviso must be kept in mind when the Scatchard analysis is applied in other circumstances.
From Equation 8, we see that a plot of B/F versus B should yield a straight line (for a single affinity), with a slope of -KA and an intercept on the abscissa corresponding to antibody-binding site concentration (see Fig. 7.3). This is the so-called Scatchard plot. An alternative version that is normalized for antibody concentration is especially useful if the data were obtained at different values of total antibody concentration, [A]t, instead of constant [A]t. However, for this version, one requires an independent measure of total antibody concentration, other than the intercept of the plot. Then one divides Equation 8 by the total concentration of antibody molecules (making no assumptions about the number of sites per molecule) to obtain

where r = the number of occupied sites per antibody molecule, n = the total number of sites per antibody molecule, and c = free ligand concentration, that is, c = F. Thus,
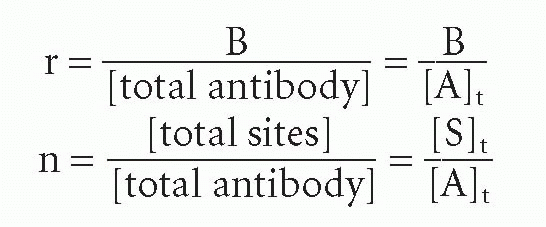
where [A]t = total molar antibody concentration. In this form of the Scatchard plot, r/c versus r, the slope is still -KA and the intercept on the r axis is n. Thus one can determine the number of sites per molecule. Of course, if one determines [S]t from the intercept of Equation 8, one can also calculate the number of sites per molecule by dividing [S]t by any independent measure of antibody concentration. Thus, the only advantage of normalizing all the data points first to plot the r/c form arises when the data were obtained at varying antibody concentrations. If the antibody concentration is unknown but held constant, then the B/F form is more convenient and actually provides one measure of antibody (site) concentration. Because today we know the value of n for each class of antibody (2 for IgG and serum IgA, 10 for IgM), the concentration of sites and that of antibody are easily converted in many cases.
Heterogeneity of Affinity
The next level of complexity arises when one is dealing with a mixture of antibodies of varying affinity for the ligand. This is the rule, rather than the exception, when one deals with antibodies from immune serum, even if they are fractionated to be monospecific, that is, all specific for the same site
on the antigen. Contrast, for example, the linear Scatchard plot for a homogeneous monoclonal antibody to myoglobin (see Fig. 7.3A), with the curved Scatchard plot for the serum antibodies from the same mouse used to prepare the hybridoma monoclonal antibody (see Fig. 7.3B). This concave up Scatchard plot is typical for heterogeneous antibodies. In a system such as hormone receptor-hormone interaction, in which negative cooperativity can occur between receptor sites (ie, occupation of one site lowers the affinity of its neighbor), a concave up Scatchard plot can be produced by negative cooperativity in the absence of any intrinsic heterogeneity in affinity. However, in the case of antibodies, where no such allosteric effect has been demonstrated, a concave up Scatchard plot indicates heterogeneity of affinity.
on the antigen. Contrast, for example, the linear Scatchard plot for a homogeneous monoclonal antibody to myoglobin (see Fig. 7.3A), with the curved Scatchard plot for the serum antibodies from the same mouse used to prepare the hybridoma monoclonal antibody (see Fig. 7.3B). This concave up Scatchard plot is typical for heterogeneous antibodies. In a system such as hormone receptor-hormone interaction, in which negative cooperativity can occur between receptor sites (ie, occupation of one site lowers the affinity of its neighbor), a concave up Scatchard plot can be produced by negative cooperativity in the absence of any intrinsic heterogeneity in affinity. However, in the case of antibodies, where no such allosteric effect has been demonstrated, a concave up Scatchard plot indicates heterogeneity of affinity.
Ideally, one would like to imagine that the tangents all along the curve correspond (in slope) to the affinities of the many subpopulations of antibodies. Mathematically, this is not strictly correct, but it is true that the steeper part of the curve corresponds to the higher affinity antibodies and the shallower part of the curve to the lower affinity antibodies. Graphical methods have been developed to analyze more quantitatively the components of such curves,16,17 and a very general and versatile computer program (LIGAND) has been developed by Munson and Rodbard18 that can fit such curves using any number of subpopulations of different affinity. For purposes of this chapter, we discuss only the case of two affinities and then examine the types of average affinities that have been proposed when one is dealing with much greater heterogeneity. We also examine mathematical estimates of the degree of heterogeneity (analogous to a variance).
When an antibody population consists of only two subpopulations of different affinities, K1 and K2, then we can add the component Equations 3′ to obtain

so that

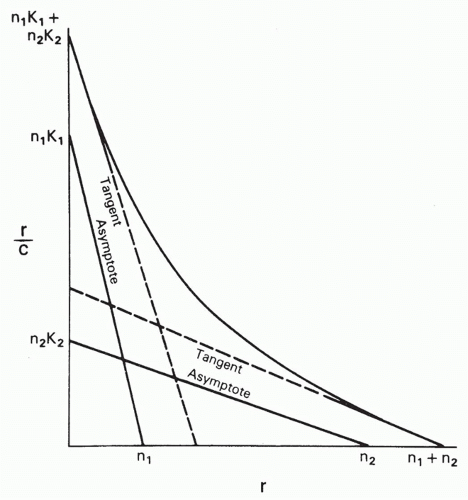
where the subscripts correspond to the two populations. Then the graph of r/c versus r can be shown to be a hyperbola whose asymptotes are, in fact, the linear Scatchard plots of the two components (Fig. 7.4). This situation has been analyzed graphically by Bright.19 Taking the limits as c → 0 and as c → ∞, it can easily be shown that the intercept on the abscissa is just n1 + n2 (or, in the form B/F versus B, the intercept is the total concentration of binding sites [S]t), and the intercept on the ordinate is n1K1 + n2K2. Thus, one can still obtain the total value of n or [S]t from the intercept on the abscissa. The problem is in obtaining the two affinities, K1 and K2, and the concentrations of the individual antibody subpopulations (corresonding to n1 and n2). If K1 is greater than K2, one can approximate the affinities from the slopes of the tangents at the two intercepts (see Fig. 7.4), but these will not, in general, be exactly parallel to the two asymptotes, which give the true affinities, so some error is always introduced, depending on the relative values of n1 and n2 and K1 and K2. A graphical method for solving for these exactly has been worked out by Bright19 and computer methods by Munson and Rodbard.18
Average Affinities
In practice, of course, one rarely knows that one is dealing with exactly two subpopulations, and most antisera are significantly more heterogeneous than that. Therefore, the previously mentioned case is more illustrative of principles than of practical value. When faced with a curved Scatchard plot, one usually asks what the average affinity is, and perhaps some measure of the variance of the affinities, without being able to define exactly how many different affinity populations exist.
Suppose one has m populations each with site concentration [Si] and affinity Ki, so that at free ligand concentration [L], the fraction of each antibody that has ligand bound will be given by an equation of the form of Equation 3′:

Then the bound concentrations sum to give

Substituting F for [L] and dividing through by this quantity, one obtains

or equivalently,

These can be seen to be generalizations of Equations 10 and 10′. Taking the limits as F → 0 and F → ∞, one again sees that the

and the

Therefore, one can still obtain the total antibody site concentration from the intercept on the abscissa (Fig. 7.5).20
Two types of average affinity can be obtained graphically from the Scatchard plot.20 Perhaps the more widely used K0 is actually more accurately a median affinity rather than a mean affinity. It is defined as the slope of the tangent at the point on the curve where half the sites are bound, that is, where B = [St]/2 (see Fig. 7.5). A second type of average affinity, which we call Kav, is a weighted mean of the affinities, each affinity weighted by its proportional representation in the antibody population. Thus, we take the ratio

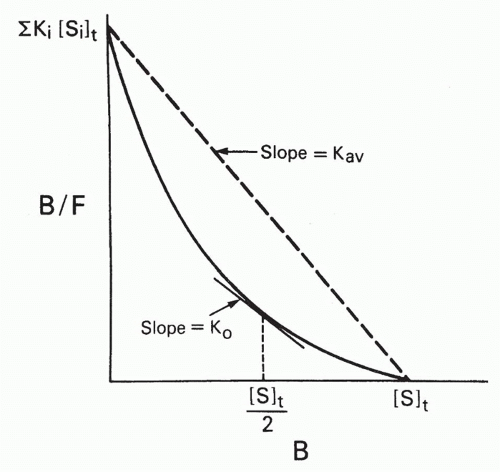 FIG. 7.5. Types of Average Affinities for a Heterogeneous Population of Antibodies, as Defined on a Scatchard Plot. K0 is the slope of the tangent to the curve at a point where B = [S]t/2, that is, where half the antibody sites are bound. Thus, K0 corresponds to a median affinity. The Kav is the slope of the chord between the intercepts and corresponds to a weighted average of the affinities weighted by the concentrations of the antibodies with each affinity. Adapted from Berzofsky.20 |
From Equations 13 and 14, it is apparent that Kav is simply the ratio of the two intercepts on the B/F and B axes, that is, the slope of the chord (see Fig. 7.5). This type of weighted mean affinity, Kav, is therefore actually easier to obtain graphically in some cases than K0, and we shall see that it is useful in other types of plots as well.
Indices of Heterogeneity: The Sips Plot
For a heterogeneous antiserum, one would also like to have some idea of the extent of heterogeneity of affinity. For instance, if the affinities were distributed according to a normal (Gaussian) distribution, one would like to know the variance.21,22 More complex analyses have been developed that do not require as many assumptions about the shape of the distribution,23,24,25 but the first and most widely used index of heterogeneity arbitrarily assumes that the affinities fit a distribution, first described by Sips,26 which is similar in shape to a normal distribution. This was applied to the case of antibody heterogeneity by Nisonoff and Pressman,27 and is summarized by Karush and Karush.28 One fits the data to the assumed binding function

which is analogous to Equations 3′ and 11 (the Langmuir adsorption isotherm) except for the exponent a, which is the index of heterogeneity. This index, a, is allowed to range from 0 to 1. For a = 1, Equation 16 is equivalent to Equation 3, and there is no heterogeneity. As a decreases toward 0, the heterogeneity increases. To obtain a value for a graphically, one plots the algebraic rearrangement of Equation 16:

so that the slope of log [r/(n – r)] versus log c is the heterogeneity index a.
C. DeLisi (personal communication) has derived the variance (second moment) of the Sips distribution in terms of the free energy RT ln K0, about the mean of free energy. The result (normalized to RT) gives the dispersion or width of the distribution as a function of a:

This is useful for determining a quantity, δSips, which can be thought of as analogous to a standard deviation, if one keeps in mind that this is not a true Gaussian distribution. In addition, as noted previously, the use of the Sips distribution requires the assumption that the affinities (really the free energies) are continuously distributed symmetrically about a mean, approximating a Gaussian distribution. This assumption frequently is not valid.
The Plot of B/F versus F or T
Another graphical method that is useful for estimating affinities is the plot of bound/free versus free or total ligand concentration, denoted F and T, respectively20 (Fig. 7.6). To simplify the discussion, let us define the bound/free ratio, B/F, as R, and define R0 as the intercept, or limit, as free
ligand F → 0. First, for the case of a homogeneous antibody, from Equation 3′,
ligand F → 0. First, for the case of a homogeneous antibody, from Equation 3′,
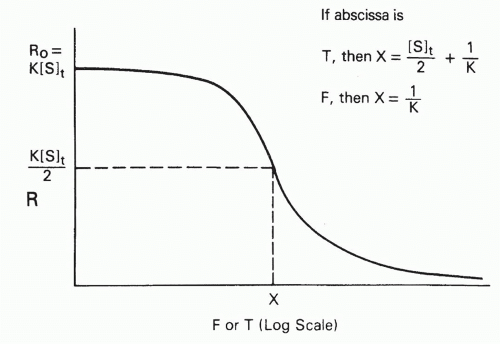 FIG. 7.6. Schematic Plot of R, the Bound/Free Ratio, as a Function of Free (F) or Total (T) Antigen Concentration. The curves have a similar sigmoidal shape, but the midpoint (where R = R0/2) of the plot of R versus T has a term dependent on antibody site concentration ([S]t), whereas the midpoint of the plot of R versus F is exactly 1/K, independent of antibody concentration. Adapted from Berzofsky.20 |

and

Let us define the midpoint of the plot (see Fig. 7.6) as the point at which R decreases to half its initial value, R0, that is, at which R = K[S]t/2. For the case of homogeneous antibody (ie, a single affinity), simple algebraic manipulation,20 substituting K[S]t/2 (ie, R0/2) for B/F in Equation 8, will show that at this midpoint††

and

so that the total concentration, T, is

Thus, if one plots B/F versus F, the midpoint directly yields 1/K. However, it is frequently more convenient experimentally to plot B/F versus T. In this case, the midpoint is no longer simply the reciprocal of the affinity. As seen from Equation 23, the assumption that the midpoint is 1/K will result in an error equal to half the antibody-binding site concentration. Thus, in plots of B/F versus T, the midpoint will be a good estimate of the affinity only if [S]t/2 << 1/K, that is, if the antibody concentration is low compared to the dissociation constant. In fact, if the affinity is so high that 1/K << [S]t/2, then one will merely be measuring the antibody concentration, not the affinity at all20 (see Fig. 7.6).
In the case of a heterogeneous antiserum, we have already seen that

Therefore, at the midpoint, when B/F = R0/2, it is easy to see that

Thus, one can still obtain the average affinity, as defined previously.20
Regardless of average affinities, the effect of affinity heterogeneity is to broaden the curve or to make the slope shallower. This can be seen by visualizing the curve of B/F versus F as a step function. Each antibody subpopulation of a given affinity, Ki, will be titrated to 50% of its microscopic B/F at a free ligand concentration F = 1/Ki. The high-affinity antibodies will be titrated at low F, but the low-affinity antibodies will require much higher F to be titrated. The resulting step function is analogous to the successive transitions corresponding to different pK values in a pH titration.
Intrinsic Affinity
The affinity, KA, that we have been discussing so far is what has been termed the intrinsic affinity, that is, the affinity of each antibody-combining site treated in isolation. We have been able to do this, regardless of the valence of the antibodies, by using the concentration of combining sites, [S], in our equations rather than the concentration of antibody molecules, [A], which may have more than one site. Even without any cooperativity between combining sites, there is a statistical effect that makes the actual affinity different from the intrinsic affinity if the antibody is multivalent and one uses whole antibody concentration rather than site concentration. The way this difference arises can best be seen by examining the case of a bivalent antibody, such as IgG. We assume that the two sites are equivalent and neither is affected by events at the other. The ligand, as in this whole section, is monovalent. Then there are two binding steps

and the corresponding actual affinities are

If the intrinsic affinity of both equivalent sites is K, then K1 will actually be twice K because the concentration of available sites [S] will be twice the antibody concentration when the first ligand is about to bind in step 1. However,
once one site is bound, the reverse (dissociation) reaction of step 1 can occur from only one site, namely, that which is occupied. Conversely, for the second step, the forward reaction has only one remaining available site; however, in the reverse reaction, AL2 → AL + L, either site can dissociate to go back to the AL state. The second site bound need not be the first to dissociate, and because the sites are identical, one cannot tell the difference. Thus, for step 2, the apparent concentration of sites for the reverse reaction is twice that available for the forward reaction, so the affinity K2 for the second step will be only half the intrinsic affinity, K.
once one site is bound, the reverse (dissociation) reaction of step 1 can occur from only one site, namely, that which is occupied. Conversely, for the second step, the forward reaction has only one remaining available site; however, in the reverse reaction, AL2 → AL + L, either site can dissociate to go back to the AL state. The second site bound need not be the first to dissociate, and because the sites are identical, one cannot tell the difference. Thus, for step 2, the apparent concentration of sites for the reverse reaction is twice that available for the forward reaction, so the affinity K2 for the second step will be only half the intrinsic affinity, K.
It is easy to see how this statistical effect can be extrapolated to an antibody with n sites29:

For the steps in between, two derivations are available,9,29 which yield

The actual affinity, rather than the intrinsic affinity, becomes important with monovalent ligands when one is interested in the effective affinity (based on a molar antibody concentration) under conditions where [L] is so low that only one site can bind antigen. Then for IgG or IgM (with 2 or 10 sites per molecule, respectively), the apparent affinity will be theoretically 2 or 10 times the intrinsic affinity. For most purposes, it is easier to use site concentrations and intrinsic affinities. The analyses given previously, such as B/F versus F or the Scatchard plot, whether B/F versus B or r/c versus r, will all yield intrinsic affinities. It is the intrinsic affinity that tells us something about the nature of the antibody-ligand interaction.
Once one enters the realm of multivalent ligands, the actual affinity or effective affinity involving multipoint binding between multivalent antibody molecule and multivalent ligand molecule can be much greater than the intrinsic affinity for binding at each site. This case is the subject of the next section.
Interaction with Multivalent Ligands
So far, we have discussed only situations in which the ligand is monovalent or effectively monovalent with respect to the particular antibody under study. However, in many situations, the ligand molecule has multiple repeating identical determinants, each of which can bind independently to the several identical combining sites on a divalent or multivalent antibody.‡‡ Although the intrinsic affinity for the interaction of any single antibody-combining site with any single antigenic determinant may be the same as that discussed in the preceding section, the apparent or effective affinity may be much higher due to the ability of a single antibody molecule to bind more than one identical determinant of a multivalent antigen molecule. Karush30 has termed this phenomenon “monogamous bivalency.” Such monogamous binding can occur between two molecules in solution, or between a molecule in solution and one on a solid surface, such as a cell membrane or microtiter plate. We first discuss the situation in solution and then discuss the additional considerations that apply when one of the reactants is bound to a solid surface.
Monogamous Bivalency
Suppose a divalent antibody molecule reacts with antigen that has two identical determinants. This situation has been treated in detail by Crothers and Metzger,31 and by Karush.30 Let us call the two antibody sites S and S′, and the antigenic determinants D and D′, with the understanding that, in actuality, we cannot distinguish S from S′ or D from D′. The interaction can be broken up into two steps, a bimolecular reaction

followed by an intramolecular reaction

The association constant for the first step, K1, is related to the intrinsic affinity, K, simply by a statistical factor of 4 due to the degeneracy (equivalence) between S and S′ and between D and D′. This is a typical second-order reaction between antigen and antibody. However, the second step (Equation 30) is a first-order reaction because it is effectively an interconversion between two states of a single molecular complex, the reactants S′ and D′ being linked chemically (albeit noncovalently) through the S-D bond formed in the first step. Thus, the first-order equilibrium constant, K2, is not a function of the concentrations of S-S and D-D in solution, as K1 would be. Rather, the forward reaction depends on the geometry of the complex and the flexibility of the arms; in other words, the probability that S′ and D′ will encounter each other and be in the right orientation to react if they do come in contact depends on the distances and freedom of motion along the chain S′-S-D-D′ rather than on the density of molecules in solution (ie, concentration).
The reverse reaction for step 2, on the other hand, will have a rate constant similar to that for the simple monovalent S-D → S + D reaction, as the dissociation reaction depends on the strength of the S′-D′ (or S-D) bond and is not influenced by the other S-D interaction unless there is strain introduced by the angles required for simultaneous bonds between S and D and S′ and D′. Note that K2 will inherently have a statistical factor of 1/2 compared to the intrinsic K′2 for the analogous reaction if the S′-S-D-D′ link were all covalent because in the forward reaction of Equation 30 only one pair can react, whereas in the reverse reaction either S′-D′ or S-D could dissociate to produce the equivalent result.
We would like to know the apparent or observed affinity for the overall reaction

Because the free energies, ΔF1 and ΔF2, for the two steps are additive, the observed affinity will be the product of K1 and K2

where we have defined K1 and K2 to include the statistical degeneracy factors.*** The equilibrium constants K1 and K2 are each the ratios of forward and reverse rate constants, as in Equation 7. Of these four rate constants, all are directly related to the corresponding terms for the intrinsic affinity between S and D except for the intramolecular forward reaction of step 2, as noted previously. Thus, the difficulty in predicting Kobs is largely a problem of analyzing the geometric (steric) aspects of K2, assuming one already knows the intrinsic affinity, Crothers and Metzger31 have analyzed this problem for particular situations. Qualitatively, we can say that whether K2 will be larger or smaller than K will depend on factors such as the enforced proximity of S′ and D′ in step 2 and the distance between D and D′ compared to the possible distances accessible between S and S′, which in turn depends on the length of the antibody arms and the flexibility of the hinge between them. Thus, because K1 can be approximated by K, except for statistical factors, the apparent affinity for this “monogamous bivalent” binding interaction, Kobs, may range from significantly less than to significantly greater than K2. If K2 is of the same order of magnitude as K, then Kobs will be of the order of K2, which can be huge (eg, if K ≈ 109 M-1, Kobs could be ≈1018 M-1). The halftime for dissociation would be thousands of years. It is easy to see how such monogamous bivalent interactions can appear to be irreversible, even though in practice the observed affinity is rarely more than a few orders of magnitude larger than the K for a single site, possibly due to structural constraints.32
If apparent affinities this high can be reached by monogamous bivalency, even greater ones should be possible for the multipoint binding of an IgM molecule to a multivalent ligand. Although IgM is decavalent for small monovalent ligands, steric restrictions often make it behave as if pentavalent for binding to large multivalent ligands. However, even five-point binding can lead to enormously tight interactions. Therefore, even though the intrinsic affinity of IgM molecules tends to be lower than that of IgG molecules for the same antigen,30 the apparent affinity of IgM can be quite high.
Two-Phase Systems
The same enhanced affinity seen for multipoint binding applies to two-phase systems. Examples include the reaction of multivalent antibodies with antigen attached to a cell surface or an artificial surface (such as Sepharose or the plastic walls of a microtiter plate), the reaction of a multivalent ligand with antibodies on the surface of a B cell, a Sepharose bead, or a plastic plate, and the reaction of either component with an antigen-antibody precipitate. For the reasons outlined previously, “monogamous” binding can make the apparent affinity of a multivalent antibody or antigen for multiple sites on a solid surface be quite large to the point of effective irreversibility.
However, another effect also increases the effective affinity in a two-phase system. This effect applies even for monovalent antibodies (Fab fragments) or monovalent ligands. The effect arises from the enormously high effective local concentration of binding sites at the surface, compared to the concentration if the same number of sites were distributed in bulk solution.33 Looked at another way, the effect is due to the violation, at the liquid-solid interface, of the basic assumption in the association constants, KA, discussed previously, that the reactants are all distributed randomly in the solution. (To some extent, the latter is involved in the enhanced affinity of multivalency as well.) This situation has been analyzed by DeLisi34 and DeLisi and Wiegel,35 who break the reaction down into two steps: the diffusive process necessary to bring the antigen and antibody into the right proximity and orientation to react, and the reactive process itself. The complex between antigen and antibody, when positioned but not yet reacted, is called the encounter complex. The reaction can then be written

where S = antibody site, D = antigenic determinant, k+ and k_ = forward and reverse diffusive rate constants, and k1 and k_1 = forward and reverse reactive rate constants once the encounter complex is formed. If the encounter complex is in a steady state, the overall rate constants will be given by


where subscripts f and r = forward and reverse.34 The association constant, according to Equation 7, is the ratio of these two, or

The relative magnitudes of k1 and k_ determine the probable fate of the encounter complex. Is it more likely to react to form SD or to break up as the reactants diffuse apart?
Now suppose that k is slow compared to k1. Then the SD bound complex and the encounter complex, S … D, may interconvert many times before the encounter complex breaks up and one of the reactants diffuses off into bulk solution. If the surface has multiple antigenic sites, D, then even a monovalent antibody (Fab) may be much
more likely, when SD dissociates to S … D, to rereact with the same or nearby sites than to diffuse away into bulk solution, again depending on the relative magnitudes of these rate constants. This greater probability to rereact with the surface rather than diffuse away is the essence of the effect we are describing. A more extensive mathematical treatment of reactions with cells is given in DeLisi34 and DeLisi and Wiegel.35
more likely, when SD dissociates to S … D, to rereact with the same or nearby sites than to diffuse away into bulk solution, again depending on the relative magnitudes of these rate constants. This greater probability to rereact with the surface rather than diffuse away is the essence of the effect we are describing. A more extensive mathematical treatment of reactions with cells is given in DeLisi34 and DeLisi and Wiegel.35
A somewhat different, and very useful, analysis of the same or a very similar effect was given by Silhavy et al.36 These authors studied the case of a ligand diffusing out of a dialysis bag containing a protein for which the ligand had a significant affinity. Once the ligand concentration became low enough that there was an excess of free protein sites, then the rate of exit of ligand from the dialysis bag was no longer simply its diffusion rate nor was it simply the rate of dissociation of protein-ligand complex. These authors showed that under these conditions the exit of ligand followed quasi-first-order kinetics, but with a half-life longer than the half-life in the absence of protein by a factor of (1 + [P]KA)

where [P] = protein site concentration, KA = affinity, and t+ and t_ = half-lives in the presence and absence of protein in the bag.
In this case, the protein was in solution, so the authors could use the actual protein concentration and the actual intrinsic affinity, KA. In the case of protein on a two-dimensional surface, it is harder to know what to use as the effective concentration. However, the high local concentration of protein compartmentalized in the dialysis bag can be seen to be analogous to the high local concentration attached to the solid surface. The underlying mechanism of the two effects is essentially the same and so are the implications. For instance, in the case of dialysis, a modest 10 µM concentration of antibody sites with an affinity of 108 M-1 can reduce the rate of exit of a ligand 1000-fold. A dialysis that would otherwise take 3 hours would take 4 months. It is easy to see how this “retention effect” can make even modest affinities appear infinite (ie, the reactions appear irreversible). This retention effect applies not only to immunologic systems but also to other interactions at a cell surface or between cell compartments where the local concentration of a protein may be high. In particular, these principles of two-phase systems should also govern the interaction between antigen specific receptors on the surface of T cells and antigen-major histocompatibility complex (MHC) molecule complexes on the surface of antigen-presenting cells, B cells, or target cells.
One final point is useful to note. Because these retention effects depend on a localized abundance of unoccupied sites, addition of a large excess of unlabeled ligand to saturate these sites will diminish or abolish the retention effect and greatly accelerate the dissociation or exit of labeled ligand. This effect of unlabeled ligand can be used as a test for the retention effect, although one must be aware that in certain cases the same result can be an indication of negative cooperativity among receptor sites.
RADIOIMMUNOASSAY AND RELATED METHODS
Since it was first suggested in 1960 by Yalow and Berson,37 RIA has rapidly become one of the most widespread, widely applicable, and most sensitive techniques for assessing the concentration of a whole host of biologic molecules. Most of the basic principles necessary to understand and apply RIA have been covered previously in this chapter. In this section, we examine the concepts and methodologic approaches used in RIA. For a detailed methods book, we refer the reader to Chard,38 Rodbard,39 and Yalow.40
The central concept of RIA is that the binding of an infinitesimal concentration of highly radioactive tracer antigen to low concentrations of a high-affinity-specific antibody is very sensitive to competition by unlabeled antigen and is also very specific for that antigen. Thus, concentrations of antigen in unknown samples can be determined by their ability to compete with tracer for binding to antibody. The method can be used to measure very low concentrations of a molecule, even in the presence of the many impurities in biologic fluids. Accomplishment of this requires an appropriate high-affinity antibody and radiolabeled antigen, a method to distinguish bound from free-labeled antigen, optimization of concentrations of antibody and tracer-labeled antigen to maximize sensitivity, and generation of a standard curve, using known concentrations of competing unlabeled antigen, from which to read off the concentrations in unknown samples as well as the best method for representing the data. We review all these steps and pitfalls in this procedure except the preparation of antibodies and labeled antigens.
Separation of Bound and Free Antigen
Whatever parameter one uses to assess the amount of competition by the unlabeled antigen in the unknown sample to be tested, it will always be a function of bound versus free, radiolabeled antigen. Therefore, one of the most critical technical requirements is the ability to distinguish clearly between antibody-bound radioactive tracer and free radioactive tracer. This distinction usually requires physical separation of bound and free ligand. If the bound fraction is contaminated by free ligand, or vice versa, enormous errors can result, depending on the part of the binding curve on which the data fall.
Solution Methods
Solution RIA methods have the advantage that binding can be related to the intrinsic affinity of the antibody. However, bound and free antigen must be separated by a method that does not perturb the equilibrium. Three basic types of approaches have been used: precipitate the antibody with bound antigen, leaving free antigen in solution; precipitate the free antigen, leaving antibody and bound antigen in solution; or separate free from antibody-bound antigen molecules in solution on the basis of size by gel filtration. This last method is too cumbersome to use for large numbers of samples and is too slow, in general, to be sure the equilibrium is not perturbed in the process. Therefore, gel filtration columns are not widely used for RIA. Methods that precipitate antibody are perhaps the most widely used. If the antigen is sufficiently smaller (<30,000 MW) than the antibody that it will remain in solution at
concentrations of either ammonium sulfate41 or polyethylene glycol, 6000 MW (10% W:W),42 which will precipitate essentially all the antibody, then these two reagents are frequently the most useful. Precipitation with polyethylene glycol and centrifugation can be accomplished before any significant dissociation has occurred due to dilutional effects.43 However, if the antigen is much larger than about 30,000 to 40,000 MW, these methods will produce unacceptably high background control values in the absence of specific antibody. If the antibody is primarily of a subclass of IgG that binds to staphylococcal protein A or G, one can take advantage of the high affinity of protein A or G for IgG by using either protein A (or G)-Sepharose or formalinkilled staphylococcal organisms (Cowan I strain) to precipitate the antibody.44 Finally, one can precipitate the antibody using a specific second antibody, an anti-Ig raised in another species. Maximal precipitation occurs not at antibody excess but at the “point of equivalence” in the middle of the titration curve where antigen (in this case, the first antibody) and the (second) antibody are approximately equal in concentration. Thus, one must add carrier Ig to keep the Ig concentration constant and determine the point of equivalence by titrating with the second antibody. Even worse, the precipitin reaction is much slower than the antigen-antibody reaction itself, allowing reequilibration of the antigen-antibody interaction after dilution by the second antibody. Some of these problems can be reduced by enhancing precipitation with low concentrations of polyethylene glycol.
concentrations of either ammonium sulfate41 or polyethylene glycol, 6000 MW (10% W:W),42 which will precipitate essentially all the antibody, then these two reagents are frequently the most useful. Precipitation with polyethylene glycol and centrifugation can be accomplished before any significant dissociation has occurred due to dilutional effects.43 However, if the antigen is much larger than about 30,000 to 40,000 MW, these methods will produce unacceptably high background control values in the absence of specific antibody. If the antibody is primarily of a subclass of IgG that binds to staphylococcal protein A or G, one can take advantage of the high affinity of protein A or G for IgG by using either protein A (or G)-Sepharose or formalinkilled staphylococcal organisms (Cowan I strain) to precipitate the antibody.44 Finally, one can precipitate the antibody using a specific second antibody, an anti-Ig raised in another species. Maximal precipitation occurs not at antibody excess but at the “point of equivalence” in the middle of the titration curve where antigen (in this case, the first antibody) and the (second) antibody are approximately equal in concentration. Thus, one must add carrier Ig to keep the Ig concentration constant and determine the point of equivalence by titrating with the second antibody. Even worse, the precipitin reaction is much slower than the antigen-antibody reaction itself, allowing reequilibration of the antigen-antibody interaction after dilution by the second antibody. Some of these problems can be reduced by enhancing precipitation with low concentrations of polyethylene glycol.
The other type of separation method is adsorption of free antigen to an agent, such as activated charcoal or talc, which leaves antigen bound to antibody in solution. Binding of antigen by these agents depends on size and hydrophobicity. Although these methods are inexpensive and rapid, they require careful adjustment and monitoring of pH, ionic strength, and temperature to obtain reproducible results and to avoid adsorption of the antigen-antibody complex. Furthermore, because these agents have a high affinity for antigen, they can compete with a low-affinity antibody and alter the equilibrium. Also, as charcoal quenches beta scintillation counting, it can be used only with gamma-emitting isotopes such as 125I.
Solid-Phase Methods
Solid-phase RIA methods have the advantages of high throughput and increased apparent affinity due to the effects at the solid-liquid interface noted previously. However, they have the concomitant disadvantage that one is not measuring the true intrinsic affinity because of these same effects. The method itself is fairly simple. One binds the antibody in advance to a solid surface such as a Sepharose bead or the walls of a microtiter plate well. To avoid competition from other serum proteins for the solid phase, one must use purified antibody in this coating step. Once the wells (or Sepharose beads) are coated, one can incubate them with labeled tracer antigen with or without unlabeled competitor, wash and count directly the radioactivity bound to the plastic wells or to the Sepharose. The microtiter plate method is particularly useful for processing large numbers of samples. However, because the concentration, or even the amount, of antibody coating the surface is unknown and because the affinity is not the intrinsic affinity, one cannot use these methods for studying the chemistry of the antigen-antibody reaction itself. A detailed analysis of the optimum parameters in this method is given by Zollinger et al.43
A variation that does allow determination of affinity, based on the enzyme-linked immunosorbant assay (ELISA) described in the following, but equally applicable to RIA, was described by Friguet et al.45 This uses antigen-coated microtiter wells and free antibody but measures competition by free antigen to prevent the antibody in solution from binding to the antibody on the plate (see Fig. 7.9B). Thus, the antibody bound to the plastic is antibody that was free in the solution equilibrium. The affinity measured is that between the antibody and antigen in solution, not that on the plastic, so it is not directly influenced by the multivalency of the surface. However, as pointed out by Stevens,46 the determination of affinity is strictly accurate only for monovalent Fab fragments because a bivalent antibody with only one arm bound to the plastic and one bound by antigen in solution will still be counted as free. Therefore, there will be an underestimate of the ligand occupancy of the antibody combining sites and thus an underestimate of affinity. Stevens also points out a method to correct for this error based on binomial analysis. Subsequently, Seligman47 showed that the nature and density of the antigen on the solid surface can also influence the estimate of affinity.
Optimization of Antibody and Tracer Concentrations for Sensitivity
The primary limitations on the sensitivity of the assay are the antibody affinity and concentration, the tracer concentration, and the precision (reproducibility) of the data. In general, the higher the affinity of the antibody, the more sensitive the assay can be made. Once one prepares the highest affinity antibody available, this parameter limits the extent to which the other parameters can be manipulated. For instance, because the unlabeled antigen in the unknown sample is going to compete against labeled tracer antigen, the lower the tracer concentration, the lower the concentration of the unknown sample, which can be measured up to a point. That point is determined by the affinity, KA, as can be seen from the theoretical considerations discussed previously.38 The steepest part of the titration curve will occur in the range of concentrations around 1/KA. Concentrations of ligand much below 1/KA will leave most of the antibody sites unoccupied so that competition will be less effective. Thus, there is no value in reducing the tracer concentration more than a few-fold lower than 1/KA. Therefore, although it is generally useful to increase the specific radioactivity of the tracer and reduce its concentration, it is important to be aware of this limit of 1/KA. Increasing the specific activity more than necessary can result in denaturation of antigen.
Similarly, lowering the antibody concentration will also increase sensitivity, up to a point. This limit also depends on 1/KA and on the background “nonspecific binding.” Decreasing the antibody concentration to the point that binding of tracer is too close to background will result in
loss of sensitivity due to loss of precision. In general, the fraction of tracer bound in the absence of competitor should be kept greater than 0.2, and in general closer to 0.5.48
loss of sensitivity due to loss of precision. In general, the fraction of tracer bound in the absence of competitor should be kept greater than 0.2, and in general closer to 0.5.48
A convenient procedure to follow to optimize tracer and antibody concentrations is first to choose the lowest tracer concentration that results in convenient counting times and counting precision for bound values of only one-half to onetenth the total tracer. Then, keeping this tracer concentration constant, one dilutes out the antibody until the bound/free antigen ratio is close to 1.0 (bound/total = 0.5) in the absence of competitor. This antibody concentration in conjunction with this tracer concentration will generally give near-optimal sensitivities, within the limits noted previously. It is important to be aware that changing the tracer concentration will require readjusting the antibody concentration to optimize sensitivity.
Analysis of Data: Graphic and Numerical Representation
We have already examined the Scatchard plot (bound/free versus bound) and the plot of bound/free versus free or total antigen concentration as methods of determining affinity. The latter lends itself particularly to the type of competition curves that constitute an RIA. In fact, the independent variable must always be antigen concentration, as that is the known quantity one varies to generate the standard curve. Let us use B, F, and T to represent the concentrations of bound, free, and total antigen, respectively. We have seen that the plot of B/F versus F is more useful for determining the affinity, KA, than the plot of B/F versus T. However, in RIA, the quantity one wants to determine is T, and correspondingly, the known independent variable in generating the standard curve is T. Another difference between the situation in RIA and that discussed previously is that, in RIA, one has both labeled and unlabeled antigen. The dependent variable, such as B/F, is the ratio of bound tracer over free tracer, as only radioactive antigen is counted. The B/F for the unlabeled antigen will be the same at equilibrium, assuming that labeled and unlabeled antigen bind the antibody equivalently, that is, with the same KA. This assumption is not always valid and requires experimental testing.
The sigmoidal shape of B/F versus F or T, when F or T (the “dose”) is plotted on a log scale, has been seen in Figure 7.6. The shape for B/T versus F or T would be similar. Note that because B + F = T,

and

These transformations can be useful. If one plots B/F or B/T versus F or T on a linear scale, then the shape is approximately hyperbolic, as in Figure 7.7. The plot of B/F versus T (log scale) was one of the first methods used to plot RIA data and is still among the most useful. The most sensitive part of the curve is the part with the steepest slope.
It has been shown by probability analysis that if the antigen has multiple determinants, each capable of binding antibody molecules simultaneously and independently of one another, then the more such determinants capable of being recognized by the antibodies in use, the steeper will be the slope.49 This effect of multideterminant binding on steepness arises because, in RIA, an antigen molecule is scored as bound whether it has one antibody molecule attached or several. It is scored as free only if no antibody molecules are attached. Thus, the probability that an antigen molecule is scored as free is the product of the probabilities that each of its determinants is free. The effect can lead to quite steep slopes and has been confirmed experimentally.49
Stay updated, free articles. Join our Telegram channel

Full access? Get Clinical Tree


