66.1
Introduction
Osteoporosis is defined as a state of reduced bone mass and bone strength which leads to a higher than normal risk of fracture . This results in a higher number of all fracture types, both high energy and low energy fractures, though the latter will typically lead to suspicion of osteoporosis . Integration of clinical risk factors and measurements such as bone mineral density (BMD) into a reliable estimate of the likelihood of fracture is important for decision-making both at the societal level and for the individual patient. Intuitively, it makes more sense to intervene in patients at high absolute risk than in patients whose risk of fracture is low and such an approach is also favorable in terms of health economics.
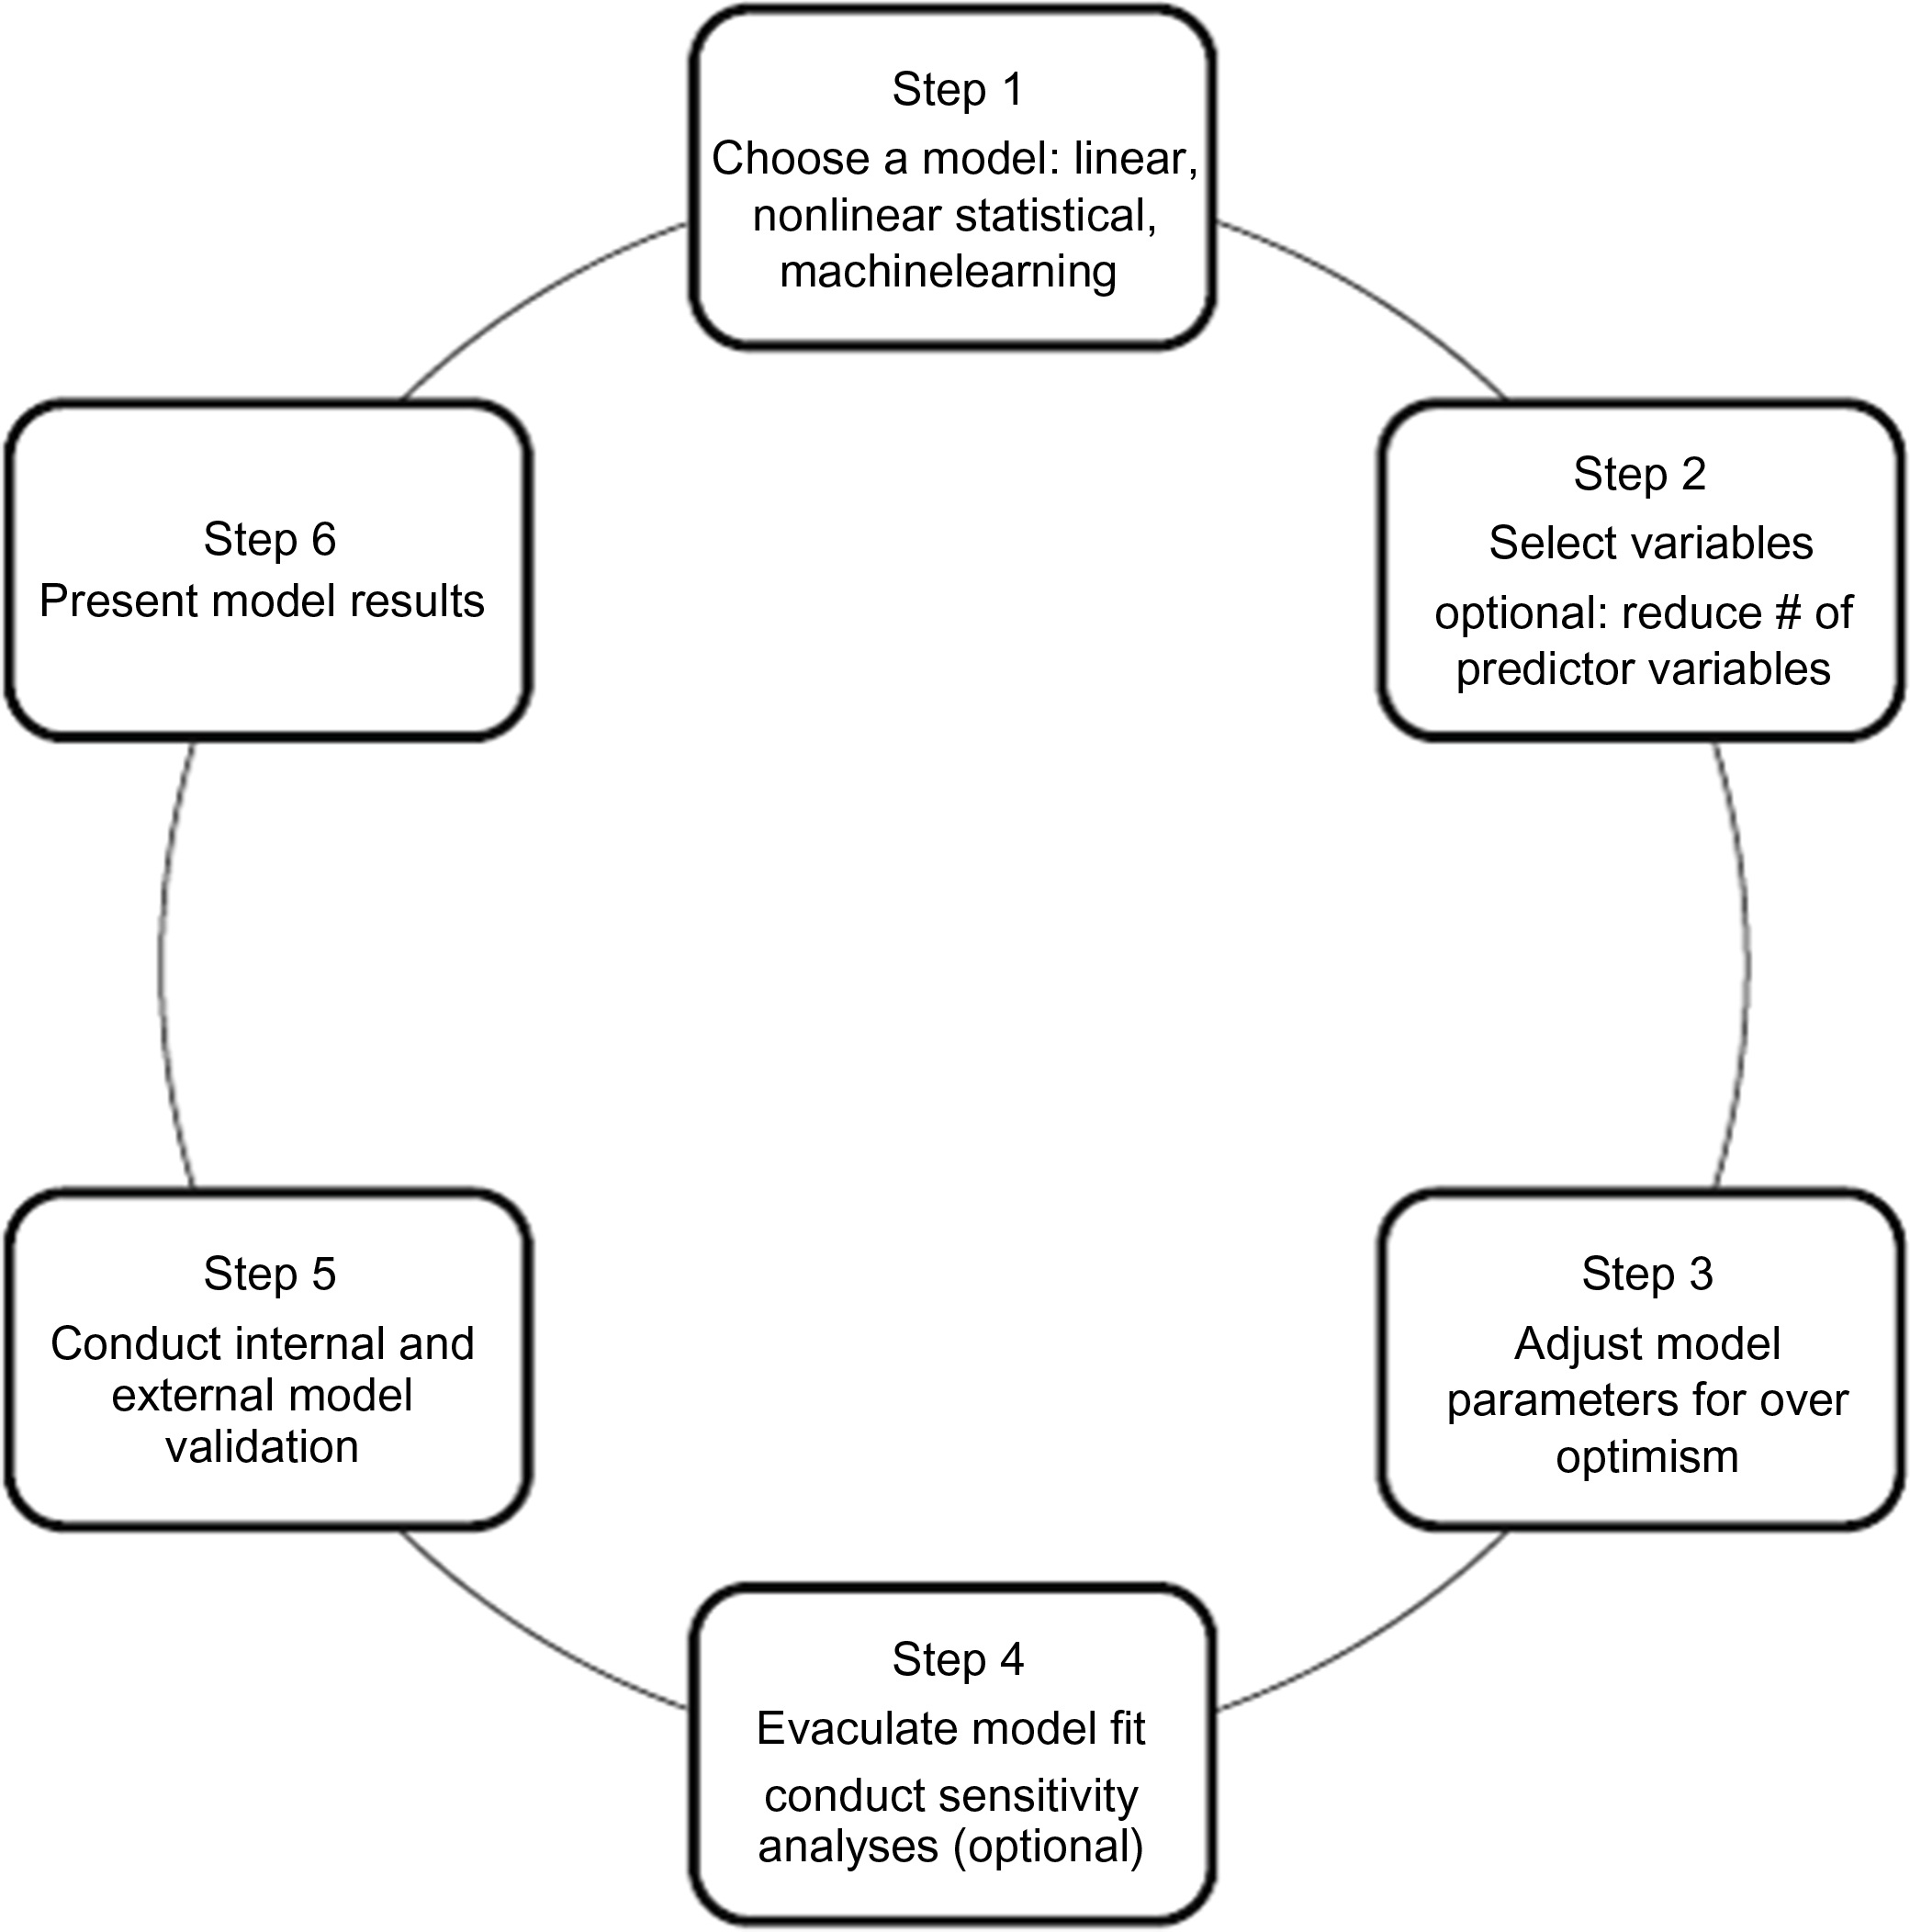
Tools to estimate the risk of fracture, as opposed to screening for osteoporosis which is covered in Chapter 62 , Who should be screened for osteoporosis?, have been around for almost two decades . Fig. 66.1 identifies the major steps in the development and validation of these risk estimates. The ideal fracture risk assessment tool should be accurate, reproducible, simple, and intuitive to use, exhibit validity—discrimination with appropriate calibration in diverse populations—and lend itself to variable time scenarios and fracture types. Discrimination (the model’s ability to distinguish between individuals who do or do not experience the event of interest) and calibration (agreement between observed and predicted event rates for groups of individuals) are key aspects of predictive performance of risk algorithms . The ideal tool should also detect and report changes in risk attributable to lifestyle interventions or use of drugs with antifracture efficacy. In other words, it should be accurate both in terms of the onset and offset of treatment effects. To date, no fracture prediction tool satisfies all of these criteria.
There is a law of diminishing returns in terms of the incremental value of adding further predictors to a risk algorithm once it has moved beyond a certain level of complexity. The point at which this happens depends in part on the degree to which individual variables provide similar or incremental risk information. Where a tool is derived from several cohorts, such as FRAX described later, the maximum complexity also becomes limited by the extent to which a variable is registered in all cohort (e.g., femoral neck BMD) or only in some of the contributing cohorts (e.g., falling or spine BMD). Algorithms may be designed for self-scoring by patients or they can be designed to use data stored in administrative databases or electronic patient records, where a complex algorithm may be no more difficult or time consuming to implement than a simple one. Machine learning can train algorithms efficiently from large and complex data, though continuous variables such as age, BMD, or number of fall episodes generally result in a better performing algorithms than when clinical risk factors are represented as binary information .
A fundamental premise of clinical risk assessment tools is that prediction based upon multiple risk factors is more accurate than prediction based upon a single risk factor, including BMD, which is consistent with the available data . Of course, the objective is to enhance decision making, not replace clinical judgment. It is important to remember situations where a single risk factor may be of overwhelming importance, such as individuals with overt osteoporotic fractures (e.g., low-trauma hip or vertebral).
66.2
Validated fracture risk assessment tools
Many risk assessment tools are available to estimate fracture risk and their performance characteristics vary depending on their unique sets of predictor variables, model construct, and derivation populations . Tools specifically intended to screen for low BMD, as opposed to fracture risk, are not considered in this chapter but have previously been reviewed . Although fracture assessment tools do not stipulate intervention thresholds, they provide objective information about fracture risk of importance to patients, clinicians, and healthcare authorities at the individual and population levels.
The clinical fracture risk assessment tools that have been most studied include FRAX, the QFractureScore, and the Garvan Fracture Risk Calculator; we provide a detailed review of these three tools ( Table 66.1 ). Other models are also available but their uptake has not been as far-reaching because they have not been validated externally, predict only one fracture type, or are restricted to a specific population. For example, using the Women’s Health Initiative (WHI) cohorts of 100,000 women aged 50–70 years, Robbins et al. created a 5-year predictive model for hip fracture. The models were developed using the observational cohorts and validated using the clinical trial participants of the WHI and include the following variables: age, self-reported health, height, change in height since age 18, change in weight since age 35, history of fracture after age 55, race/ethnicity, physical activity, smoking, history of parental fracture after age 40, diabetes treated with medication, and corticosteroid use. The Fracture and Immobilization Score (FRISC) was developed in a hospital-based cohort of Japanese women and externally validated in two small community-based cohorts in Japan and predicts the 1-, 3-, 5-, and 10-year risk of major osteoporosis fracture and of immobilization . The input variables of this tool include age; weight; lumbar spine T -score; and the presence (yes, no) of prior fracture, back pain, dementia, secondary osteoporosis and postmenopausal status. Using data from the Study of Osteoporotic Fractures (SOF; 7782 women aged 65 years and older), the FRACTURE Index, with or without the input of BMD T -scores, was developed by identifying variables that could be easily assessed in either clinical practice or by self-administration . The models were validated as predictors of hip fractures in the French EPIDOS cohort (6679 women aged 75 years and older) and used to assess the 5-year risk of hip and other osteoporotic fractures . This assessment tool comprises a set of seven variables that include age, BMD T -score, fracture after age 50 years, maternal hip fracture after age 50, weight less than or equal to 57 kg, smoking status, and use of arms to stand up from a chair. The Fracture Risk (FRISK) Score was developed to determine 5- and 10-year hip and major osteoporotic fracture (MOF) risk in Australian women aged 60 years and older . FRISK incorporates BMD at the hip and lumbar spine, falls in the previous 12 months, weight, and number of previous fractures.
| Name, URL | Risk factors included in the tool | Tool output | Unique features |
|---|---|---|---|
| FRAX (fracture risk assessment tool) , www.shef.ac.uk/FRAX |
|
|
|
| QFracture-2016 , www.qfracture.org |
|
|
|
| Garvan Fracture Risk Calculator , www.garvan.org.au/bone-fracture-risk |
|
|
|
66.2.1
FRAX®
The fracture risk assessment tool (FRAX) ( http://www.sheffield.ac.uk/FRAX/ ) is a computer-based algorithm that calculates the 10-year probability of a MOF (hip, clinical vertebral, humerus, or forearm fracture) or the 10-year probability of a hip fracture alone in men and postmenopausal women aged 40–90 years . Fracture probability is derived from age, body mass index , and a number of dichotomized clinical risk factors, identified through a series of metaanalyses, including prior fragility fracture , parental history of hip fracture , current tobacco smoking , daily alcohol consumption of 3 or more units per day , ever long-term oral glucocorticoid use, rheumatoid arthritis (RA) , or other secondary causes of osteoporosis . Femoral neck BMD or T -score can be optionally entered to enhance fracture risk prediction; this permits the use of the prediction tool in areas where densitometer availability is scarce or when BMD assessment is not feasible (e.g., residents in long-term care institution) . Since fracture risk over a 10-year time period depends not only on risk factors for fracture (such as BMD) but also on surviving long enough for a fracture to occur, fracture probabilities derived in FRAX also consider death as a competing risk . FRAX is the only fracture assessment tool that considers the risk of death in the calculation of fracture probability. Interactions between clinical risk factors were incorporated in the algorithm.
The relationships between identified risk factors and fracture risk were assessed using individual-level data from nine population-based cohorts (60,000 men and women with 250,000 person-years of follow-up) from Australia, Canada, the United States, Japan, and European countries to determine each clinical risk factor’s predictive importance and potential interactions between these risk factors in the FRAX models. Fracture discrimination and calibration were validated in these initial populations. The models were then externally validated in 11 international population-based cohorts (230,000 men and women with 1.2 million person-years of follow-up) that did not participate in the model synthesis .
The performance characteristics of FRAX for risk stratification and fracture discrimination were assessed as the gradient of risk [the increase in relative risk of fracture per standard deviation (SD) unit change in risk score] and by the area under the receiver operating characteristic curve (AUC) and were found to be comparable between the initial and the validation cohorts . Gradients of risk varied depending on age and predicted fracture site but ranged between 1.4 and 2.1 per SD for clinical risk factors only compared to 1.2–3.7 per SD with BMD only and to 1.4–4.2 per SD when clinical risk factors were combined with BMD. The mean AUC for hip fracture was 0.66 without BMD and 0.74 with BMD, and for major fracture the mean AUC was 0.60 without BMD and 0.62 with the addition of BMD in the model.
Since its launch in 2008, FRAX models have been calibrated and made available in 64 countries, covering more than 80% of the world population. FRAX has been incorporated in more than 100 guideline recommendations in different countries and is available, following approval by the US Food and Drug Administration, on DXA scanners to facilitate fracture probability calculations at the time of BMD measurement .
FRAX tools are calibrated using fracture and mortality epidemiology data for the target population . Ideally, such data should be of high quality and nationally representative. Most countries are able to collect reliable mortality and hip fracture data, since hip fractures usually appear in hospitalization statistics. Nonhip fractures that contribute to MOF (clinical vertebral, humerus, or forearm) are more difficult to accurately ascertain as they usually do not result in hospitalization or surgical intervention. To facilitate the creation of FRAX models for countries without access to high-quality nonhip fracture data, it is often assumed that the ratio of MOF-to-hip fractures will be similar to Sweden . This is a convenient albeit simplified assumption that may not be applicable for all countries, including the United States and Canada, where additional sources of nonhip fracture data were required for the accurate calibration of these FRAX tools . It has previously been noted that differences in how nonhip fracture rates are estimated likely contribute to between-country differences in FRAX calibration for MOF, even where FRAX calibration for hip fracture probability is similar .
FRAX calculators that consider different ethnicities are available for the United States (Caucasian, Black, Hispanic, Asian) and Singapore (Chinese, Malay, Indian). Some of the issues related to ethnicity and the creation of ethnicity-specific calculators have been noted elsewhere . Related concerns have been raised about the use of the Swedish FRAX tool in Swedish immigrants . Although refining fracture probability assessment where there are demonstrable differences in ethnicity-specific fracture rates is appealing, this is not without challenges: “How is ethnicity defined?”, “How many ethnicity-specific calculators are needed and can be supported by high-quality data?”, “Are perceived advantages offset by clinical confusion about which calculator to apply?”, and “What about low-prevalence or mixed ethnicities?” Ultimately, there is no single answer to these complex questions, and it is the local context and sensibilities that inform their discussion.
Many independent validation studies have been carried out using country-specific FRAX models and we review only a few here. In general, the performance of the FRAX tools has been concordant with the initial reports, unless there were concerns with the validating cohort such as small sample sizes, missing data, short-term follow-up, or with the application of the FRAX tool. Most but not all studies have had a predominance of women. In the OLEFY (867 French women) and the MENOS cohorts (2651 French women) the AUC for fracture discrimination for MOF was 0.78 with BMD for both studies . Ettinger et al. examined US FRAX estimates for 10-year hip fracture and MOF from data obtained from MrOS participants (5891 men) and compared to observed 10-year fracture cumulative incidence. Using FRAX without BMD, predicted quintile probabilities closely estimated cumulative incidence of hip fracture (range of observed to predicted ratios 0.9–1.1); when BMD was added in the calculation, there was underestimation of the risk in those in the highest risk quintiles. For MOF, FRAX without BMD slightly overestimated observed cumulative incidence (range of observed to predicted ratios 0.7–0.9) and the addition of BMD did not improve this discrepancy (range of observed to predicted ratios 0.7–1.1). The AUC for hip fracture discrimination was 0.77 and for MOF 0.67 with BMD. In the Hong Kong Osteoporosis Study, a total of 2266 postmenopausal women underwent clinical risk factor and BMD assessment . The AUC for predicting MOF was 0.73 with femoral neck BMD T -scores (whether based on the NHANES database or a Chinese normative database) and for hip fracture 0.88. The FRAX tool for Canada was validated in two independent cohorts: the Canadian Multicenter Osteoporosis study (4778 women and 1919 men) and the Manitoba BMD registry (36,730 women and 2873 men) . The AUC for MOF was 0.69 with BMD for both cohorts and for hip fracture ranged from 0.80 to 0.83 with BMD. Predicted versus observed fractures were well aligned for hip and MOF. Rubin et al. performed a registry linkage study of 3636 Danish women . Using the Swedish version of FRAX, the predicted 10-year fracture risk was 7.6%, ranging from 0.3% to 25.0% at the age of 41–50 and 81–90, respectively, while the corresponding observed fracture risk was 7.6%, ranging from 0.4 to 24.0%, respectively, and not significantly different from the predicted risk.
A few simplified country-specific fracture prediction tools, based on the FRAX algorithms, have developed. They include the Foundation for Research and Education fracture risk calculator (FORE FRC, www.riskcalculator.fore.org ) and the Canadian Association of Radiologists and Osteoporosis Canada (CAROC, www.osteoporosis.ca/multimedia/pdf/CAROC.pdf ). The FORE 10-year Fracture Risk Calculator Fracture risk closely aligns with the US FRAX in that it uses the same input variables (including femoral neck and lumbar spine T -scores) with fixed relative risks; however, it does not incorporate interactions nor the competing mortality risk, and it estimates the 10-year risk of hip or MOF in men, women, and four ethnic groups . The AUC was for hip fracture prediction was 0.83 without BMD and 0.85 with BMD included in the model. CAROC is a simplified, semiquantitative adaptation of the Canadian FRAX tool and estimates the 10-year MOF risk in men and women, 50 years and older, and provides this output in three categories of risk: low (less than 10%), moderate (10%–20%), or high (above 20%) . Using the Canadian Multicentre Osteoporosis Study (CaMos) and the Manitoba BMD Registry cohorts, the CAROC tool demonstrated high concordance with the Canadian FRAX tool for risk category in both cohorts (89% and 88%). Ten-year fracture outcomes in cohorts showed good discrimination and calibration for both CAROC (6.1%–6.5% in low-risk, 13.5%–14.6% in moderate-risk, and 22.3%–29.1% in high-risk individuals) and FRAX (6.1%–6.6% in low-risk, 14.4%–16.1% in moderate-risk, and 23.4%–31.0% in high-risk individuals).
Although FRAX has shown to be a robust assessment tool, some limitations to its use require mention. FRAX does not consider dose–responsein the clinical risk factors; examples include number of previous fractures, skeletal site of fracture (vertebral vs nonvertebral sites), and oral glucocorticoid use (low, moderate, and high doses). Other perceived limitations include that FRAX uses femoral neck BMD but does not incorporate lumbar spine BMD (which can be of clinical importance when there is a large discrepancy between the T -scores at the femoral neck and the lumbar spine), and the models do not incorporate fall history , measures of hip geometry , or the presence of type 2 diabetes (T2D) . To provide guidance in these instances, application of arithmetic adjustments to the FRAX estimates have been suggested, as described later.
66.2.2
QFracture
QFracture ( http://www.qfracture.org ) was developed in 2009 (updated in 2012 and in 2016) based on large primary care populations in the United Kingdom . The algorithm is based on variables that are readily available and routinely collected in electronic healthcare records. It estimates an individual’s 1- to 10-year risk of developing a hip or MOF (including hip, proximal humerus, spine, and distal forearm), without BMD measurement. It is applicable to people aged 30–85 years.
The clinical risk factors included in the QFracture algorithms are age, sex, ethnicity (10 different backgrounds), BMI, history of prior MOF, parental history of hip fracture or osteoporosis, nursing or care home residence, smoking status (nonsmoker, former smoker, current light, moderate or heavy smoker), alcohol intake (five categories), asthma/COPD, cardiovascular disease, chronic liver or kidney disease, dementia, Parkinson’s disease, RA or systemic lupus erythematosus, epilepsy, diabetes, gastrointestinal malabsorption (such as inflammatory bowel disease, gluten enteropathy), history of falls, endocrine disorders (hyperparathyroidism, hyperthyroidism), and use of glucocorticoids or antidepressants. In women hormone replacement therapy is also considered.
QFracture (2009 version) was developed using the large UK primary care electronic QResearch database (3.7 million people with 25 million person-years of follow-up) and externally validated using adults registered in UK general practices contributing to The Health Improvement Network (THIN) clinical research databases (2.2 million people with 13 million person-years of follow-up) . Discrimination and calibration statistics were comparable to those reported in the internal validation of QFracture for both sexes. (AUC was 0.82 in women and 0.74 in men for MOF, and 0.89 in women and 0.86 in men for hip fracture). The algorithms were updated in 2012 and validated in the initial cohorts; they were associated with similar AUC for the 10-year prediction of major fracture (AUC 0.79 in women and 0.71 in men) and hip fracture (AUC 0.89 in women and 0.88 in men) .
In an independent study including 246 women (aged 50–85 years) with a recent fracture and 338 controls without fractures from six centers in the United Kingdom and Ireland, the QFracture algorithms performance was less than in the initial validation studies in MOF (AUC 0.67) and hip fracture (AUC 0.64) discrimination, possibly because the latter included such a wide age distribution .
Although the QFracture tool provides dose–response for certain variables such as cigarette smoking and alcohol intake, it does not include BMD as an input variable and does not consider mortality as a competing risk. It also has not been calibrated to the epidemiology of other countries and therefore is only directly applicable to the UK population.
66.2.3
Garvan fracture risk calculator
The Garvan tool ( http://www.garvan.org.au/bone-fracture-risk ) is based on data collected over 15 years of follow-up of the 2500 men and women, 60 years and older, participants of the Australian Dubbo Osteoporosis Epidemiology Study (DOES) initiated in 1989 . It predicts the 5- or 10-year risk of any osteoporotic fracture (including hip, clinical vertebral, wrist, metacarpal, humerus, scapula, clavicle, distal femur, patella, proximal tibia, pelvis, and sternum) and of hip fracture using validated sex-specific nomograms. It is applicable to individuals over age 50 years.
The input variables for this tool are the following: age, sex, number of low trauma fracture since age 50 (categorized as 0, 1, 2, >2), number of falls in the previous 12 months (categorized as 0, 1, 2, >2), femoral neck BMD or T -score, or body weight if BMD is not available. Bayesian model averaging was applied to determine the most parsimonious models with maximum discriminatory power. The selected models’ performance in fracture discrimination (with BMD) assessed by the AUC in the derivation cohort was 0.85 for both sexes for hip fracture, as compared to 0.78 (women) and 0.80 (men) with BMD only, and 0.75 for any osteoporotic fractures for both sexes, as compared to 0.67 (women) and 0.66 (men) with BMD only. Akin to QFracture, the Garvan Fracture Risk Calculator is only directly calibrated to the population from which it was derived (Australian) and does not consider competing mortality risk. It does, however, include in a dose–response fashion fall history and number of low trauma fractures after age 50.
The Garvan tool has been externally and independently validated using the CaMos which included 4152 women and 1606 men aged 55–95 years . For low-trauma fractures (excluding skull, face, hands, ankles, and feet), the concordance between predicted risk and fracture events (Harrell C) was 0.69 among women and 0.70 among men. For hip fractures the concordance was 0.80 among women and 0.85 among men. The observed fracture risk was similar to the predicted risk in all quintiles of risk except the highest quintile of women, where it was lower.
66.2.4
Direct comparisons between fracture assessment tools
The above-described tools have been directly compared against each other, and with simpler models, in a few studies. It is interesting to note that the simpler tools sometimes performed as well as those with more complex inputs in terms of fracture discrimination. The importance of calibration to the population under study is paramount and supports the fact that tools should be validated in local cohorts prior to clinical use.
Gourlay et al. compared FRAX, Garvan, QFracture, femoral neck BMD alone, and femoral neck BMD with age in 4994 community-dwelling men 65 years and older of the MrOS cohort . Among risk tools calculated with BMD the discriminative ability to identify men with incident hip fracture was similar for FRAX [AUC 0.77, 95% confidence interval (CI) 0.73, 0.81], the Garvan tool (AUC 0.78, 95% CI 0.74, 0.82), femoral neck BMD T -score with age (AUC 0.79, 95% CI 0.75, 0.83), and femoral neck BMD T -score alone (AUC 0.76, 95% CI 0.72, 0.81). Among risk tools calculated without BMD the discriminative ability to identify hip fracture was similar for QFracture (AUC 0.69, 95% CI 0.66, 0.73), FRAX (AUC 0.70, 95% CI 0.66, 0.73), and the Garvan tool (AUC 0.71, 95% CI 0.67, 0.74). Correlated ROC curve analyses revealed better diagnostic accuracy for risk scores calculated with BMD compared with QFracture ( P <.0001).
Garvan FRC, FRAX, and a simple model of age and prior fractures were compared using data from 19,586 women 60 years and older in the GLOW study (which enrolled women from 723 primary-care practices in 10 countries) . Using baseline clinical risk factors without BMD, both FRAX and Garvan FRC showed a moderate ability to correctly discriminate fractures with AUC for hip fracture 0.78 and 0.76, respectively, and for osteoporotic fractures 0.61 and 0.64, respectively. Neither algorithm was better than the model based on age plus fracture history alone (AUC for hip fracture 0.78).
Crandall et al. recently compared discrimination and calibration of FRAX and Garvan FRC for prediction of fractures in 63,723 younger women 50–64 years who participated in the WHI observational and clinical trial studies. Observed hip fracture probabilities were similar to FRAX-predicted probabilities but greater than Garvan-predicted probabilities. At maximal AUC (0.58 for Garvan, 0.65 for FRAX), sensitivity for detecting incident hip fractures was 16.0% (95% CI 12.7%–19.4%) for Garvan and 59.2% (95% CI 54.7%–63.7%) for FRAX. At the same AUC, sensitivity was similarly low for identifying MOF (range 26.7%–46.8%) or any clinical fracture (range 18.1%–34.0%). Conversely, at high sensitivity thresholds (80% or greater), specificity for both tools was low (Garvan 30.6%, FRAX 43.1%) as was the AUC (Garvan 0.58, FRAX 0.65).
Bolland et al. investigated the performance of FRAX and Garvan FRC in 1422 New Zealand postmenopausal women enrolled in a calcium supplementation trial. The FRAX-New Zealand tool was used both with and without baseline BMD. For each fracture subtype the calculators had comparable moderate predictive discriminative ability (AUC range: hip fracture 0.67–0.70; osteoporotic fracture 0.62–0.64; any fracture 0.60–0.63). The Garvan calculator was well calibrated for osteoporotic fractures (as defined by the Garvan tool) but overestimated hip fractures (ratio 1.5). FRAX with BMD underestimated MOF and hip fractures (ratios 0. 5 and 0.8) and FRAX without BMD underestimated MOF and overestimated hip fractures (ratios 0.7 and 1.4). Neither tool provided better discrimination than the model that included age and BMD only.
External validation and comparison of FRAX (without BMD), Garvan (without BMD), and QFracture for risk of osteoporotic fractures was performed using data from the 2010–14 electronic health records of 1,054,815 men and women aged 50–90 years . The AUC for hip fracture prediction was 0.83 for QFracture, 0.82 for FRAX, and 0.78 for Garvan. For MOF, AUCs were 0.71 for QFracture and 0.71 for FRAX. All the tools underestimated fracture risk, but the average observed to predicted ratios and the calibration slopes of FRAX were closest to unity. Tool-specific validation analyses yielded hip fracture prediction AUCs of 0.88 for QFracture (among those aged 30–100 years), 0.82 for FRAX (50–90 years), and 0.71 for Garvan (60–95 years). The simpler FRAX performed almost as well as QFracture for hip fracture prediction and may have advantages if some of the input data required for QFracture are not available.
QFracture was also compared to FRAX using the QResearch database in men and women aged 40–85 years. For hip fracture discrimination the AUC was 0.85 for QFracture and FRAX in women and 0.82 for both tools in men . In terms of calibration, FRAX overestimated the risk of hip in both men and women (ratios ranging from 1.08 to 2.03).
Using the BMD registry for Manitoba, Canada (34,060 men and women age ≥50 years), FRAX and CAROC were used to classify 10-year fracture risk as low (<10%), moderate (10–20%), and high (>20%) . Net reclassification improvement (NRI) was used to quantify the performance of FRAX versus CAROC. There were 10 (of 35 total) situations where observed fracture risk fell outside of the predicted range, and all 10 discordances favored FRAX. NRI among incident fracture cases was not significantly changed, but there was a significant improvement in risk categorization for those who remained fracture-free (+1.7%, P <.001). Within nine prespecified subgroups, there was no case of significant worsening in NRI when using FRAX instead of CAROC.
66.3
Special considerations in using fracture risk assessment tools
66.3.1
Qualitative considerations
Each of the tools described previously represents a combination of continuous (e.g., age) and categorical (e.g., previous fracture) risk factors. A limited amount of dose–response is accommodated among the categorical risk factors for the Garvan FRC (number of previous fractures, 0–3+; number of falls, 0–3+) and the QFracture score (e.g., smoking status, five levels; alcohol status, six levels). In contrast, the FRAX tool only considers dichotomous clinical risk factors (e.g., present vs absent). Other risk factors considered by Garvan FRC and/or QFracture are not considered in the current version of FRAX (e.g., falls). None of these tools consider fracture severity or recency. Fractures involving the hip and spine carry a higher risk for recurrent fracture than fractures of the distal extremities and also have an evidence base to support empiric therapy on the basis of fracture history alone . Risk likewise increases as a function of the number and severity of vertebral deformities, which can be combined as a spinal deformity index . The time dependence of fracture risk has drawn attention following observations that there is a period of higher risk following a fracture event . In principle, this creates an opportunity for early intervention, potentially with more potent agents, to reverse that risk .
To provide clinical guidance to primary care practitioners on the use of FRAX the International Society for Clinical Densitometry (ISCD) and International Osteoporosis Foundation (IOF) produced joint recommendations on qualitative considerations . For example, it is acknowledged that fracture probability may be underestimated in individuals with a history of frequent falls, but that quantification of this risk is not currently possible . Although the FRAX algorithm includes shared risk factors for increased falls risk and may indirectly capture of the associated risk , past falls still strongly predicts future fracture independently of FRAX score [adjusted hazard ratio (HR) for any fracture: 1.63, 95% CI 1.45–1.83; MOF 1.51, 95% CI 1.32–1.73; hip fracture 1.54, 95% CI 1.21–1.95] .
66.3.2
Quantitative adjustments
66.3.2.1
Glucocorticoid dose
For other risk factors, attempts have been made to develop and validate quantitative adjustments to fracture probability estimated by FRAX. The first of these examines the effect of glucocorticoid dose on fracture risk using computerized medical records of general practitioners in the General Practice Research Database (GPRD) and relied upon a reanalysis of previously published data . Dose–response was seen in nonvertebral, hip, and vertebral fracture risk for low- ( N =50,649, <2.5 mg daily prednisone or equivalent), moderate- ( N =104,833, 2.5–7.5 mg daily) and high-dose glucocorticoid use ( N =87,949, >7.5 mg daily). Simple rules were formulated to adjust MOF fracture probability (low dose—20% reduction, medium dose—no change, high dose—15% increase) and hip fracture probability (low dose—35% reduction, medium dose—no change, high dose—20% increase). More detailed age-specific adjustments were provided. No independent validation of these adjustments has been published.
66.3.2.2
Lumbar spine bone mineral density
Another quantitative adjustment concerns lumbar spine BMD T -score, which is not an input to FRAX, although it is frequently measured in clinical practice. The occurrence of significant discordance between hip and spine T -scores is a source of confusion, since it impacts on the densitometric diagnosis of osteoporosis (when based upon minimum T -score) but does not affect fracture risk when using FRAX or the Garvan FRC. A large BMD registry (33,850 women and 2518 men aged 50 years and older) with BMD measurements of the lumbar spine and hip and fracture outcomes was studied to develop and internally validate a rule to accommodate the risk associated with discordance between these BMD measurement sites . The offset (difference between lumbar spine and femur neck T -score) was found to significantly increase MOF fracture risk (12% increase per SD lumbar spine below femur neck) independent of FRAX probability. The simplified rule formulated from this analysis was “increase/decrease FRAX estimate for a major fracture by 1/10 for each rounded T -score difference between lumbar spine and femur neck.” The validation subgroup confirmed a significant improvement in fracture prediction using this rule, with 12.6% risk reclassification in individuals close to the intervention threshold. A simple example illustrates how this calculation is performed. Consider an individual with a femoral neck T -score of −1.7 and MOF FRAX probability of 18%. If the lumbar spine T -score is −3.5, then this indicates an offset of −1.8 (−3.5 minus −1.7). This is rounded to the nearest whole number (−2). One-tenth of the FRAX estimate based upon the femoral neck is 1.8%, which is multiplied by the rounded offset value (giving 3.6%). This is then added (because lumbar spine T -score is worse than femoral neck T -score) to the original FRAX estimate (18%) giving a final (rounded) probability of 22% (18%+3.6%).
A similar magnitude of effect from the difference (offset) between lumbar spine and thermal neck T -score values was seen in the CaMos (4575 women and 1813 men aged 50 years and older) . The effect was slightly stronger among women than men, but a significant sex interaction was not detected. Risk reclassification based upon sex- and age-dependent offsets showed improved risk classification, with the largest impact in those at moderate risk close to the intervention threshold. The results were then replicated in a metaanalysis of international cohorts (21,158 women, average age 63 years from 10 prospective cohorts) . MOF risk increased 9% for each SD change in the T -score difference between lumbar spine and femur neck. Overall risk reclassification was small (2.3–3.2%), increased for larger discrepancies (>2 SDs). Reclassification rates would be expected to be much greater close to the intervention threshold.
66.3.2.3
Trabecular bone score
Trabecular bone score (TBS) is a texture measure derived from lumbar spine DXA images that predicts fracture risk independent of clinical risk factors, BMD and FRAX score as reviewed for the ISCD official positions . This review concluded that there was consistent evidence that lower TBS was associated with increased fracture risk in 13 cross-sectional and 11 longitudinal studies. Using data from a large BMD registry (33,352 women aged 40–99 years), TBS was found to significantly increase MOF fractures excluding hip fracture, hip fracture, and death. Models were created for MOF and hip fracture probability accounting for death as a competing event and an interaction between age and TBS (larger effects in younger vs older). The importance of TBS as a FRAX-independent predictor of MOF and hip fracture in women and men, with independent validation of the TBS-adjustment to FRAX, was independently confirmed in a metaanalysis of 14 prospective studies . Adjusted for times and baseline, age and FRAX probability each SD reduction in TBS increased MOF probability by 32% overall (35% in men, 31% in women) and increased hip fracture risk by 28% overall (27% in men, 29% in women). The adjustment of FRAX probability for TBS resulted in a small overall increase in fracture risk stratification. To facilitate adoption, an online calculator to adjust for TBS was added to the FRAX website. Two subsequent analyses have shown that there is a significant improvement in risk reclassification based upon NRI, with the largest effects seen in individuals close to the FRAX-based intervention threshold and in younger individuals . The TBS adjustment has not been extended to other fracture risk assessment tools such as the Garvan FRC. However, an alternative approach was explored based upon a “risk-equivalent” adjustment to the BMD T -score . Specifically, adjustments for the BMD T -score (femur neck, total hip, lumbar spine) were developed that incorporated the risk associated with TBS (including an age-interaction term). This may facilitate the use of TBS where intervention guidelines are primarily based upon BMD T -score, or with non-FRAX risk calculators.
66.3.2.4
Hip axis length
Hip geometry has been of interest as a potential contributor to fracture risk and was extensively reviewed for the ISCD official positions in 2015 . Most of the hip geometry parameters derived from DXA were nonsignificant when adjusted for BMD and were not felt to be of clinical utility for assessing hip fracture risk. The exception was hip axis length (HAL), usually defined as the distance from the inner pelvic rim to the greater trochanter, for which there was consistent evidence for an association with hip fracture risk in postmenopausal women. The largest single study evaluated 50,420 women aged 40 years and older with 1020 experiencing incident hip fracture (median follow-up 6.4 years). HAL showed a consistent association with hip fracture risk (30% greater for each SD increase in HAL), which was unaffected by the adjustment for FRAX without and with BMD. Other geometry measures were noncontributory when BMD adjusted. Similar results were seen among 4738 men . An adjustment for FRAX hip fracture probability was developed and could be applied to both men and women: “relative increase in hip fracture probability 4.7% for every millimeter that HAL is above the sex-specific average, relative decrease in hip fracture probability 3.8% for every millimeter that HAL is below the sex-specific average.” This adjustment has not been independently validated.
66.3.3
Special populations
66.3.3.1
Diabetes
FRAX was developed for primary care practitioners and therefore is of greatest relevance to the general population. However, there is increasing interest in the application of FRAX to specific subgroups and conditions that are not fully considered by FRAX. Type 1 diabetes (T1D) is considered as one of the causes of secondary osteoporosis in the FRAX algorithm but not as a primary entry variable. As such, it is given the same weight as other causes of secondary osteoporosis (modeled after RA) but only increases fracture probability when BMD is not included in the FRAX calculation . Including secondary osteoporosis as an input when FRAX is used without BMD may partially account for the excess fracture risk in T1D but would underestimate the high relative risk for hip fractures in T1D . No studies have directly assessed the performance of FRAX (with or without BMD) for predicting fracture in T1D.
T2D mellitus is of particular interest since it is known to have complex and paradoxical effects on fracture risk, such that fracture risk is increased despite higher BMD. Furthermore, this risk increases with longer duration of diabetes and has a stronger effect on hip fracture risk than MOF . Several studies have evaluated the predictive performance of FRAX in patients with T2D. These studies showed that for a given FRAX probability, there is an increased risk of fracture in diabetics as compared to nondiabetics . Schwartz et al. compared the results of three prospective observational studies of older community-dwelling adults comprising 9449 women (770 with T2D) and 7436 men (1199 with T2D). For a given FRAX probability, women and men with T2D had a higher observed fracture risk. Despite systematically higher fracture risk attributable to T2D, FRAX predicted hip and nonspine fractures equally well in those with and without T2D (all P for interaction >0.10). These findings were confirmed in a subsequent study of 3518 patients with diagnosed diabetes (predominantly T2D) from a large clinical registry . Diabetes was confirmed to be a risk factor for subsequent MOF (adjusted HR 1.61, 95% CI 1.42–1.83) or hip fracture (adjusted HR 6.27, 95% CI 3.62–10.87 aged <65 years; 2.22, 95% CI 1.71–2.90 aged ≥65 years). FRAX was able to stratify fracture risk in those with diabetes (AUC for MOF 0.67, 95% CI 0.63–0.70; AUC for hip fracture 0.77, 95% CI 0.72–0.81), only slightly less well than in those without diabetes. However, FRAX underestimated MOF and hip fracture risk in those with diabetes, even after accounting for competing mortality. Similar were findings were reported for FRAX scores retrospectively calculated without BMD from computerized health records in 141,320 women aged 50–90 years old (including 19,853 with diabetes), showing similar discrimination for incident MOF (AUC 0.64 vs 0.65, respectively) with slightly lower discrimination for incident hip fracture (AUC 0.77 vs 0.82, respectively) . The results indicated that FRAX score is useful for the assessment of fracture risk in older adults with diabetes.
Interpretation of the FRAX score in an older patient must take into account the higher fracture risk associated with diabetes. In a related analysis based upon 62,413 individuals 40 years and older [6455 (10%) with diabetes], diabetes and the FRAX risk factors were independently associated with MOF and hip fracture . Importantly, diabetes did not significantly modify the effect of individual FRAX risk factors with the exception of age, which exerted a stronger effect on hip fracture, risk in younger as compared to older individuals. For example, MOF showed a similar relationship to a 10-year increase in age in those without diabetes (HR 1.43) versus those with diabetes (HR 1.39, P -interaction 0.781), RA (1.43 vs 1.74, P -interaction 0.325), and prior fracture (1.62 vs 1.72, P -interaction 0.588) when adjusted for BMD. When BMD was excluded, an increase in BMI of 5 kg/m 2 was similarly protective against MOF in those without diabetes (HR 0.83) and those with diabetes (HR 0.79, P -interaction 0.276). The absence of statistically significant interactions between diabetes status and risk factors for predicting MOF implies a simple additive effect of diabetes to the MOF probability derived from FRAX clinical risk factors.
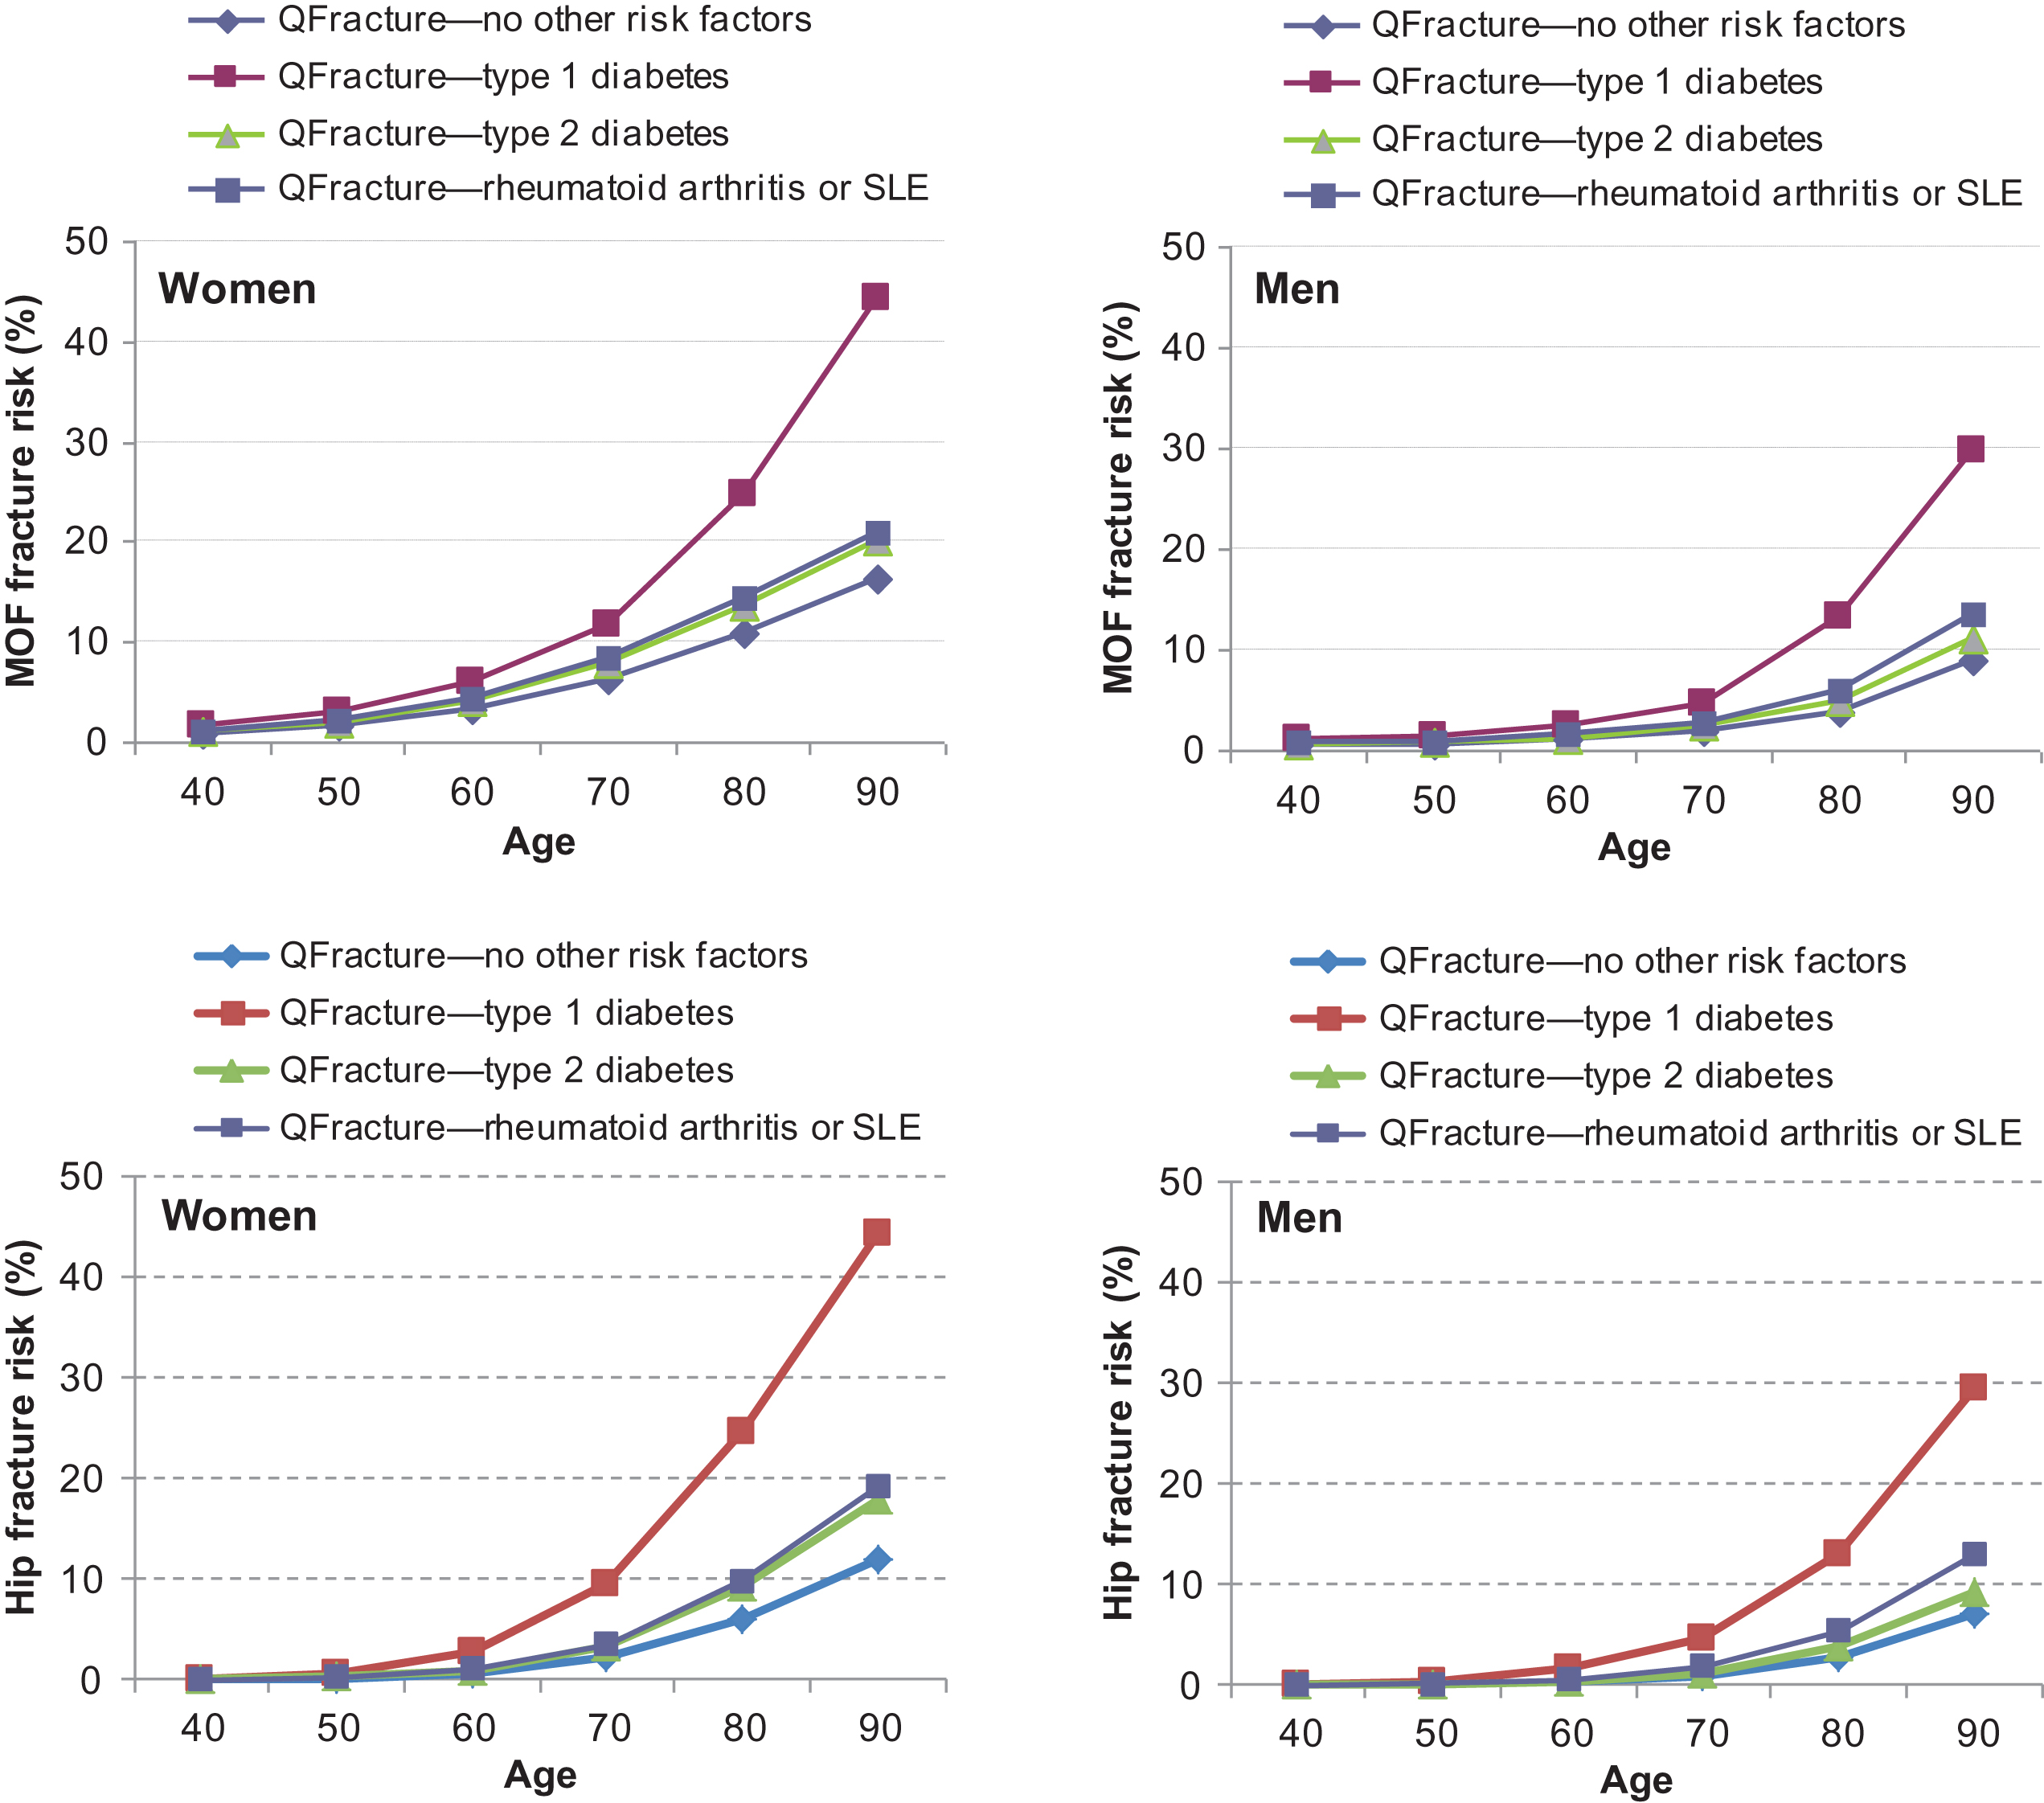
Several methods have been proposed to inform the use of FRAX by primary care practitioners to accommodate the effect of T2D despite its absence as an input variable in FRAX . The TBS adjustment to FRAX will capture some of the excess fracture risk associated with T2D . It has also been estimated that the fracture risk in diabetes calculated with FRAX is equivalent to adding 10 years of age or reducing the BMD T -score by 0.5 SD . Another proposal is to substitute RA with T2D in FRAX and this is supported by the similarity in the weights given in the QFracture algorithm ( Fig. 66.2 ) . A large BMD registry (44,543 women and men 40 years of age or older, 4136 with diabetes, with incident MOF and hip fractures ascertained over mean 8,3 years) compared the following methods to improve the performance of FRAX for T2D including (1) the RA input to FRAX; (2) making a TBS adjustment to FRAX; (3) reducing the femoral neck T -score input to FRAX by 0.5 SD; and (4) increasing the age input to FRAX by 10 years . Each of the proposed methods was found to improve performance, though no single method was optimal in all settings. There was moderate risk reclassification based upon fixed intervention thresholds for MOF (4.1%–7.1%) or hip fracture (5.7%–16.5%). NRI increased for MOF with each of the diabetes adjustments (range 3.9%–5.6% in the diabetes subgroup).

