Treatment of iron overload requires robust estimates of total-body iron burden and its response to iron chelation therapy. Compliance with chelation therapy varies considerably among patients, and individual reporting is notoriously unreliable. Even with perfect compliance, intersubject variability in chelator effectiveness is extremely high, necessitating reliable iron estimates to guide dose titration. In addition, each chelator has a unique profile with respect to clearing iron stores from different organs. This article presents the tools available to clinicians to monitor their patients, focusing on noninvasive magnetic resonance imaging methods because they have become the de facto standard of care.
Key points
- •
Serum ferritin and transferrin saturation remain valuable in tracking the therapeutic response to iron-removal therapies.
- •
These inexpensive techniques have many shortcomings that preclude using them safely as sole monitors for chelator efficacy.
- •
Magnetic resonance imaging has become the de facto gold standard for tracking iron levels in the body because it is accurate, reproducible, and well tolerated by patients, and can track iron levels in different organs of the body.
- •
The latter characteristic is important because the mechanisms and kinetics of iron uptake and clearance vary across somatic organs.
- •
The author’s clinical practice is presented as a reference, but individual experiences will still be colored by local expertise as the technologies continue to mature and be more widely distributed.
Monitoring transfusion burden
Each unit of packed red blood cells (PRBCs) contains between 200 and 250 mg of iron. In fact, the iron can be calculated from the hematocrit (Hct) using the following relationship:
where Hct is calculated from the PRBCs provided by the blood bank. The volume of transfused blood in 1 year can be converted to a predicted change in liver iron concentration (LIC) if no chelation is taken, using the following equation :
Thus a patient receiving 150 mL/kg/y of PRBCs having an Hct of 70% would increase the liver iron by 10 mg/g in the absence of iron chelation. As a rule of thumb, each 15 mL/kg transfusion will raise liver iron by approximately 1 mg/g dry weight.
Therefore, tracking transfusional iron exposure is a logical and conceptually simple way of predicting iron chelation needs, a priori. It is clearly useful in deciding when to initiate iron chelation therapy. Systematic intensification of transfusion requirements, such as may occur during hepatitis C treatment, should prompt preemptive changes in iron chelation. However, there are 2 major limitations to using transfusional burden to adjust chelation. In practice, values may be difficult to track because amounts released from the blood bank are systematically larger than are given to the patients. More importantly, there are complicated interactions between transfusion iron rate and chelator efficacy that may be patient and disease specific, creating differences between predicted and observed response to therapy.
Serum markers of iron overload
Ferritin is an intracellular iron-storage protein that is essential for all living cells because it maintains labile cellular iron levels within a safe range while protecting cells against iron deficiency in the future. The circulating serum ferritin pool mostly arises from the liver and reticuloendothelial systems, and its biological role is unclear. The relationship between serum ferritin and total body iron stores is complicated. Correlation coefficients between ferritin and liver iron concentration are typically around 0.7, leaving 50% of the variability unexplained. More importantly, the confidence intervals for predicting LIC values from serum ferritin measurements are enormous. A patient having a serum ferritin level of 1500 ng/mL could have a LIC as low as 3 or as high as 30 mg/g dry weight. As a result, toxicity thresholds based on serum ferritin levels can be dangerously misleading.
Serum ferritin may be so unreliable because it is an acute-phase reactant that rises sharply with inflammation. The liver is the major source of circulating ferritin, and even minor liver insults will sharply increase serum ferritin. By contrast, ascorbate deficiency leads to inappropriately low serum ferritin values relative to iron stores. Lastly, serum ferritin levels depend on the transfusion rate in addition to the body’s iron stores. Nontransfused iron-overloaded patients, such as those with β-thalassemia intermedia, have much lower ferritin values for a given total-body iron concentration.
Intrapatient trends in serum ferritin improve its predictive value. The author typically measures serum ferritin values with every transfusion, and trend median values over a period of 3 to 6 months. Nonetheless, ferritin and LIC trends remain discordant more than 30% of the time. Periods of discordance can span months to years.
Despite its limitations, serum ferritin is undoubtedly the world’s most widely used method for tracking iron stores because of its low cost and universal availability. Box 1 summarizes guidelines for improved use of serum ferritin to trend iron overload.
- 1.
Measure serum ferritin every or every other transfusion visit for transfused patients and quarterly for nontransfused patients
- 2.
Calculate median values over 3- to 6-month intervals for trends
- 3.
Monitor and prevent ascorbate deficiency
- 4.
Anchor each serum ferritin trends to LIC assessments at a minimum of every 2 years
- 5.
Repeat MRI if trends in serum ferritin are incongruent with reported patient compliance or other clinical assessments
Transferrin saturation is also an important and widely available serologic marker of iron balance. It represents the earliest and most specific marker of primary hemochromatosis, and is a key screening marker in all diagnostic algorithms for this disease. Increased transferrin saturation can also be used as an indicator to initiate iron chelation therapy in thalassemia intermedia in addition to all secondary hemochromatosis syndromes.
Many chronically transfused patients have fully saturated transferrin, making it uninformative for short-term and mid-term assessment of chelation efficiency. The prevalence of circulating non–transferrin-bound iron (NTBI) increases dramatically once transferrin saturation exceeds 85%. Thus, desaturating transferrin to less than 85% is a reasonable long-term target for iron chelation therapy in transfusional siderosis syndromes. However, from a practical perspective, transferrin saturation cannot be accurately assessed in the presence of circulating chelator so patients must hold their iron chelation for 24 hours before their blood draw, limiting the practicality of frequent monitoring by this method. The author recommends annual screening of transferrin saturation in chronically transfused patients, in line with other screening laboratories.
Measurement of liver iron concentration
The liver accounts for approximately 70% to 80% of the total-body iron stores in iron-overloaded patients. As a result, changes in liver iron accurately predict the balance between transfusional burden and iron-removal therapies. LIC exceeding 17 mg/g dry weight is associated with iron-mediated hepatocellular damage. Patients with LIC values above this threshold are also at increased risk for cardiac iron overload. Long-term liver siderosis is associated in increased risk of hepatocellular carcinoma in patients with hereditary hemochromatosis. Hepatocellular carcinoma is also becoming a leading cause of death in iron-loaded adults with thalassemia syndromes, even in patients who are hepatitis C negative.
Whereas increased LIC places patients at particular danger for iron-overload complications, there is no “safe” LIC threshold below which cardiac and endocrine iron accumulation does not occur. The reason for this apparent paradox is that many chronically transfused patients have fully saturated transferrin, regardless of their LIC. Patients who miss chelator doses expose their extrahepatic organs to unrestricted uptake of labile iron species.
Despite its limitations, LIC remains the best single metric for tracking chelator response and dosing adjustments. At most major thalassemia and sickle cell disease (SCD) centers, it is measured annually to guide chelation therapy.
Liver Biopsy
Traditionally, LIC was measured by ultrasound-guided transcutaneous needle biopsy. Biopsy has the advantage of providing both histologic assessment of liver damage and iron quantification. The complication rate is acceptable, typically about 0.5%, but life-threatening hemorrhages occur. The single greatest limitation is the spatial heterogeneity of tissue iron deposition in the liver that can result in high sampling variability, even in the absence of significant liver disease. When significant fibrosis is present, the coefficient of variability can exceed 40%, making biopsy essentially useless for tracking response to therapy. Following collection from a cutting needle, liver samples are fixed in formaldehyde and sent fresh or paraffin-embedded to special laboratories for quantification. Iron quantification is generally performed using tissue digestion in nitric acid followed by either atomic absorption or inductively coupled mass spectrometry. These assays have a coefficient of variation of around 12%, independent of the sampling variability. Values are reported as mg/g dry weight of tissue. Paraffin-embedded specimens must be dewaxed with organic solvents before digestion. This process lowers the tissue dry weight because it removes membrane lipids, raising the apparent iron concentration. Because of its known systematic and random errors, cost, and invasiveness, liver biopsy can no longer be considered the gold standard for LIC assessment, and should not be used except when tissue histology is necessary for diagnosis.
Computed Tomography
Iron increases x-ray attenuation proportionally to its concentration. The ability of carefully calibrated quantitative computed tomography (qCT) measurements to measure liver iron has been known for decades. Two basic approaches used are single-energy and dual-energy techniques.
In single-energy techniques, a low-dose qCT scan is performed at a middle hepatic level and the liver attenuation is compared with an external phantom control. The phantom need not be iron-based; it is simply necessary to correct for imperfections in the x-ray beam. The chief limitation of this approach is that changes in attenuation caused by iron are small in comparison with normal attenuation fluctuations. Thus single-energy qCT cannot accurately track LIC changes for LIC values less than 7 mg/g dry weight, and is less accurate than magnetic resonance imaging (MRI) measurements for LIC values less than 15 or 20 mg/g. By contrast, qCT is fairly robust for severe iron overload.
In dual-energy techniques, measurements are performed at low and high x-ray beam energies, and the difference is used to predict the amount of iron. Non–iron-loaded tissue has similar attenuation values at both field strengths, and is suppressed when the difference is calculated. Although this potentially offers better discrimination at low iron concentrations, it requires higher radiation exposure to achieve it. Feasibility was demonstrated in animal studies nearly 2 decades ago, but there have been no validation studies performed using modern equipment.
Magnetic Detectors
Tissue iron is paramagnetic. Consequently, devices that measure the magnetic properties of liver can quantify liver iron. The first devices to accomplish this used superconducting magnetic coils and were known as superconducting quantum interference devices (SQUIDs). Although reasonably accurate, these devices are expensive, require specialized expertise for measurement acquisition and device maintenance, and can only quantitate iron in the liver and spleen. As a result, only 4 SQUID devices suitable for LIC quantification are operational worldwide. More inexpensive devices that operate at room temperature could potentially become practical in the future, but remain research tools for the present.
Magnetic Resonance Imaging
MRI can also be used to quantify iron overload. It does not measure liver iron directly, but the effect of liver iron on water protons as they diffuse in the magnetically inhomogeneous environment caused by iron deposition. The principles are simple. The scanner transmits energy into the body in the form of microwaves, waits a period of time, and then actively recalls this energy as microwaves that are received by an antenna or “coil.” The longer the scanner waits before recalling an echo, the less energy returns. This process is known as relaxation, and is characterized by the relaxation rates R2 and R2* (measured in Hz). These rates are simply the mathematical inverse of the characteristic relaxation times, T2 and T2* (measured in milliseconds). The higher is the iron concentration, the higher the relaxation rates and the shorter the relaxation times. The difference between R2 and R2* depends on how the scanner forms the echo. R2* is the parameter measured for gradient-formed echoes but R2 is the parameter measured if radiofrequency pulses are used to form the echo (spin echo).
The first large study validating MRI as a means to quantify liver iron used a specific protocol to measure liver R2. The R2 calibration curve was curvilinear and exhibited limits of agreement of −56% to 56%. Much of the uncertainty in this method arises from sampling errors of the gold-standard liver biopsy itself. Other sources of uncertainty are patient-specific differences in iron distribution, speciation, and hepatic water content. However, liver R2 assessment is highly reproducible, has been independently validated, and is transferable across different types of MRI scanner. Fig. 1 depicts work from the author’s laboratory, independently confirming the initial R2-iron calibration. One specific liver R2 acquisition and analysis protocol, known as Ferriscan, has been approved by the Food and Drug Administration (FDA) as a clinical device.
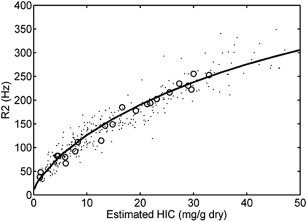
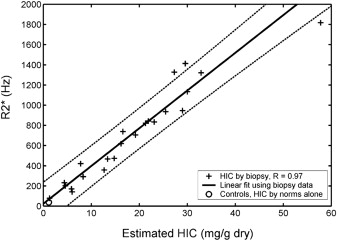
Fig. 2 demonstrates the relationship between liver R2* and LIC. This relationship is linear and has confidence intervals of −46% to 44%; calibration was independently validated in a subsequent study. Some confusion exists in the literature because calculated R2* values depend on the type of mathematical models used to fit the MRI images. However, these biases are corrected when appropriate calibration curves are applied.
Both R2 and R2* are suitable for LIC estimates in clinical practice if performed using validated acquisition and analysis protocols. R2 and R2* both are more accurate than liver biopsy for determining response to iron chelation therapy. However, it is important to use the same technique when tracking patients over time. Liver R2* is more robust than liver R2 for tracking chelation response on time scales 6 months or shorter, but R2 and R2* performances are equivalent for annual examinations. Table 1 lists FDA-approved options for R2 and R2* analysis. Some centers, including the author’s, use software developed in-house. All such tools require cross-validation with established techniques before clinical use. Table 2 summarizes the advantages and disadvantages of both techniques.
| Tool | Description |
|---|---|
| Ferriscan | A full-service imaging company that will guide tightly controlled image acquisition and provide an imaging report. A good option when local radiology expertise or interest is lacking. Billed as a charge per examination that must be passed to insurers or patients |
| CMR Tools Circle CMR42 Diagnosoft STAR Medis QMass | Stand-alone software that provides organ T2* measurements from suitably acquired images. Care must be taken to measure regions and truncate signal decay curves appropriately. Values are not reported in iron units, but calibration curves for liver and heart may be found in Refs. ; software can be licensed annually or purchased outright |
| ReportCard | MRI vendor-based T2* analysis packages. Some allow use of different fitting models. Cross-validation with other techniques is lacking for these tools at present. Software is generally purchased outright at the time of equipment acquisition |
| Ferriscan R2 | R2* | |
|---|---|---|
| Speed | 10 min per examination | <1 min |
| Validation | ++++ | ++++ |
| Reproducibility (%) | 5–8 | 5–6 |
| Quality control | Tight (by vendor) | Variable (by site) |
| Cost | $400 per examination | Variable. Approximately 10 min of technician time + software costs |
| Dynamic range (mg/g) | 0–43 | Variable, usually 0–35 |
| Breathing artifact | Vulnerable to ghosting | Robust (breath-hold) |
| Metal/gas artifact | Robust | May affect usable region |
Related posts:

Stay updated, free articles. Join our Telegram channel

Full access? Get Clinical Tree


