Disease phase
ELN (2006)
WHO (2008)
ELN (2013)
Accelerated phase
Blast cells in blood or bone marrow 15–29 %, or blasts + promyelocyte in blood or marrow >30 %, with blasts <30 %
Blast cells in blood or bone marrow 10–19 %
Blast cells in blood or bone marrow 15–29 %, or blasts + promyelocyte in blood or marrow >30 %, with blasts <30 %
Basophils in blood ≥20 %
Basophils in blood ≥20 %
Basophils in blood ≥20 %
Persistent thrombocytopenia (<100 × 109/L) unrelated to therapy
Persistent thrombocytopenia (<100 × 109/L) unrelated to therapy
Persistent thrombocytopenia (<100 × 109/L) unrelated to therapy
Thrombocytosis (>1000 × 109/L), unresponsive to therapy
Clonal chromosome abnormalities in Ph+ cells (CCA/Ph+), major route, on treatment
Persistent or increasing WBC (>10 × 109/L) count and/or persisting or increasing splenomegaly unresponsive to therapy
Clonal cytogenetic evolution occurring after initial diagnostic karyotype
Blast phase
Not referred
Blasts in blood or marrow ≥20 %
Blasts in blood or marrow ≥30 %
Extramedulary blast proliferation, apart from the spleen
Extramedulary blast proliferation, apart from the spleen
The panel used a term of early chronic-phase (ECP) patients with CML. ECP-CML included patients diagnosed as CP-CML within 1 year without heavily treated with interferon because these patients can receive better efficacy of imatinib compared to patients classified as late chronic phase (LCP) who were resistant or intolerant to interferon αtherapy. However, the majority of patients with CP-CML have been treated by imatinib as the first-line therapy after ELN2006; terms of ECP and LCP in CP-CML were disappeared in ELN2009 [16] or ELN2013 [17].
The relative risk (RR) of progression and death in treatment-naïve CP patients or newly diagnosed CP-CML is important for selection of therapy. Sokal and Hasford scores [25, 26] were both defined as relative risk (RR) evaluations in ELN2006 and ELN2009, and EUTOS score [27] was introduced in ELN2013.
6.3.2 Definition of Response
Response to treatment for CP-CML has been defined by three categories, hematologic, cytogenetic, and molecular responses. Definition of hematologic response has not been changed since it was listed in ELN2006 [15]. However, definitions of cytogenetic and molecular responses have been updated since the majority of patients with newly diagnosed CP-CML have an excellent response to first-line treatment with a TKI after introduction of imatinib (Table 6.2).
Table 6.2
Definitions of response
ELN 2006 | ELN 2009 | ELN 2013 | ||
|---|---|---|---|---|
Hematologic response | ||||
Complete (CHR) | Platelet count <450 × 109/L | |||
WBC count <10 × 109/L, differential | ||||
Without immature granulocytes and with less than 5 % basophils | Same as definition of ELN 2006 | Same as definition of ELN 2006 | ||
Nonpalpable spleen | ||||
Cytogenetic response (is evaluated by morphologic cytogenetics of at least 20 marrow metaphases) | ||||
Complete | CCgR: Ph+ 0 % | CCgR: no Ph+ metaphases | CCyR: no Ph+ metaphases, <1 % BCR–ABL1-positive nuclei of at least 200 nuclei | |
Partial | PCgR: Ph+ 1–35 % | PCgR: 1–35 % Ph+ metaphases | PCyR: 1–35 % Ph+ metaphases | |
Minor | MinorCgR: Ph+ 36–65 % | mCgR: 35–65 % Ph+ metaphases | mCyR: 36–65 % Ph+ metaphases | |
Minimal | MinCgR: Ph+ 66–95 % | minCgR: 66–95 % Ph+ metaphases | minCyR: 66–95 % Ph+ metaphases | |
None | None: Ph+ >95 % | noCgR: >Ph+ metaphases | noCyR: >Ph+ metaphases | |
Molecular response (BCR-ABL to control gene ratio according to International Scale) | (Is assessed according to the International Scale (IS) as ratio of BCR–ABL1 transcripts to ABL1 transcripts | |||
Complete | Transcript nonquantifiable and nondetectable | CMolR: undetectable BCR–ABL mRNA transcripts by real-time quantitative and/or nested PCR in two consecutive blood samples of adequate quality (sensitivity >104) | MR4.5 <0.0032 % BCR–ABL1 IS or undetectable disease in cDNA with >32,000 ABL1 transcripts in the same volume of cDNA used to test for BCR–ABL1 | |
MR4.0 <0.01 % BCR–ABL1 IS or undetectable disease in cDNA with >10.000 ABL1 transcripts | ||||
Major | ≤0.10 | MMolR: ratio of BCR–ABL to ABL (or other housekeeping genes) ≤0.1 % on the International Scale | MMR: BCR–ABL1 IS expression of ≤0.1 % | |
In ELN2006, as only chromosome banding analysis (CBA) of marrow cell metaphases can be used to assess the degree of cytogenetic response (CgR or CyR), CBA of marrow cells should be performed before treatment, at least every 6 months until a complete CCyR (CCgR or CCyR) has been achieved and confirmed and then every 12 months. Fluorescence in situ hybridization (FISH) of blood interphase cell nuclei could substitute for CBA of marrow cell metaphases only for the assessment of CCyR, which is then defined by <1 % BCR-ABL1-positive nuclei of at least 200 nuclei, from ELN2009 [16] and ELN2013 [17].
The panel of ELN2006 indicated that it is necessary to measure the level of the BCR–ABL1 transcripts to determine minimal residual disease (MRD) since the frequency of CCyR is very high in imatinib-treated patients. A 3-log reduction from a standard baseline or lower than 0.1 % of BCR–ABL1 transcript level was defined as major molecular response (MMolR or MMR) in ELN2006, which was based on the data collected from IRIS trial and others [28–30]. Definition of MMR was supported but definitions of deeper MR were updated in ELN2009 and ELN2013 by progress of measuring of BCR–ABL1 transcript and of standardizing internationally. The panel of ELN2013 [17] defined molecular response according to the International Scale (IS) as the ratio of BCR–ABL1 transcripts to ABL1 transcripts, or other internationally recognized control transcripts, and it is expressed and reported as BCR–ABL1% on a log scale, where 10 %, 1 %, 0.1 %, 0.01 %, 0.0032 %, and 0.001 % correspond to a decrease of 1, 2, 3, 4, 4.5, and 5 logs, respectively, below the standard baseline that was used in the IRIS trial [16, 30–33]. The panel proposed that the term complete molecular response should be avoided and substituted with the term molecularly undetectable leukemia, with specification of the number of the control gene transcript copies. The panel indicated that these definitions depend critically on the ability of testing laboratories to measure absolute numbers of control gene transcripts in a comparable manner, as well as their ability to achieve the polymerase chain reaction (PCR) sensitivity required for BCR–ABL1 detection [17]. Therefore, definitions of deeper MR will be updated in further recommendations or guidelines for management CML.
6.4 Updating Evaluation of Response
The goals of treatment for CML are to eradicate leukemic cells, to restore normal hematopoiesis, and to obtain durable best response without adverse effects. Criteria of evaluation of response were updated as listed in Table 6.3. Based upon long-term results of IRIS trial [9–11], imatinib can provide most patients their best response within the first year of treatment and some of patients continue to deepen their response more than several years. It is critically important to carefully follow patients using timepoint evaluation proposed by ELN recommendations. Data from IRIS trial suggested that early CyR is the most important response-related prognostic factor. However, since clinical efficacy of imatinib has not been fully established at time of ELN206 published, the panel avoided defining optimal response. Instead, the panel proposed to define the response to the treatment at different timepoints (at 3, 6, 12, 18 months) as failure, suboptimal, and warnings including implication for patients.
Table 6.3
Evaluation of overall Responses to TKIs as first-line therapy in chronic myeloid leukemia-chronic phase (CML-CP)
ELN 2006 (evaluation of overall responses to imatinib first line in early CML-CP) | |||
|---|---|---|---|
Timepoint | Failure | Suboptimal response | Warnings |
Diagnosis | NA | NA | High risk, del9q+, ACAs in Ph+ cells |
3 months after diagnosis | No HR (stable disease or disease progression) | No HR (stable disease or disease progression) | NA |
6 months after diagnosis | <CHR, no CgR (Ph+ >95 %) | <PCgR (Ph+ >35 %) | NA |
12 months after diagnosis | <PCgR (Ph+ >35 %) | <CCgR | <MMolR |
18 months after diagnosis | <CCgR (Ph+ = 0) | <MMolR | NA |
Anytime | Loss of CHRa, loss of CCgRb, mutationc | ACA in Ph+ cellsd, loss of MMolRd, mutatione | Any rise in transcript level; other chromosome abnormalities in Ph- cells |
Implication for patients | Move to other treatments whenever available | Continue imatinib but long-term outcome is not likely to be optimal. Be eligible for other treatments | Monitor very carefully. Become eligible for other treatments |
ELN 2009 (evaluation of overall responses to imatinib first line in CML-CP) | ||||
|---|---|---|---|---|
Evaluation Time (months) | Response | Warning | ||
Optimal | Suboptimal | Failure | ||
Baseline | NA | NA | NA | High risk, CCA/Ph+f |
3 | CHR and at least minor CgR (Ph+ ≤ 65 %) | No CgR (Ph+ >95 %) | No CgR (Ph+ >95 %) | NA |
6 | At least PCgR (Ph+ ≤ 35 %) | <PCgR (Ph+ >35 %) | No CgR (Ph+ >95 %) | NA |
12 | CCgR | PCgR (Ph+ 1–35 %) | <CCgR | <MMolR |
18 | MMolR | <MMolR | <CCgR | NA |
Any time during treatment | Stable or improving MMolRg | Loss of MMolRg mutationsh | Loss of CHR, loss of CCgR, mutationsi, CCA/Ph+ | Increase in transcript levelsj, CCA/Ph- |
ELN 2013 (evaluation of overall responses to imatinib, dasatinib, or nilotinib first line in CML-CP) | |||
|---|---|---|---|
Optimal | Warnings | Failure | |
Baseline | NA | High risk, or CCA/Ph+, major route | NA |
3 months | BCR–ABL1 ≤10 % and/or Ph+ ≤35 % | BCR–ABL1 >10 % and/or Ph+ 36–95 % | Non-CHR and/or Ph+ >95 % |
6 months | BCR–ABL1 <1 % and/or Ph+ 0 | BCR–ABL1 1–10 % and/or Ph+ 1–35 % | BCR–ABL1 >10 % and/or Ph+ >35 % |
12 months | BCR–ABL1 ≤0.1 % | BCR-ABL1 >0.1–1 % | BCR–ABL1 >1 % and/or Ph+ >0 |
At any time | BCR–ABL1 ≤0.1 % | CCA/Ph− (−7 or 7q–) | Loss of CHR, loss of CCyR, confirmed loss of MMRk, mutation, CCA/Ph+ |
The concept of optimal response has been proposed from ELN2009 [16]. The panel of ELN2009 also proposed that monitoring the response to imatinib requires blood counts and differentials, cytogenetics, and molecular testing for BCR–ABL1 transcript level and for BCR–ABL1 kinase domain mutations as some research required [34–36]. Timepoint and methods for response evaluation are proposed comprehensively in ELN2009: (a) blood counts and differentials are required frequently during the first 3 months until a CHR; (b) cytogenetics, performed with CBA of marrow cell metaphases, is required at 3 and 6 months, then every 6 months until a CCgR, and then every 12 months if regular molecular monitoring cannot be assured, and always in instances of myelodysplastic features, suboptimal response, or failure; (c) marrow CBA is preferred to interphase fluorescent in situ hybridization (I-FISH), but I-FISH can be substituted after CCgR; (d) real-time, quantitative polymerase chain reaction should be performed on whole buffy-coat blood cells, and results should be expressed as a ratio of BCR-ABL to ABL (or other housekeeping genes) × 100 %; converted to the International Scale, the ratio ≤0.1 % defined MMolR (or MMR).
Response evaluation for CP-CML with TKIs as first-line treatment has updated in ELN2013 based upon collected data from some clinical trials of initial treatment with imatinib [10, 11, 37–45]. According to ELN2013 [17], total 4360 patients with CP-CML treated with imatinib (400–800 mg/day) as the first-line therapy were followed at more than 5 years; progression-free survival (PFS) ranged between 83 and 94 % (median 90 %) and overall survival (OS) ranged 83 and 97 % (median 89 %). The panel of ELN2013 also considered efficacy of nilotinib and dasatinib as the first-line therapy based upon ENESTnd [19–21] and DASISION trials [22, 23]. As the panel of ELN2013 indicated that nilotinib and dasatinib as well as imatinib could be selected as first-line TKIs, evaluation of response was updated to define as “optimal” or “failure.” Optimal response is associated with the best long-term outcome and it indicates to continue treatment with the same TKI. Timepoint of optimal response was updated in ELN2013. Since second-generation TKI provided faster and deeper response, it should be obtained more than partial CyR (or BCR–ABL1 ≤10 %) by 3 months, more than CCyR (or BCR–ABL1 ≤1 %) by 6 months, and more than MMR (or BCR–ABL1 ≤0.1 %) by 12 months.
Failure means that the patient should receive a different treatment to limit the risk of progression and death. The previous term of “suboptimal” was changed to “warning” which implies that the characteristics of the disease and the response to treatment require more frequent monitoring to permit timely changes in therapy in case of treatment failure.
6.5 Resistant to TKIs (Emergence of BCR-ABL1 Mutations)
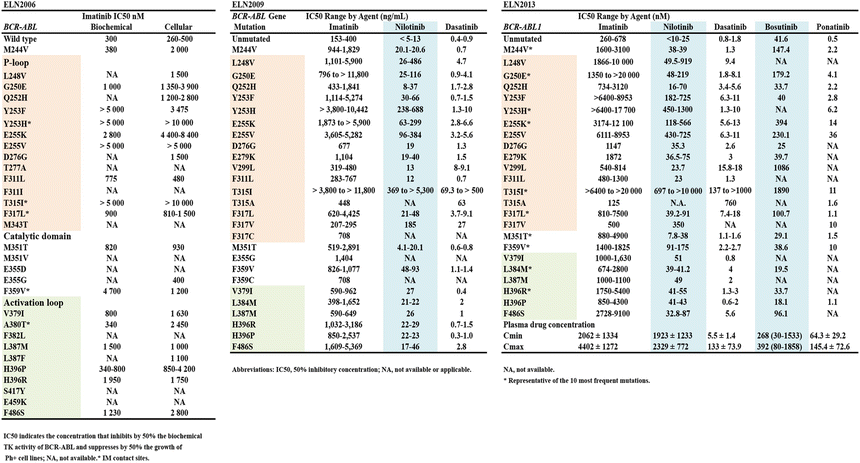
Among various factors that cause for emergence of resistance to TKIs, clonal evolution and mutations are likely to be the most important factors and are related to each other. Relation between IC50 values and these BCR-ABL1 mutations has been summarized firstly about imatinib in ELN2006, secondary about nilotinib and dasatinib addition to imatinib in ELN2009, and currently about available TKIs adding bosutinib and ponatinib in ELN2013 (Table 6.4) [15–17]. Recently, ABL1 kinase domain point mutations have been detectable about 50 % of patients with TKI-failure and progression to advanced phases [46–55].

Table 6.4
IC50 values of BCR-ABL1 mutations observed in patients treated with TKIs according to three types of ELN recommendations

More than 80 amino acid substitutions have been reported in association with resistance to imatinib [48, 51, 52]. Dasatinib and nilotinib have much smaller spectra of resistant mutations, but neither inhibits the T315I. Patients relapsing while taking nilotinib were most frequently found to have acquired Y253H, E255K/V, F359V/C/I, or T315I mutations, whereas patients relapsing while taking dasatinib were most frequently found to have acquired V299L, F317L/V/I/C, T315A, or T315I mutations [50–54]. T315I is also resistant to bosutinib [56, 57], whereas ponatinib inhibits T315I in vitro and is effective in patients with T315 in vivo [58–60].
6.6 Updating Treatment Recommendations (Tables 6.5, 6.6, and 6.7)
6.6.1 For CP-CML (Table 6.5)
Table 6.5


Treatment recommendation proposed in three types of ELN – for chronic phase
Stay updated, free articles. Join our Telegram channel

Full access? Get Clinical Tree


