Gene
Name
Function
Chromosome
Odds ratio
PPARG
Peroxisome proliferator-activated receptor ϒ
Regulates adipocyte differentiation
3
1.19
KCNJ11
Potassium inwardly rectifying channel, subfamily J, member 11
Part of the sulfonylurea receptor complex and therefore important in insulin secretion
11
1.14
TCF7L2
Transcription factor 7-like 2
Encodes a transcription factor that regulates proglucagon gene expression in the intestine
10
1.37
SLC30A8
Solute carrier family 30 (zinc transporter), member 8
Zinc transporter involved in insulin storage and secretion
8
1.12
HHEX
Hematopoietically expressed homeobox
Transcription factor that is important in pancreatic development
10
1.13
KCNQ1
Potassium voltage-gated channel, KQT-like subfamily, member 1
Encodes protein for potassium channel
11
1.42
The gene encoding transcription factor 7-like 2 (TCF7L2) on chromosome 10q, and its association with type 2 diabetes, was discovered in 2006 [4]. Subsequent analysis of data from the Diabetes Prevention Program suggested that the diabetes-associated allele(s) at this locus increased the risk of progression to diabetes and impaired post-challenge insulin secretion [5, 6].
An alanine substitution (Pro12ala) in the peroxisome proliferator-activated receptor γ (PPARG) gene has been found to confer a 20 % reduced risk of developing diabetes compared to the more common proline homozygotes [7]. Despite the modest contribution to the risk of diabetes, the PPAR-γ receptor is a proven therapeutic target with significant effects on glycemic control. Another therapeutic target is KCNJ11, an ATP-sensitive potassium channel involved in the depolarization of the β cell, leading to insulin release. Sulfonylureas can activate these channels and are used in forms of congenital diabetes where there is an activating gene mutation causing loss of depolarization [8]. KCNQ1 is a gene that encodes a potassium channel protein and mutations in this have been shown to increase the risk of type 2 diabetes in predominantly Asian populations [9].
As noted above, type 2 diabetes is a polygenic disorder with a strong environmental influence. Several monogenic forms of diabetes have also been identified, including maturity-onset diabetes of the young (MODY) and maternally inherited diabetes and deafness (MIDD). The MODY subtypes share the common characteristics of autosomal dominant inheritance associated with early age of onset of diabetes that is not associated with obesity and, at least initially, is not insulin-requiring. The MODY genes may provide useful insights into the physiology of glucose homeostasis—for example a mutation in glucokinase (MODY2), the enzyme necessary for phosphorylation of glucose, alters the set-point for insulin secretion. European studies have estimated that up to 5 % of patients with type 2 diabetes may in fact have MODY [10].
A small group of patients may have diabetes associated with rare genetic syndromes, including the congenital loss of β cells, pancreatic developmental disorders, and inborn errors of metabolism. Chromosomal disorders such as Turner and Klinefelter syndromes are associated with a higher prevalence of diabetes, in the latter thought partly due to concomitant obesity [11].
3.2 Interaction Between Defects in Insulin Secretion and Insulin Action
Insulin inhibits hepatic glucose production and stimulates glucose uptake in the skeletal muscle. It also stimulates intravascular lipolysis and lipogenesis in the adipose tissue, inhibits lipolysis in adipose tissue and inhibits the production of very low-density lipoprotein (VLDL) in the liver. The net effect of these actions is to lower serum glucose, fatty acid and triglyceride concentrations and to increase lipoprotein lipase activity in the adipocyte. When insulin is unable to perform these actions at concentrations that are normally adequate, a state of insulin resistance is reached.
The relationship between insulin secretion and insulin action has been widely studied and the debate continues as to which one precedes the other in type 2 diabetes. Individuals with impaired fasting glucose (IFG) have been shown to have a similar inverse relationship between insulin secretion and action but their disposition index (a marker of β-cell function) decreases with increasing fasting glucose, suggesting that there is no fixed glucose threshold above which β-cell function deteriorates [12]. This also implies that these defects are seen earlier than the current accepted definitions of impaired fasting glucose, which may in turn have therapeutic implications. Others have noted phenotypic differences between individuals in whom the primary defect is β-cell dysfunction (lean diabetic) and those who have a defect in tissue sensitivity to insulin (obese diabetic) [13], although this is not a reliable clinical tool.
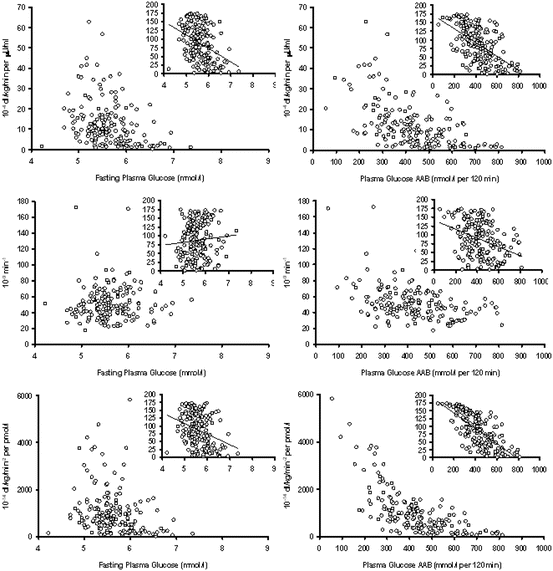
Physiologic studies on individuals with impaired glucose tolerance (IGT) have also confirmed defects in both insulin secretion and insulin action (Fig. 3.1). Hepatic insulin resistance along with impairment in first phase insulin secretion accounts for fasting hyperglycemia seen in IFG [14], although heterogeneity in insulin sensitivity within this group has led to some authors reporting abnormal peripheral insulin sensitivity as well [15]. Individuals with IGT have reduced second-phase insulin secretion (by about 30 % when compared IFG) and greater insulin resistance at the level of the skeletal muscle [14, 16]. Hence IFG and IGT are distinct metabolic entities and the defects of insulin secretion and action are additive in individuals with combined IFG and IGT. These conclusions seem to hold true even when various methodologies for quantifying insulin secretion and measuring insulin action are taken into account. In addition, for a given percentage body fat, women show decreased insulin action when compared to men highlighting the contribution of gender on glucose metabolism [2].


Fig. 3.1
Relationship of insulin action (Si, top panel), insulin secretion (ɸ, middle panel), and disposition index (DI, lower panel) with fasting glucose concentrations (left) and area above basal after oral glucose challenge (right). The inset panels represent the rank transformed values of Si, ɸ, and DI plotted against fasting and area above basal glucose values. Reproduced with permission from Sathananthan et al. Clinical Endocrinology (2012) 76, 212–219
In type 2 diabetes, fasting hyperglycemia is primarily due to an increase in endogenous hepatic glucose production (EGP). In the post-prandial state, the cause for hyperglycemia is multifactorial. Inadequate suppression of EGP leads to hyperglycemia, which in large part is due to hepatic insulin resistance [17]. The severity of hepatic insulin resistance has been shown to positively correlate with liver triglyceride content [18]. Insulin resistance at the level of the skeletal muscle also reduces the peripheral uptake of glucose, though this is probably a secondary contributory mechanism . Multiple defects in the insulin signaling cascade have been identified, and insulin-enhanced glucose uptake mediated by glucose transporter 4 (GLUT-4) is diminished [19]. Additionally, insulin action in the liver and peripheral tissues is inhibited by higher circulating concentrations of free fatty acids and triglycerides.
Peripheral insulin concentrations are reflective of pancreatic insulin secretion after having undergone hepatic extraction, which in turn is affected by obesity, ethnicity, and β-cell function [20]. Hepatic insulin extraction is decreased in individuals with type 2 diabetes, thus contributing to peripheral hyperinsulinemia.
Perhaps the best way to characterize the pathogenic mechanisms is via lessons learnt from longitudinal studies involving patients that progress from normal glucose tolerance (NGT) to IGT to type 2 diabetes. The 10 years cumulative incidence of diabetes in individuals with fasting plasma glucose (FPG) in the 100–109 mg/dL range is about 10 %, while that risk doubles if FPG is between 110 and 125 mg/dL [21]. This suggests a continuum in β-cell dysfunction, which is characterized by the progressive loss of the β-cell’s ability to compensate for increases in glucose concentrations.
The evolution of a predisposed individual toward diabetes has been studied in large prospective trials. When Pima Indians with NGT were followed over a 5-year period, progressors to diabetes were on average heavier, and showed a faster decline in insulin-stimulated glucose disposal and insulin secretion when compared to non-progressors suggesting that defects in both insulin secretion and action were early occurrences in the pathogenesis of type 2 diabetes [22]. These have been shown to happen between 3 and 6 years before the actual diagnosis of diabetes and are accelerated by weight gain [23].
3.3 Bihormonal Defects and Their Role in the Pathogenesis of Hyperglycemia
In the post-prandial state, type 2 diabetes is characterized by unsuppressed glucagon production and delayed and defective insulin secretion. The main stimulus for insulin secretion and its regulation is the prevailing glucose concentration. Additionally, circulating amino acids, free fatty acids and incretins augment insulin secretion, while catecholamines, cortisol, growth hormone, leptin and tumor necrosis factor-α reduce β-cell response.
Insulin is usually secreted in a pulsatile manner and the amplitude or frequency of pulses increase in response to appropriate stimuli. In people with impaired glucose tolerance and type 2 diabetes, this pulsatility is disordered resulting in inappropriate insulin concentrations for the level of prevailing glucose. Disordered pulsatility also decreases expression of multiple mediators of the insulin signaling cascade [24].
Both prolonged and acute exposure to hyperglycemia adversely affects β-cell function, in part through chronic oxidative stress, with resulting impairment in insulin gene expression and β-cell apoptosis [25]. Low birth weight infants are more susceptible to developing diabetes; one hypothesis is that in utero malnutrition may prime the β cell to adapt poorly to subsequent states of over-nutrition [26].
Individuals with type 2 diabetes also have elevated circulating free fatty acid concentrations which impair β-cell function . Histologically, these islet cells are deposited with amyloid, but these changes interestingly are only subsequent to and do not precede, the defects in insulin secretion [27]. β-cell mass in individuals with type 2 diabetes is also decreased by about 30 %, when compared to non-obese non-diabetic individuals [28].
Αlpha-cell mass in the pancreas remains relatively unchanged, and evidence of α-cell dysfunction is seen through impaired glucagon suppression by hyperglycemia and diminished responses to hypoglycemia [29]. It is uncertain whether this results from an inherent defect in the α-cells of people with type 2 diabetes or a manifestation of decreased intra-islet insulin that would normally suppress glucagon secretion.
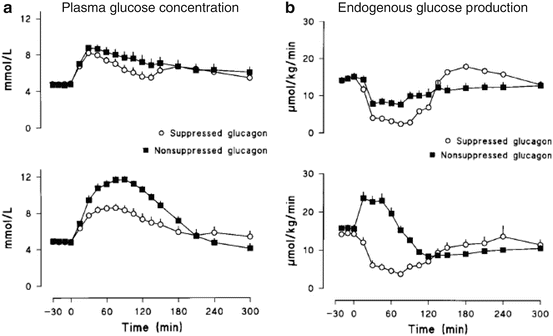
Shah et al. showed that in response to a mixed meal, impaired glucose tolerance was a result of the lack of glucagon suppression in the presence of relative insulin insufficiency, as seen in the diabetic state (Fig. 3.2) [30]. Further studies using infusions of [1-14C] labeled galactose confirmed this to be mainly as a result of glycogenolysis [31].


Fig. 3.2
Non-diabetic subjects were infused with a prandial glucose infusion and insulin was infused to mimic a “diabetic” panel B or “non-diabetic” panel A post-prandial profile. Glucagon was then infused at time zero to prevent a fall in glucagon (non-suppressed) or at 2 h to allow a transient fall in glucagon (suppressed). During the “diabetic” insulin profile, lack of glucagon suppression resulted in a marked increase in both the peak glucose concentration and the area above basal of glucose because of impaired suppression of glucose production. Reproduced with permission from Shah et al. Am J Physiol Endocrinol Metab 277:E283–E290, 1999
Incretin hormones, released by the L cells of the small intestine in response to an enteral nutrient load, augment insulin release and are trophic to β cells. Lower concentrations of incretins such as glucagon-like peptide 1 (GLP-1) and gastric inhibitory polypeptide (GIP) have been observed in people with impaired fasting glucose, impaired glucose tolerance and in people with type 2 diabetes [32]. However it is more likely that these changes are a consequence of, and not a cause of the diabetic state and their role in the pathogenesis of type 2 diabetes continues to be debated [33, 34].
3.4 Defects in Carbohydrate Metabolism in Type 2 Diabetes
There is a prolonged elevation of glucose concentrations following a carbohydrate-containing meal in people with type 2 diabetes, and this is a result of a multitude of factors. There is a failure of suppression of EGP in the immediate post-prandial period. Additionally, it takes longer for EGP to reach nadir levels when compared to individuals without diabetes [35]. Post-prandially, the main sources of glucose are from hepatic gluconeogenesis and glycogenolysis, as the rate of appearance of ingested glucose is no different from normal individuals [36]. Both sources of EGP are increased early on in diabetes, perhaps gluconeogenesis to a greater degree [37]. To answer the question if the increase in EGP is due to hepatic insulin resistance, Basu et al. studied individuals with and without type 2 diabetes in a hyperglycemic state while insulin was infused at concentrations that spanned the physiologic range [38]. As expected, EGP was higher in the group with diabetes when compared to those without diabetes at lower and higher concentrations of insulin, suggesting hepatic insulin resistance. Additionally, the liver is also resistant to the inhibitory effect of hyperglycemia per se.
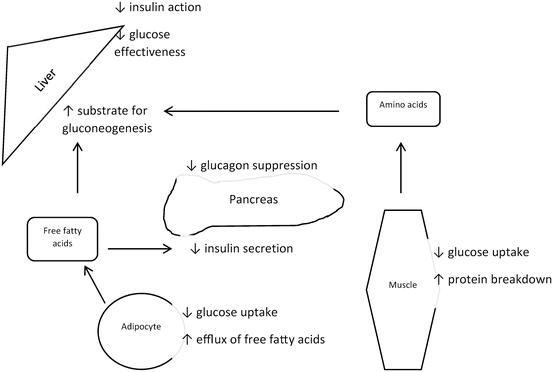
The rate of glucose disappearance is lower in people with type 2 diabetes, and this is due to decreases in both splanchnic and muscle glucose uptake with defects in glucokinase activity likely accounting for the former [39]. Delays in insulin secretion after a meal, as seen in type 2 diabetes, results in higher peak glucose concentrations whereas insulin resistance prolongs hyperglycemia [40]. Therefore, defects in both insulin secretion and action work in concert to promote higher post-prandial glucose concentrations (Fig. 3.3).


Fig. 3.3
Principle defects in type 2 diabetes. (1) Decreased insulin secretion (DeFronzo RA, et al.: New concepts in the pathogenesis and treatment of non-insulin-dependent diabetes mellitus. Am J Med 75:52–81, 1983). (2) Decreased insulin action (DeFronzo RA, et al.: Effects of insulin on peripheral and splanchnic glucose metabolism in non-insulin-dependent (type II) diabetes mellitus. J Clin Invest 76:149–55, 1985). (3) Decreased glucagon suppression (Shah P, et al.: Impact of lack of suppression of glucagon on glucose tolerance in humans. Am J Physiol Endocrinol Metab 277:E283–E290, 1999). (4) Decreased glucose effectiveness (Basu A, et al.: Impaired Basal Glucose Effectiveness in NIDDM: Contribution of Defects in Glucose Disappearance and Production, Measured Using an Optimized Minimal Model Independent Protocol. Diabetes 46:421–432, 1997)
Glucose is an important regulator of its own metabolism, a phenomenon termed “glucose effectiveness.” When non-diabetic individuals were infused with 35 g of intravenous glucose while their basal insulin levels were clamped, they exhibited a modest rise in plasma glucose concentrations, unlike the stark hyperglycemia seen in patients with type 2 diabetes. This was found to be due to impaired glucose-induced stimulation of glucose uptake and not glucose-induced suppression of glucose production [41]. This regulatory mechanism is lost in people with type 2 diabetes, further contributing to the hyperglycemic state.
3.5 Defects in Protein Metabolism in Type 2 Diabetes
In contrast to its effect on fat and glucose metabolism, the effects of insulin on whole-body protein synthesis and breakdown appear to be much more diminutive in individuals with type 2 diabetes [42]. This is quite different from individuals with type 1 diabetes, where absolute insulin deficiency results in whole body protein catabolism and defects in skeletal muscle protein synthesis [43]. When free fatty acids are infused to induce insulin resistance, there is a decreased rate of protein breakdown but little to no effect on the rate of protein synthesis as measured by the rate of protein disappearance [44]. There also seems to be post-absorptive insulin resistance of regional protein metabolism, although adiposity and elevated free fatty acid concentrations alone may have contributory roles independent of insulin action [45, 46]. In men, the degree of hyperglycemia seems to correlate directly with increased protein turnover and while this is not evident in women, the presence of lower body obesity seems protective [47]. The mechanisms by which this occurs is unclear-fatty acids and their metabolites may impact protein metabolism by their effects on the insulin signaling pathway, but other human studies have shown this to be independent of the insulin signaling cascade [48].
Stay updated, free articles. Join our Telegram channel

Full access? Get Clinical Tree


