The Effect of Splenectomy
Following splenectomy, red cell survival has been found to be normal in humans and rabbits (Miescher 1956a; McFadzean et al. 1958), although slightly prolonged in rats (Belcher and Harris 1959). Splenectomy prolongs the survival of red cells with disordered membrane proteins; however, red cell survival differs depending on the specific hereditary defect (Reliene et al. 2002).
The Effect of Plethora
Although it is sometimes tacitly assumed that subjects rendered plethoric by transfusion suffer increased destruction of red cells, in fact no evidence of this exists. In newborn infants with a packed cell volume (PCV) as high as 0.64 after transfusion the survival of transfused red cells is normal (Mollison 1943, 1951, p. 111).
Estimation of Survival Using 51CR
Red cells can be labelled with 51Cr by incubating them with radioactive sodium chromate (Gray and Sterling 1950). Radioactive chromate diffuses through the membrane via the band 3 anion channel and binds predominantly to the β-chains of Hb (Pearson and Vertrees 1961).
The method of 51Cr labelling has two great advantages over that of differential agglutination: (1) the subject’s own red cells can be labelled; and (2) the survival of very small volumes (0.1 ml or less) of red cells can be studied. Furthermore, sites of red cell sequestration can be identified using surface counting, the degree of intravascular haemolysis can be estimated in short-term tests (see Chapter 10), and blood loss in the stools can be estimated. 51Cr liberated from red cells, destroyed either within the bloodstream or within the mononuclear phagocyte system, is not re-utilized. Unfortunately, the 51Cr method suffers from several serious disadvantages: survival curves have to be corrected for elution of 51Cr from intact cells to obtain estimates of true red cell survival. Furthermore, the high doses required for detection and the long half-life all place limitations on serial survival studies and scanning for sites of sequestration. Serial recovery studies are possible if the first is performed with a low dose (5 µCi); successively higher doses are used with the subsequent re-infusions, and adjustment for background is made in the analysis.
51Cr elutes from red cells at the rate of approximately 1% per day. In addition, during the first 2 or 3 days (mainly during the first 24 h) there is additional, so-called ‘early loss’ (Mollison and Veall 1955) so that normal 51Cr survival at 24 h is only about 96% (instead of about 98%) of the 10-min value (see below). The rate at which 51Cr elutes from red cells is affected by the technique of labelling (Mollison 1961a; Szymanski and Valeri 1970). With studies of stored red cells, 24-h survival data are expressed without correcting for elution (Moroff et al. 1999).
Two methods of labelling have been shown to give similar results, namely the ‘citrate wash’ method (Mollison 1961b; Garby and Mollison 1971) and an acid–citrate–dextrose (ACD) method in which packed red cells are labelled (Bentley et al. 1974). Both of these methods have been recommended by ICSH (1971, 1980), but the ACD method is more convenient and has therefore been selected as the reference method (see Appendix 2 for details). Table 9.1 gives values for 51Cr survival obtained using the citrate wash method. The table also gives factors that convert observed 51Cr values on any particular day to true red cell survival, assuming that the normal mean lifespan is 115 days. The results thus corrected for 51Cr elution are then analysed as described in Appendix 6.
Table 9.1 Mean 51CR survival in normal subjects and correction factors which convert the 51CR survival into ‘true’ red cell survival (mean red cell lifespan 115 days) when the ‘citrate wash’ method is used*.
Source: Garby and Mollison 1971. Reproduced with permission of John Wiley & Sons Ltd.
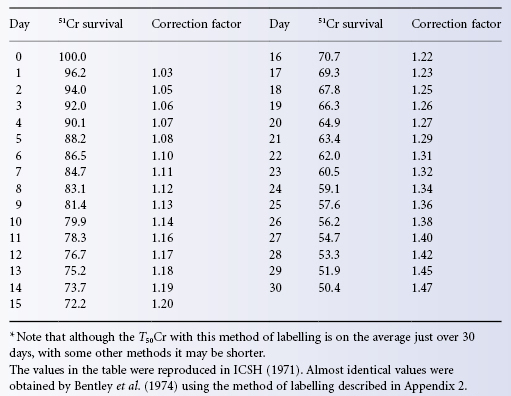
Using the ACD method recommended by ICSH, similar correction factors were derived. This finding is reassuring, because the factors were derived from a comparison between the results of 51Cr and di-isopropyl phosphofluoridate (DFP) labelling, whereas the factors given in Table 9.1 were obtained by comparing 51Cr results with those expected from normal survival. Furthermore, the figures in Table 9.1 were derived from the survival of allogeneic red cells, whereas those of Bentley and co-workers were based on autologous red cell survival.
In another recommended method, after incubating ACD or CPD blood with Na251CrO4, ascorbic acid is added to reduce hexavalent 51Cr to the trivalent form and thus stop any further uptake, and the whole mixture is then injected. However, after 15 min of incubation of red cells with Na251CrO4 at 37°C, uptake of 51Cr is virtually arrested, even when ascorbic acid is not added, so that the value of adding ascorbic acid is doubtful. The disadvantage of the method compared with methods in which washed red cells are injected is that accurate estimates of red cell volume require that the amount of 51Cr in the supernatant of the injection suspension be measured and allowed for. Also, even when only red cell survival is being measured, the amount of 51Cr in the plasma of samples drawn within the first 24 h must be estimated. Finally, ascorbate may damage red cells with certain metabolic abnormalities, particularly those with glucose-6 phosphate dehydrogenase deficiency (Beutler 1957).
Half-life (T1/2) is not an accurate term to describe red cell survival kinetics. The curvilinear slope of 51Cr survival in normal subjects cannot be fitted by a simple exponential and the time taken for survival to fall to 50% of its original value should be expressed as the T50 (‘half-survival’), not the T1/2.
The mean normal T50Cr is about 31 days and in 95% of healthy subjects falls within the range 25–37 days (Mollison 1981). When T5051Cr is less than 25 days it is best to correct results for 51Cr elution and deduce mean red cell lifespan (ICSH 1971, 1980) using the method of analysis described in Appendix 6. As Table 9.2 shows, the T5051Cr is not a satisfactory index of red cell destruction as it bears no simple relation to mean red cell lifespan.
Table 9.2 Relation between T50CR, derived red cell lifespan and relative rate of 51CR elution is normal, i.e. about 1% per day).
Source: Mollison 1981. Reproduced with permission of the American Association of Blood Banks.
| T50Cr (days) | Mean red cell life span (days) | Rate of red cell destruction |
| 31 | 115 | ×1 |
| 23 | 54* | ×2 |
| 18 | 38* | ×3 |
| 14 | 27* | ×4 |
* Destruction assumed to be random.
Note that when 51Cr survival is within normal limits, correction factors should not be applied in the hope of securing a good estimate of true red cell survival. When survival is within normal limits, the daily loss of 51Cr by elution is approximately equal to the daily loss of red cells and variations in the rate of 51Cr elution therefore have a relatively large effect on the estimate of true survival.
The rate of 51Cr elution in healthy subjects was found to vary from 0.70% to 1.55% per day (mean 1.0, SD 0.07) by Bentley and co-workers (1974). In patients with haematological diseases, values of between 0.6% and 2.3% per day were found by Cline and Berlin, and between 0.6% and 2.0% by Garby and Mollison (Cline and Berlin 1962; Garby and Mollison 1971). These figures for the variability of elution must somewhat overestimate the true variability, as they are derived from a comparison of estimates of 51Cr and DFP survival and are thus affected by the error of both estimates.
In a wide variety of diseases, estimation of red cell lifespan based on 51Cr measurements corrected for elution agrees well with DFP measurements (Eernisse and van Rood 1961; Finke et al. 1965; Garby and Mollison 1971). As expected, though, the 51Cr method is insensitive in detecting slight increases in red cell destruction (Cline and Berlin 1963b; Finke et al. 1965).
Early Loss
There is a great deal of evidence that ‘early loss’ of 51Cr is not due to damage to red cells during labelling or washing; the extent of the loss is not related to the dose of 51Cr used, nor to the number of times the cells have been washed. Moreover, the same early loss is observed when red cells are labelled in vivo by injecting a small dose of Na251CrO4 intravenously (Hughes-Jones and Mollison 1956). Further evidence was supplied by Kleine and Heimpel (1965) in experiments in which red cells were labelled with DF32P in a donor from whom a sample was taken 48 h later. The cells were now also labelled with 51Cr. After cell injection into a recipient, the loss of 51Cr exceeded that of DF32P by about 5% in 24 h. Presumably, ‘early loss’ is due to the relatively loose binding of a small fraction of 51Cr.
Toxic Effect of Chromate on Red Cells
Na251CrO4 is available with a specific activity of 7 × 10⁹ Bq (20 mCi)/mg. Even when 2 mBq of 51Cr is used to label as little as 0.2 ml of red cells, the dosage of chromate, expressed as the dose of 51Cr, will only be about 5 µg/ml of red cells. No effect on red cell survival has been noted at doses up to 20 µg 51Cr/ml cells, although abnormal survival curves have been found when 35 µg 51Cr/ml cells or more are used (Donohue et al. 1955; Hughes-Jones and Mollison 1956).
51CR Survival in the Very Young and the Very Old
Red Cells of Newborn Infants
The following values for the T5051Cr have been recorded: 20 days (Hollingsworth 1955); 22.8 days compared with 27.5 for adults (Foconi and Sjölin 1959); 24 days compared with 30 days for adults (Gilardi and Miescher 1957); 17.5 days compared with 25 days for adults (E Giblett, unpublished observations, 1955). The T5051Cr of red cells from premature infants injected into adults was found to be 15.8 days by Foconi and Sjölin (Foconi and Sjölin 1959) and to be 16 days by Gilardi and Miescher (1957).
In Children Aged 2.5 Years or More
51Cr survival is the same as in adults (Remenchik et al. 1958).
51CR Red Cell Survival in Elderly Subjects
51Cr red cell survival was found to be normal in five patients aged 70–90 years by Miescher and co-workers (1958), in 10 men and 12 women aged 80–94 years by Woodfield-Williams and co-workers (Woodfield et al. 1986), and in 11 subjects aged 70–90 years by Hurdle and Rosin (1962).
Use of Non-Radioactive Chromium (52CR)
Human red cells contain about 0.8 µg 51Cr/l cells. Following incubation with Na252CrO4, i.e. ordinary non-radioactive sodium chromate, they readily take up large amounts of 51Cr. Although glutathione reductase is slightly inhibited at 51Cr levels as low as 2 µg/ml of red cells, no effect on red cell survival has been noted at levels up to 20 µg/ml of cells (see above). Following the injection of about 20 ml of packed red cells labelled with a total of about 40 µg of 51Cr (2 µg/ml of red cells), in a subject with a total circulating red cell volume of 2 litres, the concentration of Cr is expected to be 20 µg/l of cells, i.e. 20 times the normal level. Using Zeeman electrothermal adsorption spectrophotometry, with a graphite furnace attachment, Cr concentrations between 1 and 7 µg/l can be estimated with a coefficient of variation of 4.7% (Heaton et al. 1989a). When red cell volume was estimated using 52Cr, results were similar to those observed with 51Cr-labelled red cells or with estimates deduced from plasma volume. Similarly, estimates of the 24-h survival of stored red cells agree with those based on 51Cr labelling (Heaton et al. 1989a,b). In another study, in which red cells in 130 ml of blood was labelled with a total of 250 µg of 52Cr, and results compared with those obtained with 51Cr in the same subjects, the T50Cr values by the two methods were almost identical (Sioufi et al. 1990). Although the idea of using non-radioactive Cr is attractive, the need to use relatively large volumes of red cells, the somewhat elaborate technology and the relative inaccuracy make the method in its present form less attractive than the use of 51Cr.
Other Methods of Random Labelling of Red Cells
Use of Di-Isopropyl Phosphofluoridate
Di-isopropyl phosphofluoridate (DFP) binds to a serine residue of membrane cholinesterase in red cells and other cells such as platelets, and also binds to plasma cholinesterase. DFP has been used to label red cells in vitro, using 3H-DFP (Cline and Berlin 1963a) or DF32P (Bratteby and Wadman 1968). With the latter, as the maximum amount of DFP that binds irreversibly to red cells is about 0.15 µg/ml cells and as the maximum available specific activity of DF32P is about 400 µCi/mg (14.8 MBq/mg), at least 50 ml of red cells must be labelled if not less than 2 µCi (74 kBq) are to be injected. In most experiments, DF32P has been injected intravenously, thus labelling the whole red cell mass. Some 4% of the label is lost in the first 24 h, probably as a result of the labelling process, but thereafter no loss is detectable. Some of the loss in the first 24 h may be due to labelling of leucocytes and platelets, but almost all the injected DF32P is bound by red cells. Using a linear fit, estimates of mean red cell lifespan have been close to 120 days (Cohen and Warringa 1954; Bove and Ebaugh 1958; Garby 1962; Heimpel et al. 1964; Bentley et al. 1974).
Biotinylation
Biotin is a water-soluble member of the vitamin B complex and is found predominantly within the cell. Biotin has a very high binding affinity for avidin, a protein found in egg white and in bacteria. The binding between biotin and avidin is rapid and sufficiently tight as to be irreversible for weeks. The unusually high binding constant between biotin and avidin allows red cells that have been labelled with biotin to be diluted after injection in vivo and subsequently quantified accurately with avidin tagged with either a radioactive isotope or a fluorochrome such as fluorescein. When rabbit red cells were treated in this way, estimates of red cell survival were similar to those obtained with 14C-cyanate (Suzuki and Dale 1987). The method has been applied to the selective extraction of aged red cells from the circulation of rabbits whose red cells were labelled 50 days beforehand to investigate the relationship between red cell age and density (Dale and Norenberg 1990).
In a study in which human red cells were labelled with biotin in vitro and then used to estimate total circulating red cell volume, estimates agreed well, in most cases, with simultaneous estimates made with 51Cr. Cavill and co-workers (1988) found biotin labelling unsuitable for estimating red cell survival: in some cases all of the label disappeared within 1 week, a result that was associated with the subject’s recent consumption of eggs, which are rich in avidin. These results may be related to the method of labelling (see below). Biotin has been used to label murine red cells both in vitro and in vivo, giving similar values for red cell lifespan (Hoffman-Fezer et al. 1993). Mock and co-workers (1999) found biotin labelling to be an accurate method to measure red cell survival in humans. In subsequent studies, aliquots of autologous RBCs from eight healthy adult subjects were labelled separately at four discrete biotin densities, infused, and followed with serial samples (Mock et al. 2011). The proportion of each population of biotinylated red blood cells circulating was determined serially by flow cytometry over 20 weeks. Red cells labelled at all four biotin densities accurately measured posttransfusion recovery of red blood cells after 24 hours in the circulation in agreement with 51Cr results reported by Mollison. The two lowest biotin densities were able to quantitate long-term red cell survival in agreement with results reported earlier by Bentley and coworkers (1974). A major advantage of biotin method is absence of exposure to radiation, which makes it particularly suitable for infants, children, and for gravid women. Furthermore multiple independent red cell measurements can be made simultaneously in the same individual. However, biotin labelling can alter red cell antigens (Cowley et al. 1999). Furthermore, three out of 20 subjects who had labelling studies performed developed transient IgG antibodies directed against biotin-coated red cells (Cordle et al. 1999). The clinical significance of these antibodies is unknown, as is the chance that they will limit the use of this method for serial survival studies. There is currently no evidence of toxicity from the biotin label.
99MTC and 111IN
Technetium (99mTc) is a useful label for red cell volume determinations (see below), but its short half-life and elution characteristics make it unsuitable for recovery studies, let alone determination of red cell survival. Indium (111In) has been used as a red cell label, but it elutes more readily and less predictably than does 51Cr which makes it somewhat less accurate (AuBuchon and Brightman 1989). However, its higher emission energy permits imaging of the site of cell sequestration when that is desired with a lower dose than that of 51Cr.
Use of HB Variants Differing Between Donor and Recipient
The survival of normal red cells transfused to patients with haemoglobinopathies, particularly sickle cell and HbC disease, can be studied by preparing haemolysates, separating normal from abnormal Hb by electrophoresis and estimating the amount of each type. Like the method of differential agglutination, this method is particularly useful when the decision to estimate red cell survival is made after transfusion. It can also be used when, because of serological similarities between donor and recipient, differential agglutination is impracticable. The method has the added advantage of not involving exposure to radioactivity (Restrepo and Chaplin 1962). Sensitive automated analysis can detect small differences in Hb variants extremely accurately (Mario et al. 1997).
Methods of Labelling a ‘Cohort’ of Red Cells
By a ‘cohort’ is meant a population produced over a limited period of time. Cohort labelling is primarily an investigative tool for determining normal red cell lifespan and reduction of survival in hereditary red cell disorders. A cohort of cells can be labelled by pulse injection of the iron isotope 59Fe to normal subjects and withdrawal of a blood sample about 5 days later. However, an unacceptably large amount of radioactivity has to be used and extensive re-utilization of iron occurs with this method (Ricketts et al. 1977).
Reticulocytes will take up iron in vitro (Walsh et al. 1949) and cells labelled in this way have been used successfully to demonstrate the destruction of red cells by alloantibodies and to investigate the subsequent fate of the labelled Hb (Jandl et al. 1957).
Use of 15N-Labelled Glycine and of 14C-Labelled Compounds
A subject’s own red cells can be labelled by administering oral 15N-glycine, the glycine being incorporated into the haem of newly synthesized Hb. The concentration of labelled nitrogen per unit mass of red cells does not reach its peak for about 25 days, begins to fall on about the eightieth day and then declines steeply. The interval between the mid-point of the rise and the declining portion of the graph was determined to be 127 days, and this value was defined as the average lifetime of the cells (Shemin 1946).
Although it was originally believed that Hb, and thus 15N, could not be lost from intact red cells, the decrease in labelled haem which began about 60 days after peak values had been reached suggests that label is, in fact, lost (Mollison 1961a, p. 173). There is now direct evidence that red cells lose Hb during their lifespan (van der Vegt et al. 1985b), most likely in the form of microvesicles. Because of the relatively slow incorporation of labelled haem, the loss of label from intact red cells and the re-utilization of the label, measurements with 15N-glycine, although providing valuable information about Hb metabolism, do not add anything important to knowledge of the lifespan of human red cells. Measurements with glycine-2-14C in human subjects (Berlin et al. 1954) indicate that the method is open to the same criticisms that apply to the 15N method.
Use of DF32P
Cohort labelling with DF32P was achieved by first injecting a large dose of unlabelled DFP to produce a temporary block of further uptake, and 6–9 days later, when new (unblocked) red cells had been produced, injecting DF32P. Using this method, red cells produced in response to acute blood loss were shown to have a survival time which was distinctly shorter than that of normal red cells (Neuberger and Niven 1951; Cline and Berlin 1962).
Summary of Normal Survival of Red Cells
There are several reasons why generally acceptable values for the mean and range of true red cell survival in normal subjects have not yet been established: the number of studies is not large, many different techniques have been used and, perhaps above all, the data have been interpreted in many different ways. The main difficulty is that the disappearance curve of the red cells is not, as a rule, defined with sufficient precision so that it is usually not possible to determine whether the points should be fitted by a straight line or a curvilinear slope. Even a minor degree of curvilinearity implies a substantially lower mean survival time (Mills 1946). Accordingly, if a straight line is fitted to points that really fall on a slightly curvilinear slope, mean cell life is overestimated.
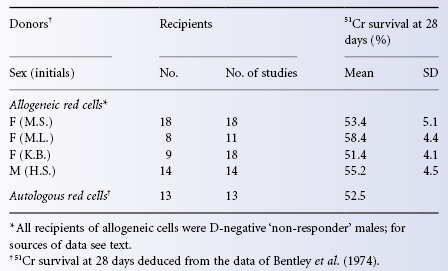
The survival of transfused (allogeneic) red cells differs little if at all from that of autologous red cells, as shown by the close similarity of results obtained with differential agglutination and (using autologous red cells) with DF32P. The same point is made in Table 9.3, which compares the survival of 51Cr-labelled allogeneic and autologous red cells. All the estimates for allogeneic cells are of the survival of D-positive red cells from one of four donors in selected D-negative recipients who failed to make anti-D after at least two injections of D-positive red cells given at an interval of 5–6 months and were judged to be non-responders (Mollison 1981). The figure for the survival of autologous red cells is deduced from the data of Bentley and co-workers (1974).
Table 9.3 Survival of allogeneic and autologous red cells labelled with 51CR.
Source: Mollison 1981. Reproduced with permission of the American Association of Blood Banks.
Rapid Destruction of Transfused Red Cells in Certain Haemolytic Anaemias
The shorter the red cell survival, the less important are the technical inaccuracies of the labelling method. In all of those conditions in which a haemolytic anaemia is due to some extrinsic mechanism rather than to any intrinsic red cell defect, transfused normal red cells are expected to undergo accelerated destruction. Nevertheless, if the donor’s red cells are compatible with the autoantibody in the recipient’s circulation, their survival may be almost normal (see Chapter 7). In haemolytic anaemia associated with potent cold autoagglutinins, when normal (I-positive) red cells are transfused, they undergo rapid destruction until the C3 bound to them by anti-I has been cleaved, leaving only C3d,g on their surface (see Chapter 10).
Diminished Survival of Transfused Red Cells in Aplastic Anaemia
In aplastic anaemia, the survival of the patient’s own red cells is usually moderately reduced and this reduction is not due to haemorrhage (Lewis 1962). In a case reported by Loeb and co-workers (1953), the survival of transfused red cells was moderately reduced, as it was in the case illustrated later in the text (see Figure 9.7). The reduced survival of the patient’s own red cells is presumably due to dyserythropoiesis (Cavill et al. 1977), but the reduced survival of transfused red cells has not been explained.
Increased Red Cell Destruction in Fever
Fever, resulting from the intravenous injection of pyrogen, the intramuscular injection of heated milk or from external heating results in an increase in red cell destruction, affecting old red cells more than young ones (Karle 1969).
Diminished Survival of Red Cells Due to Haemorrhage
Loss of Blood in the Stools
In patients with a low platelet count, poor survival of transfused red cells may be due not to haemolysis but to chronic bleeding into the gastrointestinal tract. If 51Cr-labelled red cells are injected into the circulation, the amount of blood lost in the stools can be measured by estimating faecal 51Cr content. Correction for blood loss can then be applied so as to discover whether the survival curve, corrected in this way, is normal. According to Hughes-Jones (1958a), the normal daily loss of blood in the stools is about 0.5 ml (or 0.2 ml of red cells); this figure is a little lower than that obtained by Ebaugh and Beekin (1959) who, using a quantitative benzidine method, estimated the daily loss as 2 ml of whole blood.
Loss of Blood by Venous Sampling
Corrections are also needed if substantial amounts of blood are withdrawn during the course of estimating red cell survival. When the amount of blood lost from the circulation is x% of the blood volume, the corrected survival is calculated by:
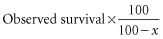
This is the appropriate correction whatever the percentage of surviving cells at the time the sample is taken (Mollison 1961a, p. 208).
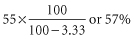
Suppose 51Cr-labelled cells are injected into a subject whose blood volume is 4500 ml. By the 20th day after injection, 10 samples each of 15 ml (i.e. total 150 ml or 3.33% of the blood volume) have been withdrawn. The observed 51Cr survival is 55%; corrected survival is:
Hypersplenism
In nine patients with chronic lymphocytic leukaemia with splenomegaly (average splenic weight approximately 2000 g), the mean T50Cr was 21 days, but increased to 27 days by 1 year after splenectomy (Christensen 1971). Similarly, in three patients with cryptogenic splenomegaly, the T50Cr was found to be 15–25 days, but became normal after splenectomy (McFadzean et al. 1958). Red cell survival diminishes in animals when splenomegaly is induced by implanting percorten (Miescher 1956b).
Radionuclide scanning after injection of 51Cr-labelled red cells may provide evidence of splenic sequestration and help to predict the effectiveness of splenectomy for patients with shortened red cell survival (McCurdy and Rath 1958). Monitoring radioactivity over the spleen compared with the liver with reference to a precordium measurement as the neutral ‘blood pool’ may foretell remission after splenectomy in patients with severe autoimmune haemolytic anaemia. However, accurate measurement, analysis and interpretation require experienced hands. Sequestration studies are far less predictive for other causes of shortened red cell survival and for mild, chronic autoimmune haemolysis (Parker et al. 1977).
Survival of Transfused Red Cells in Haemolytic Anaemia Due to an Intrinsic Red Cell Defect
In haemolytic anaemia caused by an inherited red cell defect (e.g. hereditary spherocytosis, haemoglobinopathies and red cell enzyme deficiencies), compatible red cells are expected to survive normally. For example, the survival of transfused red cells from qualified allogeneic donors is entirely normal in hereditary spherocytosis (Dacie and Mollison 1943) and in sickle cell anaemia (Callender et al. 1949).
Although normal survival of transfused red cells has also been described in many patients with thalassaemia major (Evans and Duane 1949; Hamilton et al. 1950), diminished survival has been reported in patients who have been repeatedly transfused. Among 20 children with thalassaemia major who received regular transfusions, many appeared to require transfusion unduly frequently. In six out of seven selected cases, 50% of transfused red cells were eliminated in 5–9 days and, although no blood group antibodies could be detected, low-grade alloimmunization is one likely explanation. After splenectomy, the transfusion requirements were reduced to between one-fifth and one-third (Lichtman et al. 1953). The possible induction of immunological tolerance in children with thalassaemia in whom transfusion is begun early in life is discussed in Chapter 3.
Transfused red cells from healthy donors survive normally in patients with paroxysmal nocturnal haemoglobinuria (Dacie and Firth 1943; Mollison 1947). Erythrocyte microvesicles from stored transfused blood transfer glycophosphatidyl inositol (GPI)-linked proteins in vivo to deficient cells, which may improve survival of the native cells as well (Sloand et al. 2004).
Estimation of Mean Red Cell Lifespan in Haemolytic Anaemia
See Appendix 6.
Storage of Red Cells in the Liquid State
History
The first account of the storage of red cells was published by Fleig (1910); 80 ml of blood was drawn from rabbits and defibrinated. The red cells were washed in isotonic spa water and kept in an icebox for up to 7 days before being returned to the donor animal. A rise in the red cell count following transfusion suggested that some of the red cells were viable.
A Spoonful of Sugar
In 1915, Well (1915) also showed that citrated blood stored in an icebox for several days could be transfused safely to animals. The work of Rous and Turner (1916) established a milestone. As red cells were believed to be impermeable to sugars, different sugars were tested in the hope that their colloid properties might prevent haemolysis. Blood taken from one rabbit, stored for up to 12 days in a citrate–sucrose solution and then transfused to another rabbit that had just been bled, prevented the development of anaemia. When human blood was stored, dextrose was found to be marginally better than sucrose in diminishing lysis. Accordingly, a solution containing dextrose was recommended for the storage of human blood and was soon afterwards used for transfusion (see below). This recommendation proved to be fortunate, because at the time dextrose was not recognized to have the strikingly favourable effect on the metabolism of stored red cells which sucrose lacks. More than 20 years later, the addition of dextrose to citrated blood was found to decrease the rate of hydrolysis of ester phosphorus during storage (Aylward et al. 1940), and the suggestion was made that dextrose exerted its favourable effects by providing energy for the synthesis of phosphate compounds, particularly DPG and ATP (Maizels 1941).
Blood Stocks and Banks
The discoveries of Rous and Turner were put to practical use in the First World War by Robertson (1918). Working with the Allied Expeditionary Forces in Belgium, and during a relatively quiet period, Robertson bled donors into Rous–Turner solution (500 ml of blood added to 350 ml of 3.8% trisodium citrate and 850 ml of 5.4% dextrose). After gravity sedimentation had been allowed to occur in an icebox for 4–5 days, the red cells had settled to a volume of 800 or 900 ml and, after 2 weeks or so, to 500 ml. After removing the supernatant solution, the volume was reconstituted to 1000 ml with 2.5% gelatine in saline. Twenty-two transfusions of this mixture were given to 20 recipients, mainly soldiers suffering from severe haemorrhage. The results were apparently as good as those observed with fresh blood. The usual storage time was from 10 to 14 days, but some units of red cells stored for up to 26 days were transfused. Robertson pointed out that the chief advantage of this system was the great convenience of having a stock of blood at hand for busy times, an advantage which remains to this day.
After the end of the First World War, interest in the storage of blood seems to have evaporated and revived only in the 1930s, first in the Soviet Union. Filatov (1937) reported that by the end of 1936 many thousands of transfusions of stored blood had been given in Leningrad and elsewhere (Filatov 1937). According to Riddell (1939), by about 1937 all large hospitals in Russia were using stored blood almost to the exclusion of fresh blood. Donors attended their local ‘Central Institute’, where blood was taken and stored and distributed to hospitals as required.
The concept of a blood bank (‘it is obvious that one cannot obtain blood unless one has deposited blood’) was formulated by Fantus (1937), who set up the first such bank at Cook County Hospital in Chicago in 1937, although the practice of refrigerated storage probably antedated this by at least 2 years (Lundy et al. 1936). The analogy, appropriate at the time, has proved to be both resilient and regrettable, as on the one hand it links blood with money, whereas on the other, it fails to stress the constant daily need for replenishment. A more accurate comparison might be made with a pipeline or a supply chain (Jones 2003).
The first attempt to supply the transfusion needs of an army in the field seems to have been made during the Spanish Civil War when between August 1936 and January 1939 stored blood was supplied from a centre in Barcelona; 9000 litres of blood was obtained from donors during a period of 2.5 years (Jorda 1939). Only group O donors were used. Blood was drawn into a citrate–glucose solution and six donations, each of about 300 ml, were pooled in a special robust container and stored under a pressure of two atmospheres of air.
The outbreak of the Second World War led to the rapid organization of transfusion services equipped to collect and store whole blood on a large scale. At first, citrate alone was used in many services before the value of adding dextrose was rediscovered. A great deal of further work was then done in an attempt to find better preservative solutions. The main advance that resulted from all this work was the discovery of the value of acidifying the citrate–dextrose solution.
The Acid Test: a Tart Cell Is a Happy Cell
Between 1938 and 1942 several publications confirmed that the rates of efflux of potassium from red cells and of lysis were diminished when blood was stored with an acid diluent (Cotter and McNeal 1938; Jeanneney and Servantie 1939; Maizels 1941; Maizels and Paterson 1940; Wurmser et al. 1942). Nevertheless, no attempt was made to use acidified solutions in clinical practice, mainly because some feared that they might be harmful. The incentive to test acidified solutions for clinical use arose from a major inconvenience in preparing solutions of trisodium citrate and dextrose: when they were autoclaved together, substantial caramelization occurred. When acidified citrate–dextrose solutions were autoclaved, little or no caramelization developed. As it would be simpler and easier to autoclave the entire preservative solution in the blood container rather than to add autoclaved dextrose separately, a systematic study of ACD solutions was carried out by Loutit and co-workers (1943). Blood stored in these solutions produced minimal effects on the recipient’s acid–base balance – in fact it produced a slight alkalosis due to the catabolism of citrate. Additionally and unexpectedly, red cell survival after storage was much improved. These findings led to the immediate introduction of an ACD solution as the standard preservative in the UK (Loutit and Mollison 1943), although ACD came into wider use only after the end of the Second World War.
The work of Rapoport (1947) showed an association between the ATP content of stored red cells and their viability (1947). Later, Gabrio and co-workers (1955a,b) found that the ATP content of stored red cells could be restored almost completely by incubation with adenosine and that restoration of the ATP content was accompanied by an increased post-transfusion survival. Adenosine was never used in routine transfusion practice because of its toxicity, but a few years later adenine, a far less toxic substance, was discovered to be capable, together with inosine, of ‘rejuvenating’ stored red cells (Nakao et al. 1960). Furthermore, adenine alone, when added at the beginning of storage, retarded the rate of loss of red cell viability (Simon 1962; Simon et al. 1962).
Until about 1960, the primary criterion for satisfactory preservation of red cells was maintenance of viability. However, following the discovery of the role of 2,3 DPG in releasing oxygen from HbO2 and the realization that red cell DPG was not well maintained with current methods of preservation, attention switched to the quality of stored red cells. In the US, the acceptable ‘standards’ for licensure require that at the end of the approved storage period, an average of at least 75% of the cells remain in the circulation 24 h after infusion and that haemolysis be less than 1%. (FDA Workshop on Red Cells Stored in Additive Solution Systems; 1985 Apr 25; Bethesda, MD) These are arbitrary, if useful measures. Relevant measures of quality and function of stored red cells remain a major challenge.
Collection of Blood to Provide Components
In the beginning, all blood was collected as whole blood. The introduction of the reusable vented glass bottle permitted plasma to be drawn from red cells. Today, with the exception of a few thousand transfusions a year for far-front military casualties, transfusion of whole blood is largely confined to the developing world where as much as 90% of blood collected is transfused as whole blood (Spinella et al. 2009; Marwaha 2010). In the developed world, systems of interconnected plastic blood bags developed in the 1960s ushered in the era of component therapy, which not only permitted efficient use of collections from a single blood donor, but also decreased the risks of bacterial contamination and volume overload from transfusion (Walter 1984). Increasingly, whether by manual, semi-automated or automated techniques, blood is collected primarily for separation into components.
Although citrate remains the anticoagulant in all of these methods, the composition of the solution into which the blood is drawn, and in which individual components are stored, will vary according to need and preference (Hess 2006). Whenever the plasma obtained is to be fractionated, a relatively low concentration of citrate, such as 4% citrate or as in the solution called half-strength CPF (0.5CPD) is desirable, although not appropriate if the red cells or platelets are to be stored (see Appendix 9). Special solutions for red cell storage are described below.
A unit of whole blood in the US contains a volume of 450–500 ml, but the volume may vary according to other national standards. No standard for Hb content has been agreed upon, although the lowest acceptable Hb concentration for blood donors in the US assures that each unit of allogeneic whole blood will contain at least 50 g of Hb. Red cells are prepared by centrifugation to remove plasma or by haemapheresis. The Council of Europe (CoE) (2007) standard defines a whole blood unit as Hb of 45 g and a haematocrit between 65% and 75%; the United States Pharmacopoeia (USP) has proposed a Hb content of 50 g in a volume of 180–325 ml. A unit of red cells that has been leucocyte depleted is required to contain 43 g or more (CoE 43 g), whereas a frozen, deglycerolized unit must have a minimum of 40 g (CoE 36 g). These definitions are arbitrary and an effort to harmonize these and other ‘product specifications’ would be welcomed.
The optimum temperature at which whole blood and the different components should be held prior to processing and storage is dictated by several considerations. If whole blood is kept at ambient temperature (20–25°C) for some hours, the granulocytes will ingest some contaminating bacteria. On the other hand, keeping CPD blood at ambient temperature for as little as 8 h results in a loss of 50% of the 2,3-DPG content of the red cells (Högman 1994). Although refrigeration is best for preserving red cells, including the maintenance of DPG levels, cooling results in the loss of platelet viability.
As demand for plasma and platelets increased, methods of separating blood at the time of collection into red cells and platelet-rich plasma (PRP) were developed. Currently, in many blood collection centres, red cells are separated and stored at 4°C in special ‘additive’ solutions; platelets are harvested from PRP or buffy coats and stored at about 22°C; the plasma is frozen for fresh-frozen plasma (FFP), for the production of cryoprecipitate or further fractionated to obtain clotting factor concentrates, immunoglobulin (IVIg) and other valuable derivatives. Thus, the emphasis in blood collection and storage is no longer solely on red cells, but rather on the optimal harvesting and storage of several blood constituents. In this chapter, only the storage of red cells is considered.
Deleterious Changes Occurring During Storage: The ‘Storage Lesion’
When blood is mixed with an anticoagulant solution and stored at 4°C, the red cells undergo a variety of changes that have been termed the ‘storage lesion’ (see below). Red cells change shape from discs to echinocytes and finally to spheres, become more rigid, shed lipid, exhibit various biochemical changes, particularly a fall in ATP and DPG content, and progressively lose the ability to survive in the circulation after transfusion (Card et al. 1983). As is the case with people, some red cells age more gracefully than others; there is great donor-to-donor variability. When studies of storage conditions are undertaken, paired studies of the same donor yield the most accurate comparisons. Measuring and assuring the ‘quality’ of stored red cells has become a contentious, even acrimonius issue (Dzik 2008). The controversy regarding the risk of ‘old’ red cells will be reviewed in Chapter 15.
Aging Disgracefully: Loss of Viability
Unlike wine, firewood, and fine violins, red cells do not improve with age. From a practical point of view the most important change that occurs in red cells during storage is loss of viability, their capacity to survive in the recipient’s circulation after transfusion. Figure 9.2 shows results with ACD, the standard preservative solution from the mid-1940s to the mid-1960s. As described later, with solutions now in use red cell viability declines more slowly. Nevertheless, the same pattern is observed. After relatively short periods of storage (up to about 14 days for ACD), a small proportion of the cells is removed from the circulation within the first 24 h of transfusion, but the rest survive normally. After longer storage (28 days for ACD) about one-quarter of the cells is removed within 24 h and, although the survival of the remainder is prolonged, it is not as long as that of unstored cells. The viability of a sample of stored red cells cannot be accurately predicted from any measurement made in vitro, so that measurements of post-transfusion survival remain the standard for developing improved methods of preservation.
Figure 9.2 Post-transfusion survival of red cells of fresh blood compared with that of red cells stored in acid–citrate–dextrose at 4°C for 14–28 days. When stored red cells are transfused, some leave the circulation in the first 24 h after transfusion but the rest survive well (results obtained by the method of differential agglutination, revised from Mollison 1951, p. 13).
(Source: Adapted from Mollison 1951. Reproduced with permission of Elsevier.)
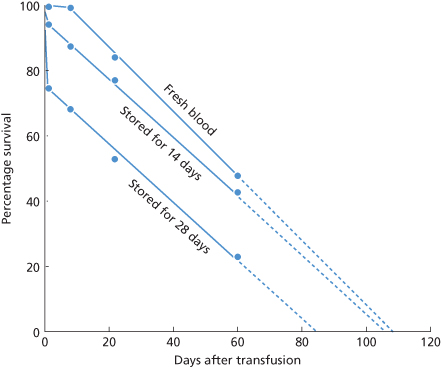
The fact that some red cells stored for a period at 4°C survive as well as fresh red cells indicates that red cells do not age during storage in the same way as they do in the circulation.
Changes in Red Cell Metabolism
Normal Red Cell Metabolism
Breakdown of glucose is the only source of energy for red cells. Glucose readily penetrates the red cell membrane and is phosphorylated and metabolized, with lactate as the end product. The first part of this process involves some energy consuming steps in which the adenosine triphosphate (ATP) loses one inorganic phosphate radical and is transformed to adenosine diphosphate (ADP). Later in the metabolic pathway, ATP is regenerated with a net gain of 2 ATP molecules per molecule of glucose. In the circulating red cell, most of the total adenine nucleotides are present in the form of ATP; the other nucleotides, ADP and adenosine monophosphate (AMP), are present in much lower concentrations. The mean values (as mmol/l) are: ATP, 1.552; ADP, 0.160; AMP, 0.014 (Ericson et al. 1983). The mean ATP value corresponds to 4.56 µmol/g Hb. Other published estimates are somewhat lower, i.e. approximately 3.5 µmol/g Hb (Bensinger et al. 1977; Heaton et al. 1984).
Metabolism in Stored Red Cells
During prolonged storage at 4°C, the normal high energy level is not sustained, resulting in a decrease in ATP and an increase in ADP and AMP. AMP is deaminated and dephosphorylated to hypoxanthine, which cannot be used by the red cell for resynthesis of adenine nucleotides. However, when adenine is added to the storage medium it combines with phosphoribosyl pyrophosphate to form AMP. In this way, the total concentration of adenine nucleotides can be maintained for several weeks, even if the ATP concentration decreases.
Phosphorylation of glucose is the source of energy for stored red cells and cannot continue when ATP is depleted. Although red cell ATP and viability are often associated, they are not well correlated. For example, when red cells are stored in a solution of bicarbonate, adenine, glucose, phosphate and mannitol, which results in the maintenance of high DPG levels but in a fall in ATP levels to about 10% of normal, as many as 87% of the cells may be viable (Wood and Beutler 1967). The content of total adenylates, AMP, diphosphate (ADP and triphosphate (ATP)), is more closely associated with survival than is ATP content alone (Högman et al. 1985). When red cells are supplied with glucose and adenine and stored at 4°C, the ATP content is maintained at the initial level or increases slightly for 1–4 weeks but then falls progressively.
DPG (2,3-diphosphoglycerate or -biphosphoglycerate), whose role in regulating the oxygen affinity of Hb has been mentioned briefly above, is present in red cells in a higher concentration than that of ATP, namely 13–15 µmol/g Hb (Bensinger et al. 1977), corresponding to about 5 µmol/l of red cells. The cellular concentration of DPG is regulated by a mutase (synthesis from 1,3DPG) and a phosphatase (dephosphorylation to 3-phosphoglycerate). When the intracellular pH drops below 7.2, the phosphatase is activated and the concentration of DPG decreases (Duhm 1974). In ACD blood, the fall starts as early as the third to fifth days of storage and starts not much later in CPD blood. Red cells stored in the commonly used additive solutions [saline–adenine–glucose–mannitol (SAGM), Adsol, AS-3, etc.] lose most of their DPG within 14 days (Högman et al. 1983; Heaton et al. 1984; Simon et al. 1987). The observation that the oxygen dissociation curve of stored blood is ‘shifted to the left’, indicating that stored red cells release oxygen to the tissues less readily than do fresh red cells was made before the role of DPG had been recognized (Valtis and Kennedy 1954). After transfusion, the DPG level is restored, although relatively slowly (Beutler and Wood 1969).
An important factor in the maintenance of a normal DPG concentration is the intracellular pH (pHi). The pH of blood is strongly temperature dependent. In freshly collected blood, the pHi is about 7.2 at 22°C but 7.6 at 4°C (Minakami 1975). Even after rapid cooling of whole CPD blood to room temperature, storage for 24 h results in a rapid fall in DPG (Pietersz et al. 1989), owing to metabolic acidification to a pH below 7.2, a level at which the breakdown of DPG is accelerated. At 4°C the decrease is slower, owing to the lower rate of metabolism. Collection in ACD results in a lower initial pH than collection in CPD (a less acid solution, see Appendix 9). Methods of raising intracellular pH to permit better maintenance of DPG are discussed below. The temporary shift in the oxygen dissociation curve of transfused stored red cells is of little clinical significance in stable or moderately stressed patients but may be important in critical clinical situations (Collins 1980; Apstein et al. 1985; Marik and Sibbald 1993).
Changes in Shape and Rigidity
During storage red cells change from discs to echinocytes and then to spheres. After 8 weeks’ storage with ACD, this change is virtually complete, but if the cells are stored with adenine and inosine most of the cells retain their original discoid shape and viability is greatly increased (Nakao et al. 1960). Furthermore, if red cells are stored with ACD alone for 8 weeks and then incubated with adenine and inosine, many of the red cells change from spheres to discs and viability is partially restored (Nakao et al. 1962). A study of the relation between shape and viability indicated that the two are highly correlated in rejuvenated, but not in non-rejuvenated, samples. A possible explanation is that time is needed for the rejuvenation process. Time for shape change is available when cells are rejuvenated in vitro but may not be available when non-rejuvenated cells are transfused, so that discoid cells are trapped in the spleen before the storage changes can be reversed (Högman et al. 1987a).
On storage, metabolic depletion leads to dephosphorylation of spectrin and loss of red cell deformability (Mohandas 1978). Whereas 100% of fresh red cells can pass through a pipette of minimal dimensions 2.85 µm (thought to be similar to that of the microcirculation in the spleen), after 3 weeks’ storage in ACD, only about 80% of cells can pass (Weed and LaCelle 1969).
Increase in Plasma HB and Loss of Membrane Lipid
During storage, spontaneous lysis of a small fraction of red cells (<0.5%) takes place and vesicles containing both lipid and Hb from intact red cells are shed. In plasma from stored blood, microvesicles contribute more than free Hb to total plasma Hb. In a study of the effect of the plasticizer DEHP, after storage for 21 days in CPD, figures were as follows: in plastic without DEHP, total plasma Hb was 149 mg/dl and free Hb 44.6 mg/dl. Corresponding figures for storage in plastic with DEHP were 81.3 and 7.6 (Greenwalt et al. 1991). In suspensions of red cells in SAGM (see below), stored at 4°C for 42 days (without mixing), spontaneous lysis, expressed as total plasma Hb divided by total Hb, amounts to 0.60% (Högman et al. 1987b). Standards for maximum percentage of haemolysis at outdate have been established to validate the storage period (<1%) (Moroff et al. 1999).
Lytic and oxidative damage to red blood cell membrane phospholipids and the elaboration of lysophospholipids occurs continuously during red blood cell storage and are exacerbated by the breakdown of white cells if the component is not leucocyte-reduced prior to storage. Kelher et al. (2009) have reported that the accumulation of biologically active lipids is associated with acute lung injury in a two-hit rat model, and Gajic and his colleagues (2007) have shown that concentrations of lysophospholipids in stored red blood cell units are associated with increased rates of lung injury in intensive care patients.
Although an increased rate of spontaneous red cell lysis with any preservative solution indicates that viability will be poor, absence of lysis does not indicate that viability will be good. For example, red cells stored for 14 days in a trisodium citrate–sucrose solution show less than 1% haemolysis, even although almost all of the cells are non-viable (Mollison and Young 1941, 1942). Similarly, certain phenothiazine compounds inhibit red cell haemolysis on storage (Halpern et al. 1950), but do not increase the post-transfusion survival (Chaplin et al. 1952).
Nitric Oxide: Loss of Signal or SNO Job?
Within hours of refrigerated storage, red cells are depleted of the nitric oxide (NO) derivative that is bound to haemoglobin at two thiol groups on the β93 cysteines, the S-nitrosylated form known as SNO-Hb. Nitric oxide (NO), also termed endothelium-derived relaxing factor (EDRF), is a highly-reactive gaseous signalling molecule that is produced in a number of different cells by endogenous and induced nitric oxic synthases. NO diffuses freely across biologic membranes. Among its recognized functions are signals effecting vascular smooth muscle relaxation thus increasing microcirculatory blood flow. Red cells and haemoglobin molecules are essential factors in regulating the bioactivity of NO throughout the mammalian body (Coki and Schechter 2008). In addition to SNO, haemoglobin binds NO at haeme-iron sites. However it has been proposed that red cells mediate an NO-based hypoxic vasodilatory activity in vivo through SNO and may act as ‘oxygen sensors’ (Jia et al. 1996). The ‘SNO hypothesis’ postulates that release of oxygen from haeme iron under hypoxic conditions promotes the release of NO from the β93 cysteine and that this NO can diffuse to vessel walls and effect vasodilation (McMahon et al. 2002). If this is correct NO-depleted stored red cells might lose considerable ability to deliver oxygen within hours of collection.
The ‘SNO hypothesis’ has been as controversial as it is appealing. A great deal of NO chemistry and physiology remains unexplained (Winslow and Intaglietta 2008). Tsai et al. (2004) found physiologic evidence of a storage lesion in a hamster model despite equivalent NO content in stored and fresh red cells. The preparation of transgenic mouse models that express either human wild-type haemoglobin or human haemoglobin in which the betaCys93 residue is replaced with alanine resulted in the loss of SNO-Hb, but did not affect red blood cell-dependent hypoxic vasodilation (Isbell et al. 2008). These results make the arguments for the ‘SNO hypothesis’ less compelling and are consistent with the clinical report that transfusion of stored or fresh blood in hypoxic haemodiluted volunteers had the same ability to restore evoked brain stem potentials (Weiskopf et al. 2006).
Loss of RBC integrity during storage results in haemolysis and formation of microparticles. The levels of extracellular haemoglobin range from 28 µmol/l after 35 days of storage in citrate–phosphate–dextrose–adenine to 80 µmol/l after 50 days of storage (Latham et al. 1982; Salzer et al. 2008). NO consumption by the plasma fraction of older stored blood is substantially greater than that from blood stored for only 1 week and NO consumption is directly proportional to the extent of NO consumption (Gladwin and Kim-Shapiro 2009). Red cell deterioration also leads to formation of microparticles, and the majority of haemoglobin in the supernatant stored blood may be in the form of microparticles (Greenwalt et al. 1991). The effects of microparticles on NO bioavailability could be as great or even greater than the effects of cell-free haemoglobin, which is rapidly bound to haptoglobin. In addition to reductions in NO bioavailability that could result from increased NO scavenging by cell-free haemoglobin and microparticles, NO bioavailability may be reduced due to decreased red cell NO synthase.
Increase in Red Cell Sodium and Plasma Potassium
The Na+–K+ ATPase is highly sensitive to decreases in temperature. As a consequence, when blood is cooled to 4°C, sodium diffuses into the cells and potassium leaks out until electrochemical equilibrium across the red cell membrane is reached. Irradiation exacerbates the potassium leak. When red cells are irradiated and then stored, supernatant potassium increases substantially. With 30 Gy, an approximate doubling within 48 h has been noted (Ramirez et al. 1987) and, after 42 days, an increase to a mean of 78 mEq/l compared with 43 mEq/l in non-irradiated control samples (Davey et al. 1992). The concentration of potassium in a unit stored in additive solution is about 10 mM higher than control two days following irradiation and about 20 mM higher after 5 days (Moroff et al. 1999). The increased amount of potassium in the red cell supernatant following irradiation and storage is of little clinical significance except in exchange transfusions or when massive transfusions are given to infants (see Chapter 15).
Changes in Osmotic Fragility
The composition of the preservative is a factor affecting the osmotic fragility of stored red cells. For example, red cells stored with sucrose, which does not penetrate the red cell membrane, have an increased osmotic resistance, although they have a very poor survival. In contrast, red cells stored with a relatively large volume of 5% dextrose have an increased osmotic fragility but survive well (Mollison and Young 1942).
In stored cells, a major component of the increase in osmotic fragility results from the accumulation of lactate and, to a lesser extent, from the substitution of chloride ion for a diminished cell content of 2,3-DPG. However, in addition to the overall increase in osmotic fragility produced by the increased intracellular osmotically active material, there is a fragile tail of red cells. These cells are the first to be lost following re-injection into the circulation and are presumably a subpopulation that has lost the most membrane (and thus surface area) during storage (Beutler et al. 1982).
Effect of PH
For the preservation of red cell viability, an initial extracellular pH (pHe) of about 7.0 appears to be optimal. Acidified preservative solutions, such as ACD, prevent the rise in pH which would otherwise occur on cooling blood from 37°C to 4°C and help to maintain normal metabolism, including the maintenance of ATP levels. Even after 3 weeks’ storage, about 70% of the red cells remain viable.
As Figure 9.2 shows, when red cells stored with ACD are transfused after about 2 weeks’ storage, approximately 10% are removed from the circulation in the first 24 h and the rest survive normally. In contrast, when red cells are stored with trisodium citrate glucose, a solution that has a pH about 0.8 units higher than ACD, 24-h survival falls to about 50% after 1 week (second edition, p. 11).
During storage, pH falls due to the production of lactic and pyruvic acids from glycolysis. As a result, pHi falls to a level (<7.2) at which glycolysis is inhibited and DPG phosphatase is activated. After about 2 weeks’ storage, red cell DPG falls almost to zero. At a pH above 7.2, a high concentration of DPG is maintained (Duhm 1974) due to ready availability of the substrate of DPG mutase and a low activity of DPG phosphatase. The fall in pHi can be prevented by washing the red cells in citrate before storage, which results in a loss of chloride ions and a gain in OH− ions (Meryman et al. 1991). Red cells washed in a Cl−-free medium and stored in a citrate–phosphate–glucose–adenine solution had a pHi of 7.6. Red cell DPG rose to double the initial value and fell below normal only after 8 weeks (Matthes et al. 1994). Prolonged red cell storage has been reported by increasing the volume and buffering capacity of the additive solution (Hess et al. 2003). Longer storage can be achieved by alkalinizing the additive solution so that ATP is generated in excess of utilization. However, above pH 7.2, glycolysis is diverted to DPG production and ATP production is inhibited. The addition of 30 mEq per litre of sodium bicarbonate led to the buffering of 9 mmol of protons, in addition to the eight buffered by haemoglobin, allowing the pH to be maintained above 6.6 and the red blood cell ATP concentration above 3 µmol per gram of Hb for 12 weeks. Moreover, in vivo recovery was 78% at 24 h (Hess et al. 2003). Resuspension of red cells in an experimental alkaline medium consisting of phosphate–adenine–guanosine–glucose–gluconate–mannitol has preserved 2,3-DPG levels at greater than 10 µmol per g haemoglobin, with ATP levels of higher than 5 µmol per g Hb and haemolysis of less than 0.2% for up to 35 days (de Korte et al. 2008).
Addition of Glucose
During glycolysis, dextrose is phosphorylated by ATP and the phosphorylated dextrose is catabolized to pyruvic or lactic acid. In the process of glycolysis, ATP is generated from ADP. Although glycolysis is substantially slowed at 4°C, red cell preservation is greatly enhanced by adding dextrose to the storage medium and the optimum concentration depends on the length of storage. For example, in red cells from whole blood mixed with standard citrate–phosphate–dextrose–adenine solution, there is enough dextrose for maintenance of ATP levels for 35 days, but after 42 days the amount is suboptimal (Dawson et al. 1976).
Addition of Adenine
Red cell preservation is greatly improved by adding adenine and inosine (Nakao et al. 1962) or adenine alone (Simon 1962) to the storage medium. The addition of adenine to a final concentration of 0.5 mmol/l to ACD blood increased 24-h survival after 42 days’ storage from 49% to 74% (Simon 1962). Later work showed that an initial concentration of 0.25 mmol/l was sufficient for this length of storage (Åkerblom and Kreuger 1975).
Toxicity of Adenine
No adverse clinical reactions attributable to adenine were noted in a series of more than 5000 transfusions of blood to which 35 mg (approximately 0.26 mmol) adenine per unit had been added (de Verdier et al. 1966). The only potential hazard seems to be the formation of the metabolite 2,8-dioxyadenine (DOA), which is poorly soluble and may be deposited in renal tubules (Åkerblom et al. 1967). In practice, the only patients at risk are those who have massive transfusions and, even then, risk appears to be minimal. No impairment of renal function was found in patients who had received approximately 17 units of ACD-adenine blood (Westman 1972). In another study, of six patients who had died in the immediate postoperative period, DOA crystals were found in the kidneys in three of the patients, who had received, respectively, 17, 46 and 95 mg of adenine per kilogram of body weight (Falk et al. 1972; Westman 1974). CPD-adenine blood (final concentration of adenine 0.25 mmol/l or approximately 34 mg/l) appears to be safe for exchange transfusion in newborn infants, even when repeated exchange transfusions have to be given (Kreuger 1976). The safety of adenine (and other additives) has not been proven for extremely ill premature infants, particularly those with hepatic and renal insufficiency. However, several decades of extensive use of blood preserved in additive solutions has shown little reason for concern.
Effect of Mixing Red Cells During Storage
Mixing whole blood or red cells at various intervals during storage has clear-cut beneficial effects: in blood stored with CPD or ACD-adenine, red cells in units mixed daily had a significantly better 24-h survival, a higher ATP content and less spontaneous lysis than did unmixed units (Dern et al. 1970). Red cells stored in SAGM solution (see above) showed less spontaneous lysis and shed fewer microvesicles if the suspension was mixed weekly (Högman et al. 1987a). Red cells stored in an additive solution such as Adsol and mixed daily were as well preserved after 8 weeks, as judged by morphological index, ATP and lysis, as unmixed cells stored for 6 weeks (Meryman et al. 1994). The beneficial effect of mixing is presumed to be due to dissipation of acid metabolites, which otherwise collect in the bottom layer of stored red cells, and to ensuring the even supply of nutrients.
Reversibility of Storage Changes in Vivo
Changes observed in stored red cells are at least partly reversible in vivo: after relatively brief periods of storage the majority of the cells show shape changes and increased rigidity, although after transfusion most cells are viable.
Changes in the composition of stored red cells following transfusion can be studied after separating donor red cells from samples of the recipient’s blood, using the technique of differential agglutination (Crawford and Mollison 1955). This method has been used to study the rate at which changes in 2,3-DPG and electrolytes are reversed in vivo.
Rate of Restoration of Red Cell 2,3-Diphosphoglycerate in Vivo
In two studies of red cells stored as whole blood mixed with ACD and transfused to patients, results were as follows: in the first, in three subjects, at least 25% of the DPG content was restored within 3 h and more than 50% within 24 h; in the second, also in three subjects, about 45% was restored in 4 h and about 66% at 25 h (Beutler and Wood 1969; Valeri and Hirsch 1969). In studies of normal volunteers whose red cells had been stored for 35 days with AS-1 or AS-3 (Appendix 8), results were not very different: DPG levels returned to 50% of normal in 7 h and almost to 95% at 72 h. The rate of regeneration was slower with red cells stored as CPDA-1 blood, owing possibly to lower intracellular levels of glucose and adenine (Heaton et al. 1989c).
Reversal of Electrolyte Changes
The concentration of potassium in stored red cells is restored to normal very slowly after transfusion. Red cells previously stored in ACD for 15–16 days did not regain a normal content for more than 6 days after transfusion, although their sodium content became normal within 24 days (Valeri and Hirsch 1969). Similarly, red cells previously stored for 1–3 months at −20°C in a citrate–glycerol mixture did not regain normal potassium values until 4 days after transfusion (Crawford and Mollison 1955).
Best Methods of Storing Red Cells
Storage as Whole Blood
The best solution devised so far for addition to whole blood is citrate–phosphate–dextrose–adenine, version CPDA-1 (Appendix 9). When 14 ml of this solution are added per 100 ml of blood, the final concentration of adenine is 33.8 mg/l or 0.25 mmol/l. This concentration is suitable for maintaining red cell ATP in stored whole blood and is better than 0.5 mmol/l in maintaining DPG levels (Kreuger and Åkerblom 1980). In a collaborative trial from six laboratories, the mean 24-h survival for 50 studies in which red cells were stored as whole blood with CPDA-1 for 35 days was 79%, SD ± 10% (Moore et al. 1981).
Effect of Excess Anticoagulant
During the course of an ordinary donation, the first red cells to be collected are necessarily mixed with an excess of anticoagulant solution. Red cells from the first 100 ml of blood to be collected into ACD and stored for 28 days were found to have a 24-h survival of 20–32% compared with 44–61% for the whole unit (Gibson et al. 1956). Similarly, when blood was incubated at 37°C for 30 min with one-half of its volume or more of ACD the 24-h survival of the red cells was 50% or less at 24 h (Mayer et al. 1966, 1970). A recent suggestion that part of this discrepancy relates to a technical artefact involving increased 51Cr elution from cells labelled in a low pH medium has merit, at least for baboon red cells, but has yet to be confirmed by studies of human red cells (Valeri et al. 2003a).
When a full unit of blood cannot be collected from a donor, damage to the red cells may occur as a result of the relatively high ratio of anticoagulant solution to blood in the collection container. A study in which varying volumes of blood were collected into a fixed amount of ACD or CPD intended for 350 ml of blood, and were then stored for 21 days, indicated that with ACD, only collections of 400 g or more should be accepted, although with CPD those of 300 g were satisfactory. With storage periods as long as 35 days, red cells of units ‘undercollected’ into CPDA-1 are actually at an advantage, presumably due to the higher ratio of nutrients to cells. In a carefully controlled study, donations of 275 ml had a mean 24-h survival of 87.7% compared with 78.8% for standard donations of 450 ml (Davey et al. 1984).
Storage as Red Cells
If most of the supernatant plasma preservative solution is removed and loosely packed red cells are stored, viability is as well maintained as in whole blood. In a comparison with blood taken into CPD-adenine, after 5 weeks the mean 24-h survival was 78.7% for storage as whole blood and 76.5% for storage as red cells (Kreuger et al. 1975).
When tightly packed red cells are stored, there is less residual preservative solution, and extra nutrients must be supplied for optimum preservation (Beutler and West 1979). In trials of a solution of CPDA-2 containing increased dextrose and adenine (Appendix 9), red cells stored for 42 days as concentrates with a PCV of 0.75 had a mean 24-h survival of 76.7% and those with a PCV of 0.85 had a mean survival of 70.6%. Although CPDA-2 appears superior to CPDA-1 when red cells are to be stored as concentrates (Sohmer et al. 1981), the preservative has not been commercialized because of the development of the additive solution approach to red cell concentrate preservation (see below).
Storage as Resuspended Red Cells (‘Additive Solutions’)
The idea of storing separated red cells with a nutrient solution containing adenine and glucose was proposed in 1964 (Fischer 1965) and has since been widely adopted. In one system, platelets, buffy coats and plasma are separately harvested from units of whole blood and the red cells are stored in a saline–adenine–glucose–mannitol solution (SAGM, Appendix 10). In one trial, after 42 days the mean survival was 77.4%, SD 4.7% (Högman et al. 1983). In trials of a solution containing 60% more adenine and nearly 2.5 times as much glucose (Adsol, Appendix 10), mean 24-h survival after 35 days was 86% and after 49 days was 76% (Heaton et al. 1984). Results with other additive solutions containing glucose and adenine (e.g. AS-3, see Appendix 10) have been similar (Simon et al. 1987).
Rejuvenation of Stored Red Cells in Vitro
Even after prolonged storage, the ATP content and post-transfusion survival of stored red cells can be restored to near pre-collection values by incubation of the red cells in vitro with adenosine (Gabrio et al. 1955b). Striking effects are observed on incubation with inosine and adenine. For example, red cells stored for 8 weeks as blood mixed with ACD have the appearance of smooth spheres and their ATP content is very low. After incubation at 37°C for 1 h with inosine and adenine, they regain their original discoid shape, their ATP level rises to near-normal values and their survival in vivo is greatly improved (Nakao et al. 1962).
DPG levels of stored red cells can be restored, and even increased to supranormal levels, by incubation with inosine, phosphate and pyruvate (McManus and Borgese 1961). Pyruvate greatly increases the amount of DPG produced, probably by oxidizing NADH to NAD and thus preventing the inhibition of glyceraldehyde phosphate dehydrogenase caused by NADH (Duhm et al. 1971). As an example of what can be achieved, stored red cells in which the DPG content had fallen from an initial 4.2 mmol/l red cells to 0.35 mmol/l were incubated at 37°C for 4 h with final concentrations of 10 mmol/l of inosine, 4 mmol/l of phosphate and 4 mmol/l of pyruvate; the DPG level rose to almost 6 mmol/l of red cells (Oski et al. 1971).
Estimation of Viability of Stored Red Cells
Although the factors causing loss of red cell viability are now much better understood, no in vitro method can predict with great accuracy how a given sample of stored red cells will survive in the circulation; the same holds true for in vitro assays of red cell function. Direct measurement of post-transfusion survival therefore continues to play an essential role in the development of improved methods of red cell preservation. As noted above, this is the ‘gold standard’ for licensure of new storage solutions and containers. For more than half a century, the measurement has relied upon radiochromium labelling of red cells (Dumont and Aubuchon 2008).
When red cells that have been stored for a relatively short period are injected into the circulation, some cells are cleared within a few hours but the rest survive normally. With longer storage, the percentage cleared within the first few hours increases progressively and after prolonged storage all the cells are cleared rapidly. In practice, knowledge of the percentage survival at 24 h makes it possible to predict how the whole population will survive and there is therefore little reason to continue assays beyond this time.
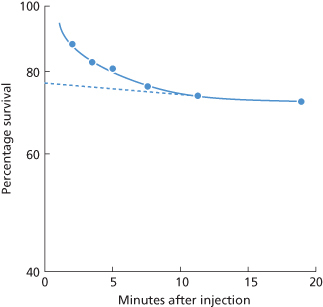
In view of the fact that, in a population of stored red cells, some are cleared within the mixing time (Figure 9.3), percentage survival cannot be estimated accurately unless a labelled population of fresh red cells is also injected. True survival can then be determined from estimation of total circulating red cell volume (RCV) or as a ratio of stored–fresh red blood cell survival. On the other hand, when the proportion of non-viable red cells is relatively small, satisfactory estimates can be made by an extrapolation method (see below), without injecting a second labelled population.
Figure 9.3 Rate of disappearance of 51Cr-labelled stored red cells from the circulation during the 20 min following injection. The red cells were from blood that had been stored for 42 days at 4°C with acid–citrate–dextrose and inosine. The true percentage survival 24 h after injection was about 50%. Each observation is based on a comparison with the survival of fresh red cells labelled with 32P and injected at the same time. If survival had been based on the 51Cr estimates alone, taking samples from 10 min onwards and extrapolating the estimates to zero time (– – –) to obtain a figure for apparent 100% survival, 24-h survival would have been estimated as 65% (50/77), instead of 50%.
Methods that have been used for estimating the percentage survival of stored red cells have been reviewed elsewhere (Mollison 1984). Here, only two methods will be described.
In the double-label method, the sample of stored (autologous) cells is labelled with one isotope (51Cr) and a sample of fresh (autologous) red cells is labelled with a second isotope (e.g. 99mTc). The two lots of labelled red cells are injected as a mixed suspension. RCV is estimated from the 99mTc values in samples taken at 5–10 min and the percentage survival of the 51Cr-labelled stored cells is calculated from a sample taken at 24 h. This method is the most accurate available. When RCV is estimated simultaneously with two lots of fresh red cells, each labelled with a different isotope, the results agree closely, as expected from the fact that the two lots of cells are injected in the same suspension and that common standards are prepared. Using 51Cr and 32P, the mean value for RCV estimates with the two isotopes differed by less than 0.1% with an SD of 0.9% (Mollison et al. 1958). Using 51Cr and 99mTc, in two series the mean value of estimates with 99mTc was about 1.2% higher in one small series (Jones and Mollison 1978) and 0.9% higher in another (Beutler and West 1984).
As an alternative to using a second red cell label to estimate RCV, 125I has been used to estimate plasma volume and RCV has then been deduced. This method is far less satisfactory; it has a substantially larger error as: (1) the volumes of labelled plasma and of red cell suspension that are injected are different; (2) different standards are prepared from plasma and from the red cell suspension; and (3) in deducing RCV from plasma volume, a factor has to be assigned for the HB/HV ratio (see Appendix 4). Apart from the greater error involved in estimating RCV in this indirect way, 125I has a substantially greater radiotoxicity than 99mTc.
In the single-label method, which is simpler but less accurate than the double red cell label method, a sample of stored red cells is labelled with 51Cr and injected; a series of samples is taken and the values are extrapolated to zero time to obtain an estimate of the 100% survival value. In using this second method it is evident that the first sample must not be taken before mixing is virtually complete, and sampling must be confined to a period during which the rate of cell destruction is more or less constant. Mixing is usually not complete for 3–5 min after injection (Strumia et al. 1968). In a series in which samples were taken at 2.5-min intervals, the points between 5 and 15 min after injection were well fitted by a single exponential but the 20-min value was above the line, indicating that destruction had slowed by this time. When RCV was estimated by extrapolating a line through the 5- to 15-min values to zero time, the estimates of RCV were within ±5% of the true value (obtained from the 99mTc estimate), provided that the 24-h survival was above 70%. When survival was below this value, RCV was overestimated by about 25%. For example, in one case the true survival, estimated from a 99mTc estimate of RCV, was 13.3%, but if calculated from the RCV determined by extrapolation was 16.9%. This overestimate can either be expressed as: 3.6/13.3 × 100 (27%) or as 16.9–13.3 (3.6%). The latter figure is the one that is important in practice and the error of the extrapolation method is not large enough to be important (Beutler and West 1984). Using this second method of interpreting results, in a series in which the survival rate was always greater than 60% and usually greater than 70%, the single-isotope method overestimated survival by only 1–4.3% (Beutler and West 1985). In another study, in which the 24-h survival rate by a double red cell labelling method averaged 78.2%, survival by the extrapolation method was overestimated by about 3%. When true survival was less than 75%, the overestimate was about 5% (Heaton et al. 1989d).
Because of its low and stable rate of elution, 51Cr has become the standard label for red cell viability studies. 99mTc and 111In have been proposed but have not proved popular for red cell storage studies (Marcus et al. 1987).
Survival of Stored Red Cells: Donor Variation
In estimating the post-transfusion survival of stored red cells, allowance must be made for the significant differences between donors. Dern and co-workers (1966) carried out at least two tests on each of 28 subjects whose blood was stored in ACD for 21 days and found consistent differences between subjects. Whereas the inherent experimental error, including the error of the method, biological variation between tests on the same subject, etc., had an SD of 6.4, the SD of differences between subjects was 6.6. Similar observations have been made by others; for example, Finch (CA Finch, personal communication, 1955) found that whereas the red cells of most normal donors, after storage in ACD for 3 weeks, had a 24-h survival of 70–85%, those taken from one particular donor regularly had a survival of only 60–65%. Another example is provided by Table 9.4, which shows that the 24- and 48-h survival of subjects 2 and 3 was consistently better than that of subjects 1 and 4. In another series in which red cells from six donors were stored in two different ACD solutions, after 28 days the ranking order of the donors with regard to survival was almost identical. It was particularly striking that one donor had the best survival on both occasions, and one by far the worst; in this latter subject (RP) the 24-h survival was 41% and 33% on the two occasions, compared with mean values of 74% and 75% in the other five subjects (Mishler et al. 1979). Further investigations on the red cells of RP showed that during storage their rate of loss of deformability was substantially greater than in other subjects (Card et al. 1983).
Table 9.4 Effect of a preliminary 2-h incubation at 37°C before 28 days’ storage at 4°C on the subsequent post-transfusion survival of autologous red cells.
Source: Mollison 1961b. Reproduced with permission of Portland Press on behalf of The Biochemical Society.
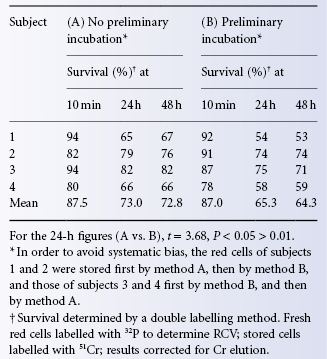
In another investigation, donors were selected according to the results of previous measurements of autologous red cell survival after storage. From these previous measurements, nine were predicted to have better than average survival and four worse than average. Further measurements of the survival of autologous red cells after storage showed that observed survival correlated reasonably well (r = 0.648) with predicted survival (Myhre et al. 1990).
In the above paragraph, autologous rather than allogeneic red cells were used in all series (with the possible exception of that of CA Finch) but, as described in the series in the paragraph below, the point is not an important one.
In comparing two methods of red cell preservation, it is essential either to use a relatively large number of subjects or, if only a few subjects are used, to compare both methods in the same subject. An example is given in Table 9.4. Note that if method B had been used to store the red cells of subjects 2 and 3 and method A for subjects 1 and 4, the conclusion would have been reached that method B gives a better 24-h survival rate (mean 74.5%) than method A (mean 65.5%) – the reverse of the truth.
In the absence of alloimmunization and massive splenomegaly, recipient characteristics exert a relatively minor effect on the survival of donor red cells. In two different studies, the survival of stored red cells from any particular subject appeared to be the same in the subject’s own circulation as in the circulation of a recipient injected with part of the same sample (Dern 1968; Shields 1969; Dern et al. 1970).
Differences Between Young and Old Stored Red Cells (The ‘Storage Lesion’)
The effect of increasing periods of storage on the post-transfusion survival of red cells calls for additional comment. As already mentioned, the survival curve of red cells stored for relatively short periods (under 2 weeks) in a suitable preservative solution is characterized by destruction of up to 10% of the cells within the first 24 h with normal survival of the remainder, removal of about 1% a day. This finding suggests that the cells rendered non-viable are a random sample of the population and that the remainder are still capable of normal survival. The idea that young and old red cells are equally susceptible to damage by storage receives support from an observation of Ozer and Chaplin (1963) using an antiserum that agglutinated stored red cells but not fresh red cells; young cells became agglutinable on storage to the same extent as old red cells.
Red cells stored for 28 days or more in ACD show a different survival pattern (see Figure 9.2). About one-quarter is removed in 24 h and the remainder disappears at a rate distinctly faster than 1% a day. This finding suggests that after relatively long periods of storage, young red cells suffer more than old red cells, or alternatively that post-transfusion survival of all the red cells is adversely affected. In experiments in dogs, after storage for 20 days young red cells were far more severely damaged than old red cells (Gabrio and Finch 1954).
Morphology, Deformability and Viability
During storage, red cells undergo changes in morphology (see above) related to loss of ATP with ensuing lipid membrane changes and transform from flexible, deformable biconcave disks to reversibly deformed echinocytes and eventually to irreversibly deformed spheroechinocytes (Kamp et al. 2001). Changes in morphology influence aggregability and adherence to the vascular endothelium (Berezina et al. 2002; Card et al. 1982). These shape changes are reflected in changes in filterability, ektacytometry, and osmotic fragility and correlate with decreased RBC survival, probably as a result of increased splenic sequestration and destruction.
The controversy regarding the clinical importance of ‘old’ red cells is addressed in Chapter 15.
Effect of Storage Temperature on Maintenance of Red Cell Viability
The refrigeration of blood is expected to slow metabolism and, thus, to enhance preservation, and to slow the growth of possible bacterial contaminants. Blood is commonly stored at a temperature of between 2°C and 6°C, but the reasons for the choice of this temperature are not obvious. Presumably, the intention has always been simply to keep blood as cold as possible without allowing it to freeze. In fact, blood mixed with ACD solution freezes at about −0.5°C and may be supercooled to −3°C and maintained indefinitely at that temperature without freezing (Strumia 1954). It might, therefore, appear that a temperature in the region of, say, 0°C to 2°C ought to be used, rather than 2–6°C. It is rather surprising that so few attempts have been made to discover the optimal temperature for red cell preservation.
Only one study has been published of the effect on red cell viability of varying the storage temperature in the range −10°C to +10°C, but it provides valuable information. The red cells of four subjects were stored on successive occasions at −10°C, −2°C, +4°C and +10°C for 34 days before being labelled with 51Cr and re-injected into the subject’s circulation. It was thus possible to compare the survival of each subject’s red cells at the four temperatures. The same solution, containing glycerol as well as citrate, phosphate and dextrose was used throughout. The mean post-transfusion (24-h) survival after 34 days’ storage was: −10°C, 80%, −2°C, 78%, +4°C, 63%, +10°C, 52% (Hughes-Jones 1958b). The trend is interesting even if the differences are within the margin of error for the assay.
Blood can be kept at 20–24°C for many hours before being stored at 4°C with very little adverse effect, provided that it is cooled rapidly to 22°C after collection. Holding at 20–24°C for up to 24 h, followed by storage at 4°C (with Adsol) for up to 42 days had scarcely any effect on survival: comparing a holding period at 20–24°C of 24 h with 8 h, survival after 35 days was 79.4% vs. 79.0% and after 42 days was 73.0% vs. 76.2% (Moroff et al. 1990).
Warming blood to 22°C for 24 h after storage at 4°C (in ACD) for various periods was found to have a slightly adverse effect compared with storage at 4°C throughout: the survival figures were as follows (unwarmed results first): after 7 days, 92% vs. 87%; after 21 days, 84% vs. 78%; and after 28 days, 75% vs. 62% (Shields 1970).
Red cells deteriorate rapidly at 37°C in ACD. The DPG level falls to 20% in 5 h. After 24 h, only 30% of the cells are viable and after 48 h, virtually none (Jandl and Tomlinson 1958). Even if blood is incubated at 37°C for only 2 h immediately after withdrawing it from the donor and is then stored for 28 days, red cell survival diminishes significantly compared with the survival of red cells from the same donor stored for the same period but without 2-h incubation (Table 9.4).
In experiments on rabbit red cells, incubation at 41.5°C for 8 h was shown to produce substantial damage, with survival at 4.5 h only 60% (Karle 1969).
Effect of Delayed Cooling on 2,3-Diphosphoglycerate in Red Cells
Extended storage of whole blood at 22°C decreases the concentration of red cell DPG, whether or not the units have been rapidly cooled to this temperature (Pietersz et al. 1989). Estimates of the fall in 2,3-DPG in CPD or CPD-Adsol blood kept at ambient temperature for 6–8 h are: after 6 h, 13% (Avoy et al. 1978) and 27% (Moroff et al. 1990), and after 8 h, 43% (Moroff et al. 1990). The storage temperature of 2–8°C reduces erythrocyte metabolism about 40-fold, slowing down the normal aging process. Prompt cooling to below 15°C prevents the loss of DPG from red cells. Blood taken freshly (into bottles) has a temperature of 30°C, but within 2 h of putting single bottles (or bags) into a ventilated cold room, the temperature of the blood has fallen below 15°C (Prins and Loos 1970).
Effect of Plasticizers on Stored Red Cells
Di (2-Ethylhexyl) Phthalate
As described in Chapter 15, the plasticizer di-2-ethylhexyl phthalate (DEHP) leaches into blood during storage. The plasticizer is taken up by the red cell membrane and has the effect of diminishing the rate of progressive lysis of the red cells and of enhancing resistance to hypotonic lysis (Rock et al. 1983; Estep et al. 1984; Horowitz et al. 1984). In a convincing experiment, addition of phthalate to stored blood had the effect of substantially slowing the rate of loss of viability of the red cells, whether they are stored in plastic or glass containers (AuBuchon et al. 1988). The risk to humans associated with DEHP exposure from the use of plastic blood bags and other medical devices is unknown. For a brief discussion of the toxicity of phthalates, see Chapter 15.
Butyryl-N-Trihexyl Citrate
Because of the potential toxicity of phthalates, a new type of plastic, PL-2209, incorporating butyryl-ntrihexyl citrate (BTHC), a plasticizer that is less toxic than di (2-ethylhexyl) phthalate (DEHP), has been tested. Like DEHP, BTHC reduces red cell lysis during storage, although to a lesser extent. Red cell viability is as well maintained with either plastic (Buchholz et al. 1989; Högman et al. 1991). Few countries have eliminated blood bags containing DEHP, in part because of the odour of BTHC, but primarily because of the increased cost.
Effect of Irradiation of Red Cells, Stored Either Beforehand or Subsequently
A dose of 25 Gy is required for complete T-cell inactivation in stored red cells as measured by a limiting dilution assay of proliferation (Pelszynski et al. 1994). Doses of this order applied to red cell suspensions that are then stored, affect red cell viability adversely. In a paired study in eight normal subjects, blood was drawn into AS-1, irradiated with 30 Gy and then stored for 42 days; compared with non-irradiated blood from the same subjects, 24-h red cell survival was lower (68.5% vs. 78.4%), as was ATP (Davey et al. 1992). A more detailed study of red cells stored in AS-1 suggested that red cell viability is maintained for 28 days from collection, regardless of when the cells are irradiated, but that irradiation of cells at day 14 after collection impairs viability to an unacceptable degree if the cells are stored for a full 42 days (Moroff et al. 1999). In the USA, the FDA and the AABB recommend that red cells may be irradiated throughout their shelf-life but may be subsequently stored for only 28 days (or up to the end of the storage period for the non-irradiated product if this is less). This recommendation is not supported by the data above, although a reduction in 24-h red cell survival (<75%) may be a reasonable trade-off for avoiding GvHD. The current data support a standard that permits storage up to 28 days after collection regardless of the day of irradiation. The CoE has adopted a standard that meets this requirement (Council of Europe 2003).
When red cells are irradiated and then stored, supernatant potassium increases substantially. With 30 Gy, an approximate doubling within 48 h has been noted (Ramirez et al. 1987) and, after 42 days, an increase to a mean of 78 mEq/l compared with 43 mEq/l in non-irradiated control samples (Davey et al. 1992). The increased amount of potassium in the red cell supernatant following irradiation and storage is of no clinical significance except in exchange transfusions or when massive transfusions are given to infants.
Effect of Irradiation before Freezing
In a controlled study, red cells were exposed to 15 Gy before being stored at 4°C for 6 days, then frozen in glycerol and stored for 8 weeks. After 6-day storage at 4°C, supernatant potassium was about twice as high with the irradiated cells but, after freezing and deglycerolization, there were no differences between irradiated and control groups with respect to ATP, DPG and survival in vivo (Suda et al. 1993).
Storage of Red Cells in the Frozen State
Satisfactory storage of red cells in the frozen state became possible when it was discovered that red cells, mixed with glycerol, could be frozen and thawed without damage (Smith 1950). Rabbit red cells, after being dialysed free of glycerol and transfused, were capable of circulating in vivo (Sloviter 1951) and human red cells, previously frozen to −79°C in glycerol, survived well in humans (Mollison and Sloviter 1951).
Red cells must be rendered glycerol free before being transfused and, unfortunately, rapid, simple, inexpensive closed-system methods for doing so have proved elusive. For these reasons, small use has been made of frozen red cell depots. Nevertheless, prolonged storage is invaluable in some circumstances and evolving technology may alter the use of frozen red cell reserves (Bandarenko et al. 2004).
Effects of Freezing
The damaging effects of freezing are related to the rate of cooling: at slow rates, there is time for water to leave the cell in response to the osmotic gradient created when extracellular water freezes. Many of the tissue-damaging effects of freezing are those expected from exposure of the tissues to a hypertonic solution followed (on thawing) by exposure to an isotonic solution. This observation suggests that the salt concentration is responsible for cell injury caused by freezing and thawing (Lovelock 1953a). However, later work suggests that, at slow rates of freezing, the loss of intracellular water and the associated reduction in cell volume, rather than the absolute concentration of solutes, is responsible for injury (Meryman 1971). The mechanism of damage seems to be either intracellular dehydration or stress to the cell membrane (Meryman 1989).
With rapid freezing, there is time for only part of the freezable water to leave the cell so that there is less dehydration and the cells may largely escape injury (Meryman 1989). Frog cells subjected to ultra-rapid cooling and thawing can be recovered intact (Luyet and Gehenio 1940). On the other hand, cooling at even faster rates leaves too little time for water to leave the cell and damage occurs due to formation of intracellular ice rather than to the effects of hypertonicity (Mazur et al. 1972).
Substances That Protect Against Damage by Freezing
Substances That Do Not Penetrate Cells
Damage to cells during freezing can be reduced by adding a substance that does not penetrate the cell membrane but increases solution viscosity and reduces the optimum cooling velocity (Meryman 1989). Substances that have been shown to be effective include various sugars and colloids, including dextrose, lactose, sucrose, albumin, hydroxyethyl starch (HES), polyvinyl pyrrolidone (PVP) and dextran. With all of these substances the rates of freezing and thawing must be very rapid if lysis is to be avoided.
The addition of glucose to blood has been used to reduce damage during very rapid freezing and thus preserve red cells for serological tests. If a small volume of citrated blood is mixed with an equal volume of 20% glucose and immediately frozen, only 2–3% lyses on thaw (Florio et al. 1943). Similarly, red cells can be mixed with glucose and then sprayed into liquid nitrogen; the resulting droplets are kept at the temperature of liquid nitrogen (−196°C) and subsequently thawed by being dropped into warm saline (Meryman 1956).
Substances That Penetrate Red Cells
Several cell-penetrating substances have been shown to prevent damage during the slow freezing and thawing of red cells, but of these, glycerol stands out because of its low toxicity. Glycerol limits ice formation and provides a liquid phase in which salts are distributed as cooling proceeds so that excessive hypertonicity is avoided (Lovelock 1953b). Glycerol is most effective in protecting those cells that it permeates fairly rapidly; human red cells are ideal in this regard.
Use of Glycerol
In 1949 Polge et al. (1949) discovered by fortunate accident that glycerol protects spermatozoa against the otherwise lethal effects of freezing, and soon afterwards Smith (1950) found that red cells could also be protected. The following description of the way in which the protective effect of glycerol was discovered is based on published accounts (Sloviter 1976; Parkes 1985), supplemented by a personal communication from C Polge.
Related posts:
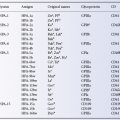 Immunology of leucocytes, platelets and plasma components
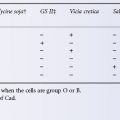 Red cell antibodies against self-antigens, bound antigens and induced antigens
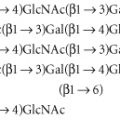 ABO, H, LE, P1PK, GLOB, I and FORS blood group systems
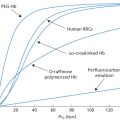 Alternatives to allogeneic transfusion
 The transfusion of platelets, leucocytes, haematopoietic progenitor cells and plasma components
Stay updated, free articles. Join our Telegram channel

Full access? Get Clinical Tree


