Fig. 1
ROC curves produced (1) by an MLP ANN using a leave-one-patient-out approach (upper curve) and (2) by LOS assignments primarily based on B-mode appearance (lower curve). The vertical axis is True-positive Fraction (TPF), which is equivalent to sensitivity; the horizontal axis is False-positive Fraction (FPF), which is equivalent to 1 minus specificity
This means that if this classification improvement could be translated into real-time images used for biopsy guidance by the urologist during a biopsy procedure, then a marked improvement in biopsy yield would be possible. Similarly, such images, whether generated in real time or off-line, could make targeted or focal treatments a clinical reality.
A similar approach was used for developing and assessing the SVM classifier, which has the advantage of being less vulnerable with respect to false minima, overtraining, and excessive dimensionality. As was the case with ANN development, the data, consisting of intercept, midband, and PSA values plus the actual, histologically determined tissue type (cancerous vs. noncancerous), were analyzed using SVM methods. An ROC analysis showed the SVM-based classification performance to be equivalent to the performance of the MLP ANN. However, the advantages of SVMs in terms of robustness to false minima, etc., mitigate in favor of using SVMs for prostate-tissue classification.
Tissue-type Image Development
TTIs represent the likelihood of cancer at each pixel or voxel within an ROI. To provide the most-rapid processing, we chose to use a LUT to assign values to pixels within the ROI.
Figure 2 shows an SVM-based LUT surface plot for a PSA level of 7.5. The surface plot depicts the relative likelihood of cancer on the vertical axis for the given PSA value. As PSA value increases, all likelihood values increase, but with less emphasis in any particular region of the midband-intercept space, i.e., the LUT surface plot tends to flatten as it rises with increasing PSA values.
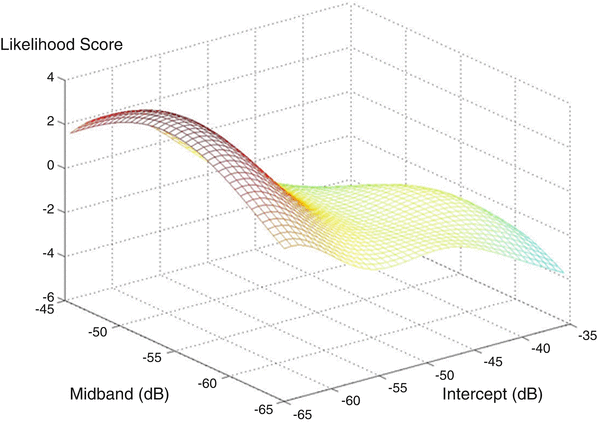

Fig. 2
An SVM-based LUT for a PSA value of 7.5 showing a broad peak in the score value for relative cancer likelihood at low (negative) intercept and intermediate midband parameter values. The vertical axis is the cancer-likelihood score; the horizontal axis on the left is the midband axis, with decreasing values toward the viewer; the horizontal axis on the right is the intercept axis with decreasing values toward the viewer
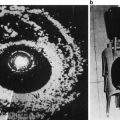
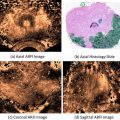
The computed spectral parameter values of midband and intercept are entered into the TTI software for each pixel location along with the patient’s PSA level. The combination of midband, intercept, and PSA-level values for each pixel falls on a specific step in the LUT. The value for the relative cancer likelihood at that step in the LUT is returned, and the likelihood value is translated into a color-encoded or gray-scale value for the corresponding pixel in the TTI image. Figure 3 shows an example of a TTI for a prostate that was scanned in situ immediately prior to prostatectomy while the patient was in the operating room. Subsequent prostatectomy histology showed a 12-mm, previously unrecognized, anterior tumor as well as smaller cancer foci and some PIN tissue. The left image in Fig. 3 is the gray-scale TTI; the center image is a midband-parameter image of the same scan plane with superimposed TTI color encoding to display the regions of highest relative likelihoods for cancer; the right image is the approximately corresponding whole-mount histology section, which clearly shows the demarcated anterior tumor and some smaller foci of cancerous and PIN tissue. The planes of the US scans and whole-mount histology are not necessarily identical, but are at the widest gland cross section and clearly overlap in the region of the anterior tumor.


Fig. 3
TTI images compared to postsurgical histology. Gray-scale TTI image (left image) and a color-overlay TTI on a midband image (center image) show a high suspicion of cancer in a large anterior tumor and smaller nearby foci. (In the color image, red depicts the highest cancer likelihood and orange the second-highest likelihood.) Whole-mount prostatectomy histology (right image) shows demarcations made by the pathologist to indicate cancerous and precancerous neoplastic tissue, particularly a large (12-mm) anterior tumor that was not detected previously by conventional imaging or palpation. All views are from the apex: the patient’s right is the viewer’s left; his anterior is up (reprinted with permission from Ultrasonic Imaging [28])
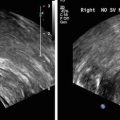
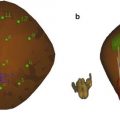
Additional examples of TTIs are the 3D versions of this same prostate, as shown in Fig. 4, and the biopsy-search-window ROI in the TTIs of Fig. 5. In Fig. 4, the most highly suspicious volumes are depicted in red. The representation of the gland in Fig. 4 was generated from a set of parallel scan planes acquired at 5-mm plane separations; 2D TTIs were generated for each plane. The set of 2D TTIs was assembled into a 3D rendering using manual demarcation of the gland surface and TTI color-encoding to demarcate the tumor surfaces automatically. In Fig. 4, the gland is rotated so that it is viewed through the base rather than viewing it more conventionally from the apex as shown in Fig. 3. This 3D rendering could be extremely useful in planning therapy. For example, the rendering clearly shows that a nerve-sparing approach could be applied with a tight margin on the right portion of the gland, but a more generous and cautious one on the left side. The 3D TTI could also provide input for planning focal or differential radiation, cryo-ablation, or HIFU treatments. The illustrative biopsy-guidance TTI windows of Fig. 5 were generated from two separate scans of the same biopsy patient. In this figure five levels of relative cancer likelihood are shown, with green indicating the lowest likelihood, yellow-green a slightly higher likelihood, yellow an intermediate likelihood, orange a moderately high likelihood, and red the highest likelihood. The left image in Fig. 5 was generated from a plane in which the biopsy subsequently proved to be positive; the right image was from a plane that had a negative biopsy. If such images had been available to guide the biopsies in real time, the biopsy needle certainly could have been targeted into the red and orange regions shown in the left image, but the green and yellow-green regions in the right image might have been spared.
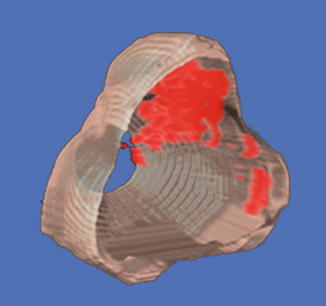
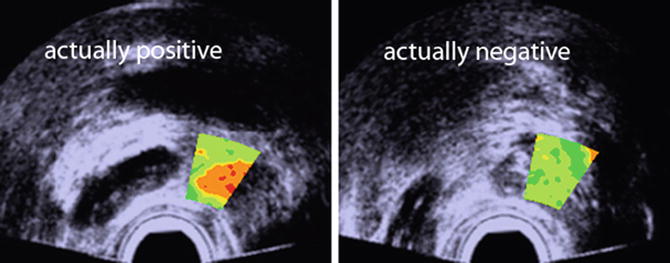

Fig. 4
3D TTI of the gland shown in Fig. 3. Cancerous regions warranting dose escalation in ablative treatments or a conservative (wide) surgical margin are clearly indicated; regions that could be spared in ablative treatments or safely could undergo nerve-sparing surgery also are apparent. All views are from the base; i.e., the gland is rotated around its vertical axis compared to Fig. 3 (reprinted with permission from Ultrasonic Imaging [28])

Fig. 5
Illustrative biopsy-guidance images with a small TTI ROI window. Two planes from the same patient are shown. Color encoding is used to depict cancer likelihood; the highest likelihood is depicted in red and the lowest in green; the background gray-scale image is a midband image. The actual biopsy histology was positive in the left image and negative in the right one. This type of search-window TTI could be used to guide biopsies more effectively (reprinted with permission from Ultrasonic Imaging [26])
Summary
Focal treatments for prostate cancer may reduce treatment toxicity without degrading treatment efficacy as long as regions of the gland that harbor cancer are effectively treated. Therefore, a key requirement for focal treatment is reliable imaging of the cancer within the gland. Similarly, biopsies that are guided by images that present the likelihood of cancer can improve the positive yields of core-needle biopsies while simultaneously reducing or eliminating the current need to insert the needle blindly into the gland.
The studies described here use sophisticated, nonlinear methods of classification to distinguish cancerous from noncancerous tissues based on spectrum analysis RF echo signals. At present, these methods rely on ANNs and SVMs, and although more than 600 samples are available from more than 60 patients in the data set cited above, only 17 % of the samples in our most-recent data set are cancerous. Considering the range of possible expressions of cancerous and noncancerous prostatic tissues, further study certainly is required to increase the number of independent samples and to assure that the classifier has sufficient generality. Furthermore, a conservative perspective would consider the patients, and not the biopsy cores, to be the independent samples; to take that perspective into account, a much larger data set is required to fully validate the method and allay concerns regarding the generality of the classifier.
Confidence in reliable ultrasonic TTIs, such as the ones under development and described here, can enable detection and treatment of prostate cancer to advance dramatically. The ultrasonic TTIs illustrated in this chapter can be applied clinically either as pure US techniques using existing digital technology to generate TTIs in real time or they can be used alone or in combination with other modalities (e.g., magnetic resonance imaging) to produce even more powerful methods of imaging prostate cancer. As an example, the mechanical properties sensed by US and exploited in US-based TTIs also can be applied in conjunction with spatially matching chemical properties sensed by magnetic resonance spectroscopy methods, with perfusion and diffusion properties sensed by contrast-enhanced magnetic resonance, or with metabolic properties sensed by positron emission methods. Admittedly, such hybrid methods require reliable means of spatial co-registration, but modern image-processing technology seems to be on the verge of enabling such co-registration to be performed quickly and accurately. The practicing urologist would then have a hybrid TTI based upon real-time US with co-registration of the MRI to produce a fused image that indicates regions of the gland likely to be harboring disease.
The inability of current imaging methods to depict suspicious regions reliably is well recognized and it prevents many patients from choosing the option of active surveillance. A reliable means of imaging cancerous foci would give patients confidence that their diseases can be monitored safely and non-invasively, and consequently, unnecessary treatment of indolent disease could be avoided. Once these QUS-based TTI methods are more fully validated by the ongoing studies cited in the acknowledgments below, clinical implementation should be straightforward.
Acknowledgements
The studies described in this chapter were inspired, guided, and encouraged by the late Edgar A. Parmer, William R. Fair, and Frederic L. Lizzi. Roslyn Raskin provided invaluable assistance in preparing the manuscript, particularly her meticulous proofreading. Paul Lee, Stella Urban, and Ronald Silverman made vital contributions to the classification aspects of the studies. The original prostate TTI research was supported in part by NIH/NCI grant CA053561 and the Riverside Research Fund for Biomedical Engineering. Current studies to integrate TTIs with prostate-HIFU instruments and to integrate US TTIs with MR methods are supported by NIH/NCI grants CA135089 and CA140772, respectively. Current studies applying envelope statistics in combination with spectrum-analysis methods to distinguish cancerous from noncancerous tissue in lymph nodes are supported by NIH/NCI grant CA100183. Some images are shown with permission from Ultrasonic Imaging, as indicated in their figure legends.
Appendix
The basic theories of scattering in tissue assume that scattering is weak and the Born approximation applies [53]. In essence, this approximation considers scattering behavior to depend solely on the interaction between scatterers and the incident field; i.e., it assumes that the total field, which includes contributions that result from scattering, can be replaced by the incident field alone because the contribution of the scattered field to the total field can be ignored. The theoretical framework first published by Lizzi in 1983 expresses the spectrum of the backscattered echo signals received at the transducer as an integral over three spatial autocorrelation functions: the three-dimensional autocorrelation function of spatial variations in relative acoustic impedance, which defines the acoustic properties of the scatterers themselves; the two-way beam-directivity autocorrelation function, which specifies the behavior of the incident-beam profile in two dimensions transverse to the beam-propagation direction; and the one-dimensional autocorrelation function of the time-domain window used to select backscattered signals for spectral processing [34–37]. The fundamental equation derived by Lizzi et al. for a normalized (system-corrected) spectrum is
 where S is the normalized power spectrum (i.e., the spectrum that is corrected for the acoustical and electronic properties of the system), k is the wave number (2π/λ where λ is the wavelength of the US), R ζ(Δx) is the spatial autocorrelation function of the distribution of the relative acoustic impedance of the scatterers, R D(Δy, Δz) is the autocorrelation function of the two-way US beam-directivity function, and R G(Δx) is the autocorrelation function of the gating function (typically a Hamming or Hanning window, which resembles a squared cosine function) [34].

The power spectrum is computed by digitizing RF echo signals over some or all of a scanned plane or volume; defining an ROI for analysis within that plane or volume; gating a portion the RF signals within the ROI by multiplying a gating function times the selected RF data; computing the squared magnitude of the Fourier transform of the gated RF signals; and converting the result to decibels (dB) (i.e., ten times the log of the squared magnitude of the Fourier transform). Because of the randomness of a typical spectrum derived from tissue echo signals, ample averaging is required and is performed by shifting the gating window, repeating the spectral computation, and averaging the results computed over the entire ROI. Once the average power spectrum is computed, normalization is performed to correct for system properties, and parameters representing the spectrum are calculated and related by theory to tissue properties.
Stay updated, free articles. Join our Telegram channel

Full access? Get Clinical Tree


