Highlights
- •
MRI/TRUS fusion TP PBx clinically significant prostate cancer detection rates were consistent across the chronological quintiles.
- •
Procedure time significantly reduced from a median of 46 to 19 minutes, with proficiency achieved after 156 cases.
- •
Patient self-reported pain levels were low and similar throughout the learning curve.
- •
Complication rates were low and similar across quintiles (range, 0–5.4%; P = 0.3).
Abstract
Objective
To evaluate the learning curve of a transperineal (TP) magnetic resonance imaging (MRI) and transrectal ultrasound (TRUS) fusion prostate biopsy (PBx).
Materials and Methods
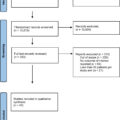
Consecutive patients undergoing MRI followed by TP PBx from May/2017 to January/2023, were prospectively enrolled (IRB# HS-13-00663). All participants underwent MRI followed by 12 to 14 core systematic PBx (SB), with at least 2 additional targeted biopsy (TB) cores per PIRADS ≥3. The biopsies were performed transperineally using an organ tracking image-fusion system. The cohort was divided into chronological quintiles. An inflection point analysis was performed to determine proficiency. Operative time was defined from insertion to removal of the TRUS probe from the patient’s rectum. Grade Group ≥2 defined clinically significant prostate cancer (CSPCa). Statistically significant if P < 0.05.
Results
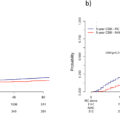
A total of 370 patients were included and divided into quintiles of 74 patients. MRI findings and PIRADS distribution were similar between quintiles ( P = 0.08). The CSPCa detection with SB+TB was consistent across quintiles: PIRADS 1 and 2 (range, 0%–18%; P = 0.25); PIRADS 3 to 5 (range, 46%–70%; P = 0.12). The CSPCa detection on PIRADS 3 to 5 TB alone, for quintiles 1 to 5, was respectively 44%, 58%, 66%, 41%, and 53% ( P = 0.08). The median operative time significantly decreased for PIRADS 1 and 2 (33 min to 13 min; P < 0.01) and PIRADS 3 to 5 (48 min to 19 min; P < 0.01), reaching a plateau after 156 cases. Complications were not significantly different across quintiles (range, 0–5.4%; P = 0.3).
Conclusions
The CSPCa detection remained consistently satisfactory throughout the learning curve of the Transperineal MRI/TRUS fusion prostate biopsy. However, the operative time significantly decreased with proficiency achieved after 156 cases.
1
Introduction
Transrectal (TR) ultrasound-guided prostate biopsy (PBx) is the most common approach for diagnosing prostate cancer (PCa) in the United States [ ]. However, the use of the transperineal (TP) PBx approach has been increasing, driven by greater exposure to the technique, concerns about infectious complications associated with TR PBx and antibiotic stewardship [ ]. In fact, in some countries, the TR approach is heading toward complete abandonment [ ].
The magnetic resonance imaging (MRI) and transrectal ultrasound (TRUS) fusion PBx technique facilitates targeting MRI-informed lesions for PCa diagnosis. Despite the growing adoption of the TP approach, there is a notable scarcity of studies evaluating the learning curve of MRI/TRUS fusion TP PBx. Understanding the learning curve of MRI/TRUS fusion TP prostate biopsies is needed to enable its widespread integration into clinical practice and training programs, ensuring timely and effective implementation.
This prospective study aimed to evaluate the learning curve of MRI/TRUS fusion TP PBx performed by a single operator and to determine the number of cases required to achieve proficiency by assessing procedure time, clinically significant PCa (CSPCa) detection, complications, and patient self-reported pain levels.
2
Materials and methods
2.1
Study population
This is a prospective study where consecutive patients who underwent multiparametric magnetic resonance imaging (mpMRI) followed by TP PBx between May 2017 and January 2023 were enrolled (IRB# HS-13-00663). Inclusion criteria: patients who underwent mpMRI followed by TP PBx for I) suspicion of PCa; II) active surveillance or restaging PBx for PCa. Exclusion criteria: patients with I) prior treatment for PCa; II) any prior surgery for benign prostatic hyperplasia; III) saturation PBx; IV) those with mpMRI that did not meet Prostate Imaging Reporting and Data System (PIRADS) standards [ , ].
2.2
MRI acquisition and interpretation
The detailed MRI protocol has been described elsewhere [ , ]. The mpMRIs were evaluated according to the PIRADS versions 2.0 or 2.1, by experienced radiologists [ , ]. Prostate MRIs performed outside the institution were re-reviewed by our institutional radiologists and were included if they met PIRADS standards.
2.3
Prostate biopsy protocol
All PBx were carried out transperineally using a 3-dimensional organ-tracking elastic image-fusion system (Trinity, Koelis®, France) and 18G needle-biopsy, under local anesthesia or sedation, as previously described [ , ]. Those who underwent TP PBx under local anesthesia received only lidocaine without any analgesics or anxiolytics [ , ]. The procedures were performed using a freehand technique with a coaxial needle, without a grid template apparatus or probe-mounted needle guide [ ]. All patients underwent 12 to 14 cores templated systematic biopsies (SB), with a minimum of 2 additional targeted cores per each PIRADS 3 to 5 lesion, as described elsewhere [ , , ]. The PBx specimens were individually labeled and submitted in separate containers for uropathologist evaluation according to the International Society of Urological Pathology (ISUP) guidelines [ ].
Antibiotic prophylaxis was gradually de-escalated based on the evolving evidence supporting the safety of performing TP PBx without antibiotics [ ]. Therefore, most patients at the beginning of this series received a single prophylactic dose of Cefuroxime 500mg, while most recent biopsies were antibiotic-free [ , ]. Patients with cardiac valve disease or replacement, those immunosuppressed, and those with a history of acute prostatitis routinely received injectable Gentamicin or Ceftriaxone prior to the biopsy [ , , ].
2.4
Stepwise approach
All biopsies in this study were performed by a single urologist (ALA) who had a large experience with over 1500 MRI/TRUS fusion transrectal PBx under local anesthesia before adopting the TP PBx approach [ , , ]. It is important to note that TP PBx has been performed in the U.S. for a long time. However, TP MRI/TRUS fusion PBx is more recent, with platforms becoming available in 2017 [ , ]. As such, the availability of proctoring and/or educational materials or videos was limited. As an earlier adopter of this approach and technique in the U.S., the operator considers himself as self-taught. Therefore, the initial plan involved implementing a stepwise approach by starting with MRI/TRUS fusion TP PBx in the operating room and then transitioning to local anesthesia in clinic.
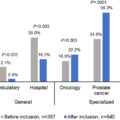
The cohort was divided into chronological quintiles (Q1 to Q5), as previously described [ ]. Most of the patients in the 1st quintile underwent TP PBx under sedation in the operating room, whereas the majority of patients in the 2nd to 5th quintiles had their biopsies performed under local anesthesia in the outpatient clinic [ , ]. Once the operator had transitioned to preferentially performing his cases under local anesthesia, the use of sedation was then based on patient preference.
2.5
Endpoints and definitions
The study’s primary endpoints were the detection of CSPCa on SB, TB, and SB plus TB among the chronological quintiles and the number of cases needed to achieve proficiency based on operative time. The secondary endpoint was the 30-day postoperative complication rates. Patients’ demographics, MRI findings, the patients’ self-assessed pain and histologic PBx characteristics were also analyzed.
Clinically significant prostate cancer (CSPCa) was defined as Grade Group ≥2. Operative time was defined as the time from when the TRUS probe was inserted to when it was removed from the patient’s rectum. Complications were recorded up to 30 days post-PBx and reported according to the Clavien-Dindo classification as previously described [ , , ]. The pain was self-assessed by the patients, only in those who underwent TP PBx under local anesthesia, using a visual analog scale (0–10) immediately after the procedure [ ].
Race and ethnicity were self-reported according to U.S. National Institutes of Health standards, as follows: Hispanic or Latino (Latino); non-Hispanic Asian (Asian), non-Hispanic Black or African American (Black), non-Hispanic White (White), and Others (Native Hawaiian or Other Pacific Islander; American Indian or Alaska Native; and those who did not report or identify as any race or ethnicity).
2.6
Statistical analysis
The statistical software package SAS version 9.4 (SAS Institute Inc., Cary, NC, USA) was used for all analyses in this study. The Wilcoxon rank sum test was used for continuous variables, and Pearson’s chi-square was used for categorical variables. Univariable and multivariable logistic and linear regressions were performed to model the dichotomous and continuous outcomes, respectively, with different periods of PBx and other predictors. The inflection point analysis was used to determine the number of cases to reach proficiency for operative time [ , ]. A 2-sided P -value of < 0.05 was considered statistically significant.
3
Results
A total of 370 patients met the inclusion criteria and were divided into quintiles of 74 men each. The median (IQR) age, family history of PCa, previous biopsy history, prostate-specific antigen (PSA), PSA density, digital rectal examination findings, and clinical staging were similar between quintiles ( Table 1 ). MRI findings were also similar between quintiles, with no difference between PIRADS 1 and 2 and 3 to 5 distribution ( P = 0.08) ( Table 2 ).
| All patients | ||||||
|---|---|---|---|---|---|---|
| Q1 | Q2 | Q3 | Q4 | Q5 | P | |
| No. of Patients | 74 | 74 | 74 | 74 | 74 | – |
| Age, year, median (IQR) | 66 (61–71) | 68 (63–72) | 67 (61–73) | 66.5 (61–73) | 64.5 (59–69) | 0.2 |
| Family History PCa, n (%) | 20 (29) | 17 (24.3) | 19 (28) | 16 (24.6) | 21 (29.2) | 0.9 |
| Race, n (%) | 0.005 | |||||
| Asian | 10 (13.5) | 5 (6.8) | 12 (16.2) | 8 (10.8) | 10 (13.5) | |
| Black or African American | 1 (1.4) | 6 (8.1) | 5 (6.8) | 4 (5.4) | 2 (2.7) | |
| Latino or Hispanic | 8 (10.8) | 7 (9.5) | 5 (6.8) | 15 (20.3) | 14 (18.9) | |
| Other or not reported | 6 (8.1) | 16 (21.6) | 16 (21.6) | 11 (14.9) | 2 (2.7) | |
| White | 49 (66.2) | 40 (54.1) | 36 (48.7) | 36 (48.7) | 46 (62.2) | |
| Biopsy History, n (%) | 0.12 | |||||
| Naïve | 42 (56.8) | 43 (58.1) | 46 (65.7) | 49 (67.1) | 53 (72.6) | |
| Negative | 19 (25.7) | 14 (18.9) | 19 (27.1) | 13 (17.8) | 10 (13.7) | |
| In active surveillance | 13 (17.6) | 17 (23) | 5 (7.1) | 11 (15.1) | 10 (13.7) | |
| PSA, ng/ml, median (IQR) | 7.3 (4.9–11.3) | 7.9 (6–11.1) | 6.4 (4.2–9.7) | 6.5 (4.8–9.9) | 6.3 (4.8–10.8) | 0.18 |
| PSA density, ng/ml2, median (IQR) | 0.14 (0.07–0.22) | 0.13 (0.09–0.21) | 0.13 (0.09–0.17) | 0.11 (0.07–0.2) | 0.12 (0.09–0.19) | 0.5 |
| Suspicion for PCa on DRE, n (%) | 17 (23) | 16 (21.6) | 14 (18.9) | 18 (24.3) | 19 (25.7) | 0.9 |
| Clinical T stage, n (%) a | 0.6 | |||||
| T1 | 32 (74) | 33 (77) | 33 (73) | 22 (59) | 30 (65) | |
| T2a | 4 (9.3) | 5 (12) | 7 (16) | 10 (27) | 7 (15) | |
| T2b-c | 3 (7.0) | 3 (7.0) | 2 (4.4) | 1 (2.7) | 2 (4.4) | |
| T3/T4 | 4 (9.3) | 2 (4.7) | 3 (6.70 | 4 (11) | 7 (15) | |
| Anesthesia approach | <0.001 | |||||
| Sedation | 56 (75.7) | 14 (18.9) | 6 (8.1) | 6 (8.1) | 7 (9.5) | |
| Local anesthesia b | 18 (24.3) | 60 (81.1) | 68 (91.9) | 68 (91.9) | 67 (90.5) | |
a DRE findings of a possible clinical stage in case prostate biopsy confirms cancer.
b All local anesthesia procedures were done in an outpatient clinic.
| MRI PIRADS 1–2 | MRI PIRADS 3–5 | |||||||||||
|---|---|---|---|---|---|---|---|---|---|---|---|---|
| Q1 | Q2 | Q3 | Q4 | Q5 | P | Q1 | Q2 | Q3 | Q4 | Q5 | P | |
| No. of Patients, n (%) | 19 (25.7) | 22 (29.7) | 24 (32.4) | 28 (37.8) | 13 (17.6) | 55 (74.3) | 52 (70.3) | 50 (67.6) | 46 (62.2) | 61 (82.4) | ||
| Prostate Volume, cc, median (IQR) | 72 (46–117) | 65 (46–84) | 62 (39–84) | 53 (39–78) | 59 (47–100) | 0.4 | 50 (35–73) | 55 (37–70) | 45 (33–62) | 60 (39–95) | 47 (39–63) | 0.2 |
| No. MRI lesions, median (IQR) | – | – | – | – | – | 2 (1–2) | 1 (1–1) | 1 (1–2) | 1 (1–1) | 1 (1–2) | 0.001 | |
| MRI index lesion location, n (%) | ||||||||||||
| Anterior | – | – | – | – | – | 17 (30.9) | 25 (48.1) | 21 (42) | 17 (37) | 24 (39.3) | 0.5 | |
| Posterior | – | – | – | – | – | 44 (80) | 40 (76.9) | 36 (72) | 31 (67.4) | 40 (65.6) | 0.4 | |
| MRI index lesion location a , n (%) | ||||||||||||
| Base | – | – | – | – | – | 11 (20) | 16 (30.8) | 12 (24) | 10 (21.7) | 17 (27.9) | 0.7 | |
| Mid | – | – | – | – | – | 37 (67.3) | 35 (67.3) | 37 (74) | 29 (63) | 50 (82) | 0.2 | |
| Apex | – | – | – | – | – | 15 (27.3) | 23 (44.2) | 24 (48) | 12 (26.1) | 24 (39.3) | 0.07 | |
| MRI index lesion size a , mm, median (IQR) | – | – | – | – | – | 12 (9–17) | 13 (9–18) | 16 (11–21) | 13 (10–18) | 14 (10–18) | 0.07 | |
| PIRADS score, n (%) | 0.08 | |||||||||||
| PIRADS 1–2 | 19 (100) | 22 (100) | 24 (100) | 28 (100) | 13 (100) | – | – | – | – | – | – | |
| PIRADS 3–5 a | – | – | – | – | – | 55 (100) | 52 (100) | 50 (100) | 46 (100) | 61 (100) | ||
| PIRADS 3 | – | – | – | – | – | 23 (41.8) | 9 (17.3) | 12 (24) | 11 (23.9) | 13 (21.3) | 0.005 | |
| PIRADS 4 | – | – | – | – | – | 23 (41.8) | 21 (40.4) | 14 (28) | 24 (52.2) | 28 (45.9) | ||
| PIRADS 5 | – | – | – | – | – | 9 (16.4) | 22 (42.3) | 24 (48) | 11 (23.9) | 20 (32.8) | ||
Related posts:
 A systematic review of family history, race/ethnicity, and genetic risk on prostate cancer detection and outcomes: Considerations in PSA-based screening
 Prostate-specific antigen screening for prostate cancer: Diagnostic performance, clinical thresholds, and strategies for refinement
 Neoadjuvant chemotherapy before radical cystectomy in patients with organ-confined and non-organ-confined urothelial carcinoma
Comparison of outcomes between single-port and multiport retroperitoneal robotic partial nephrectomy
Neoadjuvant chemotherapy before radical cystectomy in patients with organ-confined and non-organ-confined urothelial carcinoma
Comparison of outcomes between single-port and multiport retroperitoneal robotic partial nephrectomy
 Prevalence and management of castration-resistant prostate cancer of unknown metastatic status in the real-world setting: The AfroDiTA study
 Intraoperative margin assessment with near real time pathology during partial gland ablation of prostate cancer: A feasibility study
Stay updated, free articles. Join our Telegram channel

Full access? Get Clinical Tree


