Anemia is an important cause of health loss. We estimated levels and trends of nonfatal anemia burden for 23 distinct etiologies in 188 countries, 20 age groups, and both sexes from 1990 to 2013. All available population-level anemia data were collected and standardized. We estimated mean hemoglobin, prevalence of anemia by severity, quantitative disability owing to anemia, and underlying etiology for each population using the approach of the Global Burden of Disease, Injuries and Risk Factors 2013 Study. Anemia burden is high. Developing countries account for 89% of all anemia-related disability. Iron-deficiency anemia remains the dominant cause of anemia.
Key points
- •
Anemia burden is high, affecting 27% of the world’s population—1.93 billion people—in 2013. Developing countries account for more than 89% of the burden.
- •
Preschool children and women of reproductive age are particularly affected by anemia.
- •
Iron-deficiency anemia is the dominant cause (≥60%) of anemia globally and in most populations, though there are important contributions from multiple other causes.
- •
Other important causes of anemia include hemoglobinopathies, infections, chronic kidney diseases, gastrointestinal and gynecologic conditions. Patterns vary with respect to age, sex, and geography.
- •
Individual- and population-level interventions aimed at reducing burden should take into account the context-specific epidemiology of anemia to maximize effectiveness and avoid potential harm.
Introduction
The primary role of hemoglobin is delivering oxygen to tissues and returning carbon dioxide to the lungs for elimination from the body. Any condition that leads to a shortage of functional hemoglobin or decreased red blood cell (RBC) mass may cause anemia. The pathophysiology of anemia is thus diverse and often multifactorial. Causes can include genetic mutations in hemoglobin genes, acute and chronic blood loss, inadequate nutritional intake, altered RBC morphology leading to shortened RBC life span, infectious processes, or alterations in iron and RBC metabolism secondary to chronic inflammation. A shortage of iron—the core of each hemoglobin molecule—is a common manifestation of many conditions that cause anemia.
Anemia has been associated with increased morbidity and mortality. Symptoms likely result from impaired tissue oxygen delivery and may include weakness, fatigue, concentration difficulty, or poor work productivity. Children may have issues with mental and motor development if they or their mothers are anemic. Anemia has been correlated with increased risk of preterm labor, low birth weight, child and maternal mortality, and may predispose to infection and heart failure. Although many studies have focused on iron-deficiency anemia (IDA), the findings have suggested risk in IDA exceeds that in nonanemic iron deficiency, supporting a primary role for anemia as a risk factor for poor outcomes. Even in high-income settings, anemia has been identified as related to decreased quality of life and physical functioning. It has also been shown to be an independent risk factor for fatality in patients undergoing surgical procedures and is associated with increased all-cause mortality in the general population.
Attention to the burden of anemia throughout the world has been increasing. Many early inquiries appropriately focused on populations felt to be at greatest risk—pregnant women and children in low-income countries—because they were believed to be those with the greatest problems with inadequate nutrition, high infectious disease burden, and poor access to routine health care. Subsequent studies have found the prevalence of anemia is nontrivial even in high-income countries, in nonpregnant women, and in older adults. Additionally, anemia is a common manifestation of conditions such as chronic kidney diseases (CKDs), malignancies, and autoimmune disorders.
This analysis, building on the one previously completed by our group, is intended to serve as a framework for understanding the population-specific epidemiology and pathophysiology of anemia throughout the world. We took advantage of the systematic approach of the Global Burden of Disease (GBD), Injuries and Risk Factors 2013 Study to elucidate levels and trends of anemia-related disability. This includes estimates of prevalence and years lived with disability (YLD) for mild, moderate, severe and total anemia—by underlying cause—in 188 countries, 21 GBD regions, 20 age groups, and both sexes from 1990 to 2013.
Methods
Anemia burden estimation methods were largely unchanged since GBD 2010. The details of that analysis have been described in detail previously, but will be summarized here with emphasis on the updates since that time.
Estimation of Overall Anemia
Our estimation strategy again began with the calculation of an anemia envelope—a determination of mean hemoglobin as well as sum total of anemia prevalence by severity for each country, age group, and both sexes for each year from 1990 through 2013. The envelope approach avoided double counting while capturing potentially different disease profiles within each population group. We defined a population group as a specific country, sex, age group, and year.
We used population-based surveys of hemoglobin concentration as the primary data input for envelope calculations. These data were not only the most reliable and comparable measures of anemia, coming from national and subnational measurement surveys, but also spanned the most countries and time-periods. Tabulated data from published and unpublished studies, collated by the World Health Organization (WHO) Vitamin and Mineral Nutrition Information System, were used to supplement the dataset. Most used a HemoCue test, adjusted for altitude, and excluded those with terminal or acute medical conditions. Inclusion, exclusion and diagnostic criteria for other studies were similar and can be found in each study. A full list of relevant studies is contained in the Global Health Data Exchange and the Institute for Health Metrics and Evaluation website (available at: www.healthdata.org ).
We predicted mean hemoglobin levels for all missing population groups using a mixed-effects linear regression with fixed effects on prevalence of severe underweight (<2 standard deviations below the mean; same as the GBD 2010) and age group and nested random effects on super-region, region, and country/subnational site. For these regressions, we again separated each population into 5 groups: male and female children under 5 years, pregnant females, nonpregnant females, and males over 5 years. The country- and year-specific prevalence of underweight children was obtained from the Institute for Health Metrics and Evaluation causes of death database and had been previously calculated for every year between 1970 and 2013 by using spatial–temporal regression of data from national and subnational measurement surveys.
We adopted different thresholds for defining anemia by age than were used in the GBD 2010 because they do not reflect the hematologic realities of early life. GBD 2010 thresholds had been matched with those used by the WHO in GBD 2000 , but since then, likely in recognition of the same phenomenon, WHO recommendations have been updated. Our current thresholds match those published by WHO with the exception of those under 1 month of age, where there is no internationally recommended cutoff for diagnosing anemia. The GBD 2010 and the GBD 2013 thresholds are shown in Table 1 . Our current thresholds match those published by WHO with the exception of those under 1 month of age, where there is no internationally recommended cutoff for diagnosing anemia.
| Variable | Severity of Anemia | ||
|---|---|---|---|
| Mild | Moderate | Severe | |
| Severity definitions and corresponding disability weights used to calculate GBD 2010 anemia envelope | |||
| Age <5 y | |||
| Males | 110–119 | 80–109 | 50–79 |
| Females | 110–119 | 80–109 | 50–79 |
| Age ≥5 y | |||
| Males | 120–129 | 90–119 | 60–89 |
| Females, nonpregnant | 110–119 | 80–109 | 50–79 |
| Females, pregnant | 100–109 | 70–99 | 40–69 |
| Disability weights | |||
| All cases | 0.004 (0.001-0.008) | 0.052 (0.034-0.076) | 0.149 (0.101-0.209) |
| Severity definitions and corresponding disability weights used to calculate GBD 2013 anemia envelope | |||
| Age <1 mo | |||
| Males | 130–149 | 90–129 | <90 |
| Females | 130–149 | 90–129 | <90 |
| Age 1 mo–5 y | |||
| Males | 100–109 | 70–99 | <70 |
| Females | 100–109 | 70–99 | <70 |
| Age 5–14 y | |||
| Males | 110–114 | 80–109 | <80 |
| Females | 110–114 | 80–109 | <80 |
| Age ≥5 y | |||
| Males | 110–129 | 80–109 | <80 |
| Females, nonpregnant | 110–119 | 80–109 | <80 |
| Females, pregnant | 100–109 | 70–99 | <70 |
| Disability weights | |||
| All cases | 0.005 (0.002–0.011) | 0.058 (0.038–0.086) | 0.164 (0.112–0.228) |
In recognizing the limitations of predicting the prevalence of anemia—especially severe anemia—directly from mean hemoglobin using multiple steps, we instead pooled survey microdata for each population group separately and fitted the pooled data with Weibull distributions. We then performed ordinary least-squares regression of the shape and scale parameters versus all predicted mean hemoglobin values predicted above. The prevalence of mild, moderate, severe, and total anemia was then calculated by determining the area under the Weibull curve for each population group using the hemoglobin thresholds in Table 1 . After adjusting for estimated prevalence of pregnancy, we finalized the anemia envelope by calculating YLD for each population group. YLD are the product of prevalence times disability weight for each severity of anemia. Disability weights ranged from 0 (no health loss) to 1 (equivalent to death) and were derived from population-representative surveys as described previously.
Etiologic Attribution of Anemia Cases
We performed cause-specific attribution on the anemia envelope using the same method as in the GBD 2010. Total “hemoglobin shift” was determined as the difference between the normal and predicted mean hemoglobin levels for each population group. We denoted the normal hemoglobin level as the global 95th percentile of the distribution of mean hemoglobin within each age group, sex, and year. We then determined a total shift for each country in the corresponding age group, sex, and year by finding the difference between the global “normal” and the country-specific predicted mean hemoglobin. Our model of attribution followed that, because the shift is a disease state experienced by 100% of the population, then the sum of cause-specific hemoglobin shifts times the prevalence of each contributing cause should add up to the total. Cause-specific hemoglobin shifts where unchanged from GBD 2010.
We summed shift times prevalence estimates from all causes, compared with the total predicted hemoglobin shift, and proportionally assigned. We distributed the residual envelope among 7 remaining causes. Of note, our IDA estimates include acute and chronic hemorrhagic states for which supplementation may be helpful, but poor nutritional intake is not the only underlying problem. A few causes in this category, namely, hookworm, schistosomiasis, upper gastrointestinal bleeding, and gynecologic conditions, were considered separately from IDA because there was enough data from the GBD 2013 to do so. Distribution of anemia burden to IDA only after assignment to “known” causes avoided double counting of these cases. Most other causes of anemia not specifically considered were included in the “other” categories.
Two changes in the GBD 2013 analysis affected the etiology-specific anemia estimates. First, and most important, we identified an inconsistency in this cause-specific attribution method where the total number of cases of anemia owing to a condition was not bounded to be less than the total number of cases of the condition itself. We have introduced a method in this analysis to ensure that bounds are included. Second, inherent in our method of determining “normal” hemoglobin is the fact that 5% of population groups will have zero, or negative, total shift. In these cases, or when the sum of all causes’ shift–times–prevalence estimates exceeded the total shift, we assigned the denominator to be equal to the sum of the numerators. Subsequent review of findings from National Health and Nutrition Examination Survey III suggested that the implicit assumption of zero residual—and therefore zero IDA—in the GBD 2010 approach was implausible. Based on the published rates of IDA seen in these analyses, we therefore introduced a minimum of 10% of all anemia to be assigned to residual causes in the GBD 2013.
To disaggregate marginal estimates of anemia severity and etiology into a complete set of prevalence estimates for etiology/severity pairs, we developed a new method for the GBD 2013 that used techniques from Bayesian contingency table modeling. The model combined marginal estimates on the row sums (total etiology prevalence for each cause) and column sums (total anemia prevalence by severity [mild, moderate, or severe]) with priors on the mean hemoglobin shift for each etiology and priors on the rank order of variation of severity (ie, anemia owing to malaria is expected to vary most between cases of all etiologies, whereas anemias owing to sickle cell disorders are expected to be some of the least variable in severity). We used nonlinear optimization to find the maximum a posteriori point estimate for 50 samples from estimated posterior distributions on the marginal values (etiology and severity estimates) independently for each population group, and then scaled and shifted these estimates to ensure that updated marginal row sums were all nonzero and the updated column sums matched the original draws exactly.
Uncertainty and Aggregation
The final result of our analysis was estimates of mild, moderate, and severe anemia by cause for each of 20 age groups, 188 countries, 21 GBD regions, and both sexes in 1990, 1995, 2000, 2005, 2010, and 2013. Uncertainty was propagated using Monte Carlo simulation techniques by taking 1000 draws of each quantity calculated for each population group. Aggregations by geography, age, cause, and sex were made at the draw level assuming uncorrelated uncertainty. The uncertainty interval around each quantity, at each level of aggregation, is presented as the 2.5th and 97.5th centile of the draws, which can be interpreted as a 95% uncertainty interval (UI).
Results
Our dataset for estimating the anemia envelope covered 996 separate surveys from 161 countries and contained more than 4 times as many data points as it did in the GBD 2010 (9899 vs 2425), notably including data from Turkey and India as well as subnational data from the United Kingdom, China, and Mexico.
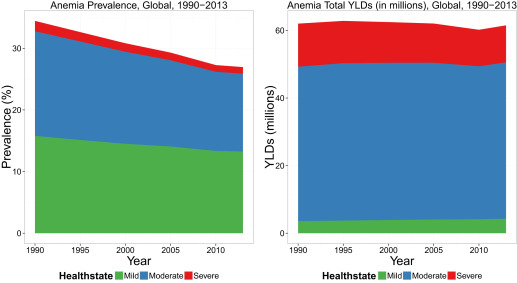
The global age-standardized prevalence of anemia was 27.0% in 2013, down from 33.3% in 1990, a decrease of approximately 21% ( Fig. 1 ). Largely owing to population growth, the total number of cases worldwide actually increased somewhat over this time period. There were a total of 1.93 billion people with anemia in 2013 (compared with 1.83 billion in 1990), including 950 million cases of mild anemia, 906 million cases of moderate anemia, and 75.6 million cases of severe anemia. The total global number of YLDs also changed very little, decreasing from 62,023,831 (95% UI, 41,591,487–89,266,761) to 61,525,570 (95% UI, 41,020,763–88,730,696) for both sexes combined.
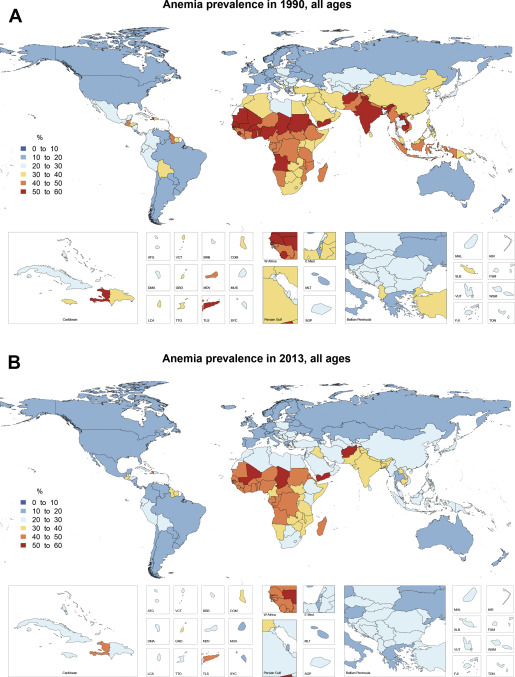
Geographic differences in anemia burden are readily apparent ( Fig. 2 ). The age-standardized prevalence rates of anemia in 2013 were greatest in central and western sub-Saharan Africa at 45.1% and 43.2%, respectively, although the greatest number of cases was in South Asia. Four countries with highest prevalence were Afghanistan, Chad, Mali, and Yemen, all of which had anemia age-standardized prevalence rates in excess of 50% in 2013, although this is an improvement from 1990 when more than 20 countries had anemia prevalence rates of greater than 50%. Anemia was nontrivial in all countries. Chile, Venezuela, Canada, and Ukraine were the lowest globally, although in each case the age-standardized anemia prevalence was still greater than 14%. Country-specific anemia prevalence and YLDs for 1990 and 2013 is shown in Table 2 .
| Location | Year | Sex | Prevalent Cases of Mild Anemia | Prevalent Cases of Moderate Anemia | Prevalent Cases of Severe Anemia | Age-Standardized Prevalence (per 100,000) | Total YLDs | Age-Standardized YLDs (per 100,000) |
|---|---|---|---|---|---|---|---|---|
| Global | 1990 | Both sexes | 839,101,225.4 (838,208,707.5–839,955,789.6) | 901,120,023.0 (899,990,318.7–902,046,164.5) | 88,720,927.6 (88,552,510.9–88,859,872.5) | 33,299.5 (33,263.5–33,331.5) | 62,023,831.1 (41,591,487.1–89,266,761.4) | 1,091.9 (732.3–1,569.5) |
| 2013 | Both sexes | 950,135,190.5 (949,030,314.0–951,108,861.0) | 905,501,750.5 (904,278,930.0–906,519,016.7) | 75,565,628.1 (75,357,541.3–75,721,856.5) | 26,991.8 (26,960.4–27,018.7) | 61,525,569.8 (41,020,762.8–88,730,696.2) | 859.3 (573.2–1,238.6) | |
| Developing | 1990 | Both sexes | 717,671,655.0 (716,867,100.8–718,498,928.4) | 803,792,125.1 (802,749,357.9–804,607,118.1) | 82,149,100.0 (81,975,156.7–82,287,958.6) | 37,954.4 (37,911.8–37,989.9) | 55,406,696.0 (37,199,421.0–79,697,035.6) | 1,248.7 (839.0–1,792.5) |
| 2013 | Both sexes | 816,531,244.4 (815,466,757.9–817,478,531.6) | 809,200,194.2 (808,094,426.7–810,128,652.7) | 69,480,441.4 (69,275,554.2–69,633,255.2) | 28,704.2 (28,668.2–28,734.0) | 54,943,619.1 (36,684,321.5–79,166,056.1) | 915.7 (611.5–1,318.6) | |
| Developed | 1990 | Both sexes | 121,429,570.4 (121,222,264.7–121,614,940.7) | 97,327,897.8 (97,066,039.9–97,597,282.9) | 6,571,827.5 (6,553,301.2–6,588,472.7) | 19,748.7 (19,713.1–19,784.2) | 6,617,135.1 (4,406,509.6–9,587,496.3) | 599.9 (398.9–868.8) |
| 2013 | Both sexes | 133,603,946.0 (133,431,595.0–133,779,611.7) | 96,301,556.3 (96,037,352.6–96,515,838.6) | 6,085,186.7 (6,067,444.4–6,101,388.3) | 19,269.5 (19,240.8–19,295.1) | 6,581,950.7 (4,387,351.3–9,536,709.7) | 580.8 (386.0–843.0) | |
| Southeast Asia, East Asia, and Oceania | 1990 | Both sexes | 272,843,162.9 (272,517,508.7–273,114,891.9) | 259,280,129.5 (258,953,407.3–259,543,749.3) | 21,568,299.3 (21,540,572.5–21,598,183.2) | 32,915.7 (32,880.9–32,943.1) | 17,333,763.7 (11,541,978.2–25,090,126.5) | 1,002.1 (668.0–1,449.8) |
| 2013 | Both sexes | 248,399,344.4 (248,087,264.3–248,675,600.5) | 203,469,039.8 (203,237,374.8–203,682,641.4) | 14,075,627.6 (14,055,440.6–14,097,074.5) | 23,542.3 (23,517.6–23,563.2) | 13,503,538.9 (8,943,371.5–19,685,329.7) | 708.2 (469.9–1,028.8) | |
| East Asia | 1990 | Both sexes | 185,710,649.9 (185,467,649.2–185,906,403.8) | 166,410,635.6 (166,187,371.7–166,593,443.7) | 12,806,104.4 (12,787,096.2–12,826,907.3) | 30,393.7 (30,361.4–30,419.3) | 11,048,546.0 (7,337,047.3–16,046,122.5) | 908.5 (604.1–1,317.2) |
| 2013 | Both sexes | 160,676,128.6 (160,442,997.7–160,882,358.4) | 124,256,712.2 (124,094,331.3–124,412,866.0) | 8,089,471.4 (8,076,864.8–8,101,249.7) | 22,066.1 (22,040.5–22,088.4) | 8,240,350.8 (5,446,745.7–12,043,703.1) | 662.0 (438.9–962.9) | |
| China | 1990 | Both sexes | 180,178,918.6 (179,944,201.7–180,368,073.8) | 161,341,194.3 (161,124,102.3–161,518,767.0) | 12,415,638.4 (12,397,214.2–12,436,710.6) | 30,501.6 (30,469.3–30,527.1) | 10,711,188.4 (7,112,678.7–15,556,170.5) | 911.3 (605.9–1,321.3) |
| 2013 | Both sexes | 154,517,804.0 (154,288,559.5–154,716,500.1) | 119,303,240.2 (119,142,419.2–119,454,208.3) | 7,742,259.4 (7,729,815.8–7,753,758.6) | 21,954.7 (21,929.0–21,976.5) | 7,909,598.3 (5,226,886.8–11,563,249.7) | 658.2 (436.4–957.6) | |
| North Korea | 1990 | Both sexes | 3,391,424.3 (3,384,778.8–3,398,259.8) | 3,084,557.1 (3,077,947.5–3,089,529.7) | 245,759.9 (244,771.8–247,432.4) | 33,541.5 (33,487.5–33,587.3) | 205,501.4 (136,769.5–298,361.6) | 1,024.5 (682.6–1,483.8) |
| 2013 | Both sexes | 3,820,259.5 (3,813,691.0–3,825,353.2) | 3,222,264.6 (3,216,318.0–3,227,823.4) | 239,662.3 (238,710.8–240,670.3) | 30,056.5 (30,005.5–30,099.1) | 214,485.8 (142,313.4–310,981.2) | 909.3 (604.2–1,317.6) | |
| Taiwan | 1990 | Both sexes | 2,140,307.0 (2,135,513.9–2,143,997.3) | 1,984,884.2 (1,979,936.2–1,989,970.2) | 144,706.1 (144,359.0–144,965.7) | 21,134.8 (21,095.4–21,171.6) | 131,856.2 (88,025.9–191,590.3) | 634.5 (423.4–921.8) |
| 2013 | Both sexes | 2,338,065.1 (2,331,317.8–2,343,939.8) | 1,731,207.4 (1,721,647.9–1,739,302.5) | 107,549.6 (107,056.7–107,958.1) | 20,109.6 (20,047.9–20,160.5) | 116,266.7 (77,736.1–169,281.4) | 610.5 (407.5–883.4) | |
| Southeast Asia | 1990 | Both sexes | 86,149,050.0 (86,047,549.0–86,252,013.6) | 91,700,835.0 (91,567,083.4–91,805,536.5) | 8,656,438.7 (8,639,493.1–8,672,081.8) | 40,055.8 (40,011.3–40,097.9) | 6,206,884.6 (4,150,478.1–8,952,476.3) | 1,258.4 (844.5–1,811.5) |
| 2013 | Both sexes | 86,391,594.5 (86,282,467.9–86,488,515.8) | 77,709,847.0 (77,610,065.5–77,800,783.6) | 5,864,052.2 (5,849,391.2–5,878,256.5) | 26,806.3 (26,774.7–26,836.7) | 5,163,748.2 (3,432,159.2–7,501,408.1) | 804.1 (535.1–1,166.2) | |
| Cambodia | 1990 | Both sexes | 2,061,813.3 (2,058,386.9–2,069,946.7) | 2,958,193.4 (2,950,675.1–2,961,684.1) | 393,544.4 (392,411.5–394,659.2) | 59,404.3 (59,290.9–59,512.1) | 207,816.8 (140,641.1–295,986.6) | 2,116.6 (1,449.0–3,008.7) |
| 2013 | Both sexes | 2,815,221.3 (2,810,036.8–2,820,586.6) | 2,943,217.8 (2,936,418.0–2,948,611.4) | 267,096.9 (265,738.5–268,213.9) | 39,106.9 (39,044.5–39,162.7) | 197,913.5 (132,501.3–285,981.3) | 1,243.9 (834.5–1,793.9) | |
| Indonesia | 1990 | Both sexes | 34,871,513.8 (34,819,231.2–34,945,635.5) | 36,636,877.7 (36,542,150.4–36,688,203.0) | 3,417,771.1 (3,404,677.9–3,429,301.8) | 41,592.6 (41,526.5–41,653.8) | 2,486,375.5 (1,657,028.9–3,591,988.0) | 1,304.2 (871.7–1,877.7) |
| 2013 | Both sexes | 34,609,446.1 (34,539,775.1–34,664,356.1) | 31,522,620.1 (31,467,501.5–31,578,171.8) | 2,402,193.1 (2,390,571.6–2,411,038.6) | 27,369.6 (27,320.0–27,414.6) | 2,101,004.5 (1,396,800.0–3,051,889.8) | 818.1 (544.0–1,186.0) | |
| Laos | 1990 | Both sexes | 915,673.6 (914,560.0–917,613.1) | 1,111,371.6 (1,109,287.9–1,112,722.1) | 120,198.5 (119,616.2–120,573.8) | 50,284.9 (50,207.8–50,352.9) | 76,864.9 (51,515.7–110,503.6) | 1,678.9 (1,129.3–2,408.3) |
| 2013 | Both sexes | 1,183,417.0 (1,181,368.4–1,185,151.2) | 1,178,914.9 (1,176,790.4–1,180,745.9) | 100,864.8 (99,998.6–101,416.5) | 35,846.1 (35,784.7–35,895.4) | 79,188.3 (52,735.8–114,371.3) | 1,093.7 (729.4–1,579.1) | |
| Malaysia | 1990 | Both sexes | 2,877,959.4 (2,872,965.5–2,883,472.2) | 2,885,387.5 (2,879,711.6–2,889,153.2) | 238,036.4 (237,307.4–238,785.7) | 31,888.7 (31,835.9–31,936.7) | 192,696.2 (128,562.5–278,681.7) | 956.9 (637.8–1,384.3) |
| 2013 | Both sexes | 3,062,031.2 (3,038,827.8–3,077,982.4) | 2,718,241.6 (2,693,914.6–2,737,495.7) | 187,727.5 (186,126.9–188,866.1) | 20,366.7 (20,224.9–20,475.0) | 178,786.7 (118,223.5–260,389.2) | 603.8 (399.6–878.7) | |
| Maldives | 1990 | Both sexes | 45,957.4 (45,881.8–46,030.2) | 54,740.5 (54,656.9–54,803.7) | 5,695.2 (5,664.3–5,718.8) | 48,534.4 (48,462.3–48,596.3) | 3,775.8 (2,528.8–5,439.2) | 1,581.8 (1,062.6–2,273.2) |
| 2013 | Both sexes | 52,331.4 (52,252.8–52,383.1) | 46,985.5 (46,905.2–47,059.8) | 3,595.4 (3,565.3–3,613.7) | 29,909.7 (29,866.4–29,942.4) | 3,130.6 (2,080.2–4,548.6) | 892.8 (594.2–1,297.4) | |
| Myanmar | 1990 | Both sexes | 8,355,107.3 (8,335,273.3–8,370,629.8) | 9,039,293.4 (8,985,513.5–9,056,607.6) | 860,098.9 (853,475.2–863,673.9) | 42,806.8 (42,673.3–42,880.9) | 611,447.5 (409,900.0–878,704.9) | 1,346.9 (905.4–1,935.5) |
| 2013 | Both sexes | 7,535,176.1 (7,523,390.5–7,544,097.6) | 6,554,959.2 (6,543,636.7–6,567,104.5) | 480,968.8 (476,203.9–482,937.0) | 27,836.3 (27,794.4–27,873.8) | 434,239.1 (288,182.8–631,172.2) | 831.3 (552.7–1,205.8) | |
| Philippines | 1990 | Both sexes | 10,715,626.0 (10,699,274.6–10,729,089.4) | 11,224,111.2 (11,207,776.5–11,237,570.5) | 973,241.3 (969,850.1–976,348.6) | 35,466.7 (35,415.8–35,513.1) | 749,518.1 (500,563.5–1,081,332.8) | 1,064.6 (711.9–1,537.1) |
| 2013 | Both sexes | 13,759,337.1 (13,732,473.9–13,780,931.2) | 13,279,133.5 (13,256,612.4–13,301,210.4) | 1,038,786.8 (1,036,072.1–1,041,569.8) | 27,476.0 (27,423.7–27,519.5) | 881,368.1 (586,376.2–1,281,441.3) | 814.1 (541.9–1,182.4) | |
| Sri Lanka | 1990 | Both sexes | 3,053,759.8 (3,048,478.6–3,060,024.9) | 3,060,485.1 (3,053,114.5–3,065,656.6) | 267,265.5 (265,911.3–268,364.4) | 36,555.1 (36,494.0–36,613.8) | 205,967.2 (137,620.4–298,286.3) | 1,132.5 (756.2–1,638.4) |
| 2013 | Both sexes | 2,777,895.1 (2,772,264.4–2,782,739.2) | 2,483,388.4 (2,478,502.1–2,488,171.3) | 179,876.1 (179,241.7–180,444.2) | 25,864.0 (25,817.7–25,908.5) | 164,704.6 (109,212.4–238,933.1) | 788.3 (523.1–1,142.7) | |
| Thailand | 1990 | Both sexes | 8,018,299.0 (8,003,328.1–8,029,778.0) | 7,458,609.3 (7,446,706.0–7,471,114.6) | 576,550.1 (572,454.8–579,424.9) | 28,102.6 (28,059.2–28,143.3) | 497,685.7 (331,359.1–721,705.8) | 840.8 (559.6–1,219.5) |
| 2013 | Both sexes | 6,730,494.8 (6,712,526.6–6,744,684.0) | 5,281,975.2 (5,265,395.9–5,298,618.9) | 340,135.8 (334,011.4–342,552.4) | 19,921.7 (19,872.6–19,964.4) | 352,441.2 (234,572.0–513,271.4) | 599.7 (399.1–870.8) | |
| Timor-Leste | 1990 | Both sexes | 170,781.8 (170,556.4–170,979.1) | 195,392.9 (195,169.4–195,649.3) | 22,658.1 (22,565.9–22,730.5) | 50,915.9 (50,866.5–50,965.3) | 13,765.6 (9,226.2–19,754.0) | 1,733.0 (1,168.1–2,475.7) |
| 2013 | Both sexes | 217,413.6 (217,154.3–217,588.9) | 234,105.8 (233,881.4–234,321.8) | 22,702.8 (22,615.9–22,767.6) | 39,923.8 (39,882.1–39,958.4) | 15,976.4 (10,666.4–23,055.5) | 1,208.2 (806.6–1,742.7) | |
| Vietnam | 1990 | Both sexes | 14,945,546.7 (14,925,923.6–14,977,731.9) | 16,959,274.5 (16,925,270.4–16,981,212.9) | 1,770,581.2 (1,765,646.7–1,776,719.0) | 48,626.2 (48,561.2–48,692.1) | 1,153,066.1 (776,726.8–1,655,719.7) | 1,578.6 (1,067.7–2,266.7) |
| 2013 | Both sexes | 13,528,685.3 (13,502,560.7–13,550,805.0) | 11,361,620.6 (11,339,379.2–11,384,058.6) | 832,335.4 (825,600.3–836,906.0) | 28,788.8 (28,740.1–28,833.3) | 748,044.6 (495,542.2–1,088,428.7) | 854.4 (567.3–1,240.8) | |
| Oceania | 1990 | Both sexes | 983,462.9 (981,819.4–984,995.4) | 1,168,658.8 (1,166,889.4–1,170,074.1) | 105,756.3 (105,470.4–106,035.5) | 32,241.0 (32,190.4–32,281.3) | 78,333.0 (52,212.2–113,119.0) | 1,044.7 (697.0–1,506.3) |
| 2013 | Both sexes | 1,331,621.3 (1,329,589.0–1,333,329.7) | 1,502,480.7 (1,500,562.7–1,504,109.4) | 122,104.0 (121,684.0–122,461.1) | 26,462.4 (26,424.1–26,494.6) | 99,439.9 (66,307.2–143,977.7) | 846.8 (564.0–1,224.8) | |
| Fiji | 1990 | Both sexes | 80,902.3 (80,675.1–81,064.1) | 92,492.1 (92,315.2–92,640.0) | 7,109.2 (7,066.1–7,144.1) | 22,472.1 (22,424.3–22,515.3) | 6,079.9 (4,047.5–8,820.3) | 713.8 (475.0–1,033.4) |
| 2013 | Both sexes | 86,409.7 (86,177.2–86,604.0) | 89,959.1 (89,644.6–90,191.6) | 6,410.2 (6,362.4–6,445.1) | 20,454.5 (20,396.9–20,501.5) | 5,914.4 (3,924.7–8,570.5) | 651.6 (432.5–943.3) | |
| Kiribati | 1990 | Both sexes | 8,675.9 (8,656.6–8,693.8) | 9,988.7 (9,970.2–10,003.6) | 785.0 (780.8–790.8) | 25,013.2 (24,962.8–25,058.2) | 653.7 (434.1–943.5) | 794.1 (527.6–1,144.3) |
| 2013 | Both sexes | 10,834.1 (10,803.0–10,858.0) | 11,745.9 (11,721.2–11,770.2) | 873.7 (870.5–876.8) | 22,175.3 (22,117.5–22,221.8) | 769.6 (513.9–1,116.1) | 705.7 (472.0–1,022.8) | |
| Marshall Islands | 1990 | Both sexes | 5,260.5 (5,249.2–5,269.7) | 6,031.0 (6,018.5–6,040.2) | 457.3 (454.1–459.5) | 22,173.3 (22,126.1–22,214.1) | 394.9 (262.9–573.8) | 704.8 (469.1–1,019.8) |
| 2013 | Both sexes | 7,299.2 (7,281.8–7,312.7) | 8,147.3 (8,133.5–8,160.8) | 610.3 (607.7–612.9) | 21,622.1 (21,574.5–21,662.6) | 534.6 (356.7–774.1) | 687.8 (459.4–994.5) | |
| Federated States of Micronesia | 1990 | Both sexes | 12,295.8 (12,269.7–12,321.0) | 14,794.9 (14,765.1–14,817.3) | 1,227.2 (1,219.2–1,237.4) | 26,367.2 (26,313.1–26,415.3) | 981.2 (654.4–1,419.3) | 842.9 (561.9–1,220.6) |
| 2013 | Both sexes | 11,394.3 (11,366.4–11,418.6) | 12,845.0 (12,820.3–12,869.1) | 995.0 (987.3–999.3) | 22,975.2 (22,922.9–23,020.2) | 848.1 (566.1–1,231.5) | 733.3 (489.1–1,063.0) | |
| Papua New Guinea | 1990 | Both sexes | 674,178.0 (672,989.0–675,367.7) | 813,596.2 (812,252.6–814,659.3) | 76,370.2 (76,117.7–76,600.4) | 35,852.4 (35,788.9–35,903.1) | 54,780.0 (36,543.1–79,023.8) | 1,167.0 (779.9–1,680.8) |
| 2013 | Both sexes | 969,186.2 (967,435.5–970,545.2) | 1,113,088.8 (1,111,548.0–1,114,336.2) | 92,455.0 (92,069.5–92,773.6) | 28,055.7 (28,008.8–28,094.0) | 73,768.2 (49,237.6–106,861.0) | 897.2 (598.1–1,297.6) | |
| Samoa | 1990 | Both sexes | 16,357.0 (16,273.0–16,407.1) | 18,728.7 (18,624.8–18,799.5) | 1,379.8 (1,366.2–1,390.8) | 19,236.9 (19,145.9–19,306.9) | 1,230.4 (814.3–1,788.9) | 614.3 (405.8–892.8) |
| 2013 | Both sexes | 17,782.1 (17,717.3–17,826.1) | 20,161.9 (20,041.4–20,242.1) | 1,471.6 (1,454.7–1,483.4) | 18,548.6 (18,469.5–18,610.0) | 1,327.2 (886.8–1,932.3) | 593.0 (396.9–862.7) | |
| Solomon Islands | 1990 | Both sexes | 43,317.0 (43,195.6–43,385.7) | 52,180.8 (52,096.3–52,241.6) | 4,407.4 (4,380.3–4,427.8) | 28,354.9 (28,299.8–28,394.3) | 3,461.7 (2,306.2–5,008.6) | 903.1 (601.5–1,305.2) |
| 2013 | Both sexes | 67,213.4 (67,093.0–67,302.1) | 77,745.4 (77,645.3–77,838.7) | 6,146.1 (6,119.4–6,166.6) | 24,354.1 (24,314.4–24,387.2) | 5,123.7 (3,418.4–7,419.1) | 774.1 (515.0–1,117.5) | |
| Tonga | 1990 | Both sexes | 11,053.4 (11,013.4–11,082.6) | 13,173.7 (13,123.9–13,207.2) | 1,057.4 (1,050.2–1,065.4) | 24,291.6 (24,212.6–24,347.3) | 872.5 (581.0–1,265.9) | 799.6 (533.6–1,159.2) |
| 2013 | Both sexes | 11,567.6 (11,535.5–11,592.4) | 13,666.8 (13,614.1–13,701.2) | 1,078.6 (1,070.5–1,085.1) | 23,264.3 (23,195.4–23,321.5) | 905.3 (605.0–1,310.7) | 765.0 (511.3–1,108.8) | |
| Vanuatu | 1990 | Both sexes | 18,815.4 (18,779.9–18,844.8) | 22,377.7 (22,341.9–22,413.1) | 1,836.8 (1,819.0–1,845.5) | 25,991.1 (25,945.3–26,032.1) | 1,483.3 (988.0–2,146.7) | 827.1 (549.4–1,196.8) |
| 2013 | Both sexes | 28,793.4 (28,739.7–28,828.8) | 32,534.6 (32,479.8–32,582.2) | 2,536.6 (2,506.9–2,548.2) | 23,705.0 (23,664.9–23,738.0) | 2,144.2 (1,428.4–3,106.5) | 753.3 (501.4–1,091.3) | |
| Central Europe, Eastern Europe, and Central Asia | 1990 | Both sexes | 41,741,255.5 (41,611,512.1–41,844,040.4) | 38,532,521.1 (38,329,850.2–38,714,797.3) | 2,697,951.8 (2,684,969.1–2,708,351.9) | 20,360.2 (20,285.1–20,425.2) | 2,694,007.0 (1,800,541.5–3,887,837.8) | 662.9 (443.1–956.9) |
| 2013 | Both sexes | 40,421,690.1 (40,319,418.7–40,503,455.0) | 32,955,222.6 (32,822,062.4–33,085,403.9) | 2,095,222.3 (2,085,642.5–2,102,686.1) | 19,822.1 (19,770.6–19,866.1) | 2,319,146.1 (1,549,886.5–3,353,069.3) | 640.2 (426.7–927.3) | |
| Central Asia | 1990 | Both sexes | 7,474,993.9 (7,453,138.1–7,493,734.1) | 8,268,778.3 (8,188,616.2–8,295,200.1) | 627,090.4 (623,667.8–629,367.3) | 22,248.1 (22,150.3–22,318.1) | 562,890.0 (377,222.3–810,728.5) | 745.7 (501.2–1,071.7) |
| 2013 | Both sexes | 8,325,012.9 (8,301,378.1–8,346,296.6) | 8,431,508.5 (8,397,190.7–8,457,310.9) | 595,608.5 (591,415.6–598,045.6) | 20,525.7 (20,462.2–20,582.2) | 579,072.9 (386,645.7–840,116.0) | 689.1 (461.3–998.1) | |
| Armenia | 1990 | Both sexes | 347,426.9 (345,392.2–349,094.7) | 369,277.9 (365,387.9–371,979.9) | 26,320.5 (25,903.4–26,637.3) | 20,549.6 (20,371.6–20,677.6) | 25,408.3 (16,944.3–36,872.8) | 694.5 (463.7–1,006.2) |
| 2013 | Both sexes | 270,998.2 (268,943.5–272,849.1) | 256,589.5 (253,629.3–258,847.2) | 17,176.7 (16,860.0–17,361.0) | 19,424.5 (19,255.8–19,556.8) | 18,095.7 (12,046.3–26,294.3) | 658.7 (437.6–958.1) | |
| Azerbaijan | 1990 | Both sexes | 861,947.0 (858,410.0–865,387.0) | 1,013,535.8 (1,009,119.4–1,017,221.2) | 84,578.0 (84,084.1–85,042.0) | 26,971.5 (26,849.5–27,076.1) | 69,131.5 (46,398.5–99,779.3) | 935.5 (630.3–1,344.7) |
| 2013 | Both sexes | 1,050,215.2 (1,044,892.3–1,054,112.5) | 1,105,202.7 (1,098,894.1–1,109,941.1) | 84,081.2 (83,495.2–84,517.7) | 24,524.8 (24,400.1–24,619.2) | 75,848.9 (51,042.8–109,482.3) | 847.1 (569.5–1,220.7) | |
| Georgia | 1990 | Both sexes | 496,629.7 (494,475.5–498,474.1) | 483,101.0 (475,908.5–486,610.6) | 32,350.7 (31,904.8–32,628.9) | 18,936.7 (18,793.8–19,029.7) | 33,211.5 (22,078.7–47,876.4) | 624.8 (415.5–901.2) |
| 2013 | Both sexes | 386,390.5 (384,523.8–388,028.0) | 336,401.7 (333,848.8–339,134.3) | 20,943.1 (20,727.7–21,137.7) | 18,541.1 (18,456.7–18,622.7) | 23,730.3 (15,948.7–34,025.9) | 615.5 (410.8–883.5) | |
| Kazakhstan | 1990 | Both sexes | 1,605,736.2 (1,592,634.9–1,617,342.7) | 1,685,036.4 (1,602,849.1–1,703,435.3) | 119,920.3 (117,202.9–121,577.2) | 20,214.8 (19,774.9–20,410.6) | 115,781.6 (77,652.3–166,431.7) | 677.8 (454.7–972.7) |
| 2013 | Both sexes | 1,534,185.4 (1,522,933.0–1,542,553.0) | 1,498,369.7 (1,483,449.6–1,510,421.7) | 100,297.0 (98,161.5–101,495.0) | 19,222.8 (19,080.5–19,344.2) | 103,893.3 (69,469.9–150,805.1) | 645.3 (431.6–935.7) | |
| Kyrgyzstan | 1990 | Both sexes | 478,206.3 (476,380.5–479,898.9) | 528,735.0 (526,246.2–530,799.4) | 39,558.0 (39,273.6–39,719.8) | 21,867.3 (21,751.8–21,967.9) | 35,817.2 (23,894.2–51,647.3) | 725.3 (484.9–1,044.0) |
| 2013 | Both sexes | 543,258.0 (540,356.0–545,505.8) | 554,612.1 (549,955.5–557,640.6) | 38,401.9 (37,925.3–38,724.3) | 19,740.9 (19,605.7–19,856.0) | 37,854.4 (25,251.2–54,794.8) | 660.9 (443.8–954.0) | |
| Mongolia | 1990 | Both sexes | 213,551.9 (211,561.6–214,393.4) | 230,587.0 (228,689.7–231,757.6) | 16,772.2 (16,574.4–16,897.1) | 17,835.7 (17,687.4–17,937.9) | 15,763.0 (10,489.2–22,707.2) | 587.2 (391.0–844.0) |
| 2013 | Both sexes | 221,005.0 (219,560.9–222,024.8) | 206,809.7 (204,524.9–208,723.5) | 13,560.4 (13,368.8–13,694.9) | 15,349.8 (15,218.3–15,454.2) | 14,535.3 (9,769.2–21,091.1) | 516.5 (347.3–747.5) | |
| Tajikistan | 1990 | Both sexes | 653,565.2 (651,567.5–655,323.2) | 750,331.9 (747,960.9–752,340.1) | 59,094.6 (58,682.4–59,328.3) | 24,577.6 (24,477.2–24,672.6) | 50,725.9 (33,738.2–73,397.6) | 813.9 (544.5–1,177.5) |
| 2013 | Both sexes | 986,362.5 (983,465.2–988,712.3) | 1,062,704.6 (1,059,708.3–1,065,541.2) | 80,744.2 (80,205.8–81,046.4) | 24,097.1 (24,013.0–24,174.2) | 71,682.8 (47,928.8–103,813.9) | 792.4 (530.2–1,143.4) | |
| Turkmenistan | 1990 | Both sexes | 407,908.2 (406,148.6–409,345.6) | 461,590.5 (459,560.8–463,290.4) | 35,184.5 (35,020.1–35,299.3) | 22,251.7 (22,120.1–22,343.6) | 31,246.0 (20,856.1–45,461.4) | 740.3 (497.2–1,072.3) |
| 2013 | Both sexes | 519,986.6 (517,192.9–522,094.4) | 534,401.8 (531,148.7–537,308.5) | 38,002.9 (37,756.6–38,192.5) | 20,465.0 (20,323.3–20,582.5) | 36,646.8 (24,381.6–53,134.3) | 687.0 (457.0–990.8) | |
| Uzbekistan | 1990 | Both sexes | 2,410,022.5 (2,402,124.9–2,416,020.3) | 2,746,582.8 (2,737,475.1–2,753,732.2) | 213,311.5 (212,315.0–214,083.6) | 23,592.3 (23,493.4–23,674.2) | 185,805.0 (124,188.0–267,591.3) | 782.2 (524.9–1,124.4) |
| 2013 | Both sexes | 2,812,611.5 (2,801,377.2–2,821,942.6) | 2,876,416.8 (2,864,343.4–2,888,427.2) | 202,401.0 (200,837.9–203,661.8) | 20,004.7 (19,920.5–20,078.0) | 196,785.6 (131,780.4–285,419.7) | 667.0 (447.5–965.0) | |
| Central Europe | 1990 | Both sexes | 15,529,394.0 (15,504,389.4–15,553,786.5) | 12,627,915.7 (12,587,852.4–12,660,594.4) | 912,996.1 (911,602.2–914,364.2) | 23,939.0 (23,888.9–23,983.3) | 876,516.1 (587,478.2–1,267,822.4) | 728.7 (488.3–1,054.3) |
| 2013 | Both sexes | 14,886,038.5 (14,857,649.9–14,913,721.1) | 10,284,649.6 (10,241,897.1–10,324,824.9) | 659,383.4 (657,709.2–660,960.0) | 23,191.9 (23,143.9–23,238.1) | 725,712.0 (483,875.9–1,053,241.2) | 706.2 (471.0–1,022.8) | |
| Albania | 1990 | Both sexes | 588,393.5 (587,209.7–589,472.3) | 529,186.0 (527,832.7–530,270.9) | 44,774.7 (44,600.4–44,883.3) | 33,553.7 (33,470.8–33,630.3) | 36,397.6 (24,312.1–52,740.9) | 1,007.9 (674.8–1,455.8) |
| 2013 | Both sexes | 509,559.4 (508,526.4–510,540.1) | 382,934.7 (381,313.4–384,405.8) | 28,853.8 (28,757.8–28,915.3) | 29,476.7 (29,401.6–29,549.1) | 26,633.7 (17,692.8–38,590.1) | 879.8 (583.8–1,275.2) | |
| Bosnia and Herzegovina | 1990 | Both sexes | 638,341.8 (636,175.8–640,153.9) | 523,389.3 (520,728.4–525,713.8) | 38,767.0 (38,680.9–38,852.8) | 27,209.8 (27,098.4–27,302.0) | 36,099.6 (24,081.6–52,151.9) | 829.0 (553.9–1,196.2) |
| 2013 | Both sexes | 474,059.5 (472,457.1–475,548.1) | 339,490.6 (336,486.9–342,185.0) | 22,492.8 (22,343.8–22,605.0) | 23,192.1 (23,103.5–23,274.7) | 23,991.3 (15,924.4–34,681.7) | 707.8 (470.3–1,022.1) | |
| Bulgaria | 1990 | Both sexes | 1,083,260.7 (1,078,976.5–1,088,172.8) | 827,841.6 (821,670.6–834,079.4) | 57,552.1 (57,368.6–57,738.4) | 23,122.0 (23,029.2–23,227.1) | 58,294.0 (38,791.7–83,687.1) | 706.8 (470.1–1,017.1) |
| 2013 | Both sexes | 900,780.6 (896,406.9–904,038.0) | 601,845.6 (596,650.5–607,181.5) | 37,528.6 (37,314.1–37,682.9) | 22,840.3 (22,758.9–22,922.4) | 42,762.4 (28,307.6–61,672.6) | 696.0 (462.4–1,007.5) | |
| Croatia | 1990 | Both sexes | 565,490.1 (563,623.4–567,058.0) | 433,893.1 (430,985.8–436,383.4) | 29,710.2 (29,585.3–29,803.3) | 22,326.5 (22,238.9–22,397.0) | 30,401.9 (20,371.6–44,044.5) | 682.4 (457.2–989.2) |
| 2013 | Both sexes | 513,610.1 (511,985.1–514,948.2) | 354,150.3 (350,814.0–357,165.7) | 22,550.1 (22,380.9–22,692.4) | 22,126.4 (22,039.3–22,200.2) | 25,340.2 (16,893.5–36,459.0) | 677.5 (450.2–979.0) | |
| Czech Republic | 1990 | Both sexes | 1,228,016.6 (1,222,267.5–1,233,375.3) | 969,015.1 (961,633.5–976,747.6) | 68,305.3 (67,990.1–68,550.8) | 22,557.9 (22,453.1–22,672.0) | 67,765.2 (45,318.6–97,664.1) | 688.9 (460.7–992.3) |
| 2013 | Both sexes | 1,312,551.4 (1,308,608.5–1,315,549.0) | 894,225.7 (887,461.5–900,439.0) | 56,458.3 (56,187.6–56,660.5) | 22,925.3 (22,850.9–22,989.2) | 62,988.3 (42,045.6–90,695.4) | 695.7 (463.5–1,004.6) | |
| Hungary | 1990 | Both sexes | 1,283,935.4 (1,278,769.1–1,288,631.7) | 995,587.3 (989,122.2–1,001,759.0) | 69,199.3 (68,928.1–69,438.9) | 23,337.2 (23,247.5–23,422.9) | 69,682.9 (46,979.6–100,440.3) | 712.6 (479.9–1,028.9) |
| 2013 | Both sexes | 1,235,360.2 (1,229,934.0–1,240,367.6) | 851,121.6 (844,033.9–858,737.6) | 54,047.4 (53,743.5–54,270.6) | 22,904.3 (22,815.8–22,994.0) | 60,478.9 (40,694.1–87,136.6) | 701.1 (469.5–1,011.9) | |
| Macedonia | 1990 | Both sexes | 248,314.7 (247,477.3–249,191.2) | 207,893.0 (206,859.4–208,819.4) | 15,212.3 (15,164.7–15,248.7) | 23,541.4 (23,450.0–23,632.8) | 14,396.6 (9,549.5–20,839.4) | 717.2 (476.0–1,036.6) |
| 2013 | Both sexes | 256,280.4 (255,367.8–257,206.9) | 182,815.3 (181,211.0–184,268.7) | 12,120.6 (12,065.9–12,172.1) | 22,846.4 (22,745.4–22,943.2) | 12,905.2 (8,617.2–18,647.6) | 696.7 (466.0–1,006.1) | |
| Montenegro | 1990 | Both sexes | 73,489.7 (73,263.7–73,677.1) | 61,478.6 (61,168.4–61,793.7) | 4,490.8 (4,475.4–4,504.2) | 23,155.1 (23,063.9–23,236.5) | 4,246.9 (2,847.2–6,159.5) | 702.9 (471.2–1,019.3) |
| 2013 | Both sexes | 76,818.1 (76,546.8–77,047.2) | 57,035.4 (56,625.0–57,409.9) | 3,874.2 (3,857.4–3,886.8) | 23,198.8 (23,106.3–23,278.7) | 3,997.7 (2,688.6–5,807.9) | 706.1 (474.8–1,024.9) | |
| Poland | 1990 | Both sexes | 4,645,104.9 (4,628,971.3–4,657,870.4) | 3,893,375.7 (3,865,254.6–3,916,318.0) | 282,889.8 (282,147.3–283,668.1) | 23,245.5 (23,147.7–23,327.7) | 268,899.1 (180,231.0–388,588.6) | 706.5 (473.4–1,021.2) |
| 2013 | Both sexes | 4,733,795.6 (4,710,409.9–4,750,267.9) | 3,212,294.3 (3,177,640.1–3,242,682.4) | 200,791.5 (199,624.8–201,918.3) | 22,813.1 (22,709.3–22,899.7) | 225,925.6 (150,273.9–327,505.2) | 693.5 (462.6–1,003.7) | |
| Romania | 1990 | Both sexes | 3,105,162.1 (3,098,138.8–3,112,503.4) | 2,491,303.2 (2,480,029.2–2,504,234.6) | 180,229.9 (179,689.1–180,612.7) | 25,263.3 (25,188.0–25,346.8) | 172,406.7 (114,739.6–249,174.7) | 765.5 (509.6–1,107.3) |
| 2013 | Both sexes | 2,778,670.8 (2,769,687.2–2,784,797.3) | 1,940,869.6 (1,920,737.0–1,954,330.8) | 125,830.8 (125,130.0–126,388.6) | 23,747.9 (23,645.5–23,819.6) | 136,783.3 (91,283.2–198,752.0) | 722.6 (482.0–1,051.5) | |
| Serbia | 1990 | Both sexes | 1,177,208.7 (1,172,903.3–1,180,170.8) | 959,484.4 (954,097.4–964,501.2) | 68,909.2 (68,611.1–69,150.5) | 22,987.6 (22,891.2–23,063.1) | 67,058.3 (44,938.8–97,318.5) | 703.5 (471.0–1,021.2) |
| 2013 | Both sexes | 1,168,068.0 (1,162,690.3–1,172,494.2) | 834,179.2 (825,854.0–841,217.4) | 55,150.2 (54,849.0–55,441.3) | 22,930.4 (22,812.5–23,023.2) | 59,229.3 (39,674.9–85,083.6) | 701.4 (467.2–1,010.2) | |
| Slovakia | 1990 | Both sexes | 646,964.9 (645,104.8–648,691.6) | 542,436.1 (539,619.6–545,162.4) | 39,431.5 (39,247.7–39,581.0) | 23,428.5 (23,339.6–23,508.3) | 37,468.8 (25,072.9–54,282.8) | 712.3 (476.7–1,032.1) |
| 2013 | Both sexes | 671,627.7 (669,505.0–673,432.4) | 461,391.0 (458,564.5–464,277.5) | 28,760.8 (28,625.6–28,867.5) | 22,973.9 (22,902.7–23,040.3) | 32,355.3 (21,563.0–46,866.5) | 700.1 (466.5–1,014.3) | |
| Slovenia | 1990 | Both sexes | 245,711.0 (244,905.0–246,362.8) | 193,032.1 (191,692.9–194,345.6) | 13,524.0 (13,463.6–13,563.2) | 23,410.7 (23,312.1–23,500.1) | 13,398.6 (8,998.8–19,287.1) | 711.7 (477.3–1,025.5) |
| 2013 | Both sexes | 254,856.9 (253,615.8–256,053.4) | 172,296.4 (170,527.5–174,019.5) | 10,924.2 (10,835.0–10,981.5) | 22,659.1 (22,558.4–22,750.9) | 12,320.7 (8,230.7–17,855.2) | 691.7 (464.2–1,002.7) | |
| Eastern Europe | 1990 | Both sexes | 18,736,867.6 (18,630,095.4–18,817,836.3) | 17,635,827.1 (17,466,193.2–17,790,198.3) | 1,157,865.3 (1,146,129.2–1,167,171.1) | 17,702.0 (17,595.0–17,800.0) | 1,254,600.9 (839,601.8–1,809,219.1) | 597.1 (399.5–861.1) |
| 2013 | Both sexes | 17,210,638.7 (17,143,872.1–17,264,952.3) | 14,239,064.5 (14,137,994.3–14,335,558.6) | 840,230.3 (833,256.0–846,102.2) | 17,428.0 (17,359.1–17,484.5) | 1,014,361.2 (677,963.4–1,468,178.0) | 578.1 (384.2–839.9) | |
| Belarus | 1990 | Both sexes | 883,188.3 (877,403.7–888,805.7) | 839,260.0 (828,777.3–847,655.4) | 55,347.8 (54,276.4–56,046.3) | 18,167.3 (18,006.6–18,295.2) | 58,658.6 (39,365.9–84,715.1) | 604.9 (405.5–873.2) |
| 2013 | Both sexes | 800,675.3 (796,218.7–804,332.7) | 664,977.9 (657,414.9–672,078.2) | 39,030.0 (38,490.3–39,421.0) | 17,862.4 (17,740.9–17,958.1) | 47,064.4 (31,353.4–67,966.2) | 591.0 (393.2–857.5) | |
| Estonia | 1990 | Both sexes | 138,838.7 (137,996.1–139,641.2) | 130,566.3 (129,182.9–131,787.5) | 8,560.2 (8,429.3–8,645.5) | 18,523.6 (18,389.9–18,647.1) | 9,134.5 (6,131.7–13,156.9) | 616.7 (413.2–890.0) |
| 2013 | Both sexes | 114,411.8 (113,581.3–115,068.9) | 96,415.9 (94,931.0–97,771.9) | 5,856.8 (5,784.1–5,906.3) | 17,900.9 (17,772.3–18,010.6) | 6,875.8 (4,586.6–9,828.4) | 593.2 (394.6–853.5) | |
| Latvia | 1990 | Both sexes | 230,809.3 (229,499.1–232,138.2) | 213,622.2 (211,819.9–215,290.3) | 13,620.3 (13,428.2–13,756.5) | 18,212.7 (18,117.9–18,308.3) | 14,995.5 (9,991.8–21,585.3) | 608.3 (405.2–876.9) |
| 2013 | Both sexes | 172,789.8 (171,574.2–173,879.1) | 144,694.7 (143,093.4–146,171.7) | 8,524.9 (8,417.4–8,611.1) | 17,966.7 (17,858.0–18,054.0) | 10,334.5 (6,965.5–14,843.1) | 597.2 (399.9–864.3) | |
| Lithuania | 1990 | Both sexes | 319,333.5 (316,996.1–321,258.3) | 299,776.2 (296,976.6–302,703.1) | 19,724.0 (19,452.9–19,932.7) | 18,047.1 (17,923.1–18,168.5) | 21,039.4 (14,046.9–30,341.4) | 602.1 (402.6–869.6) |
| 2013 | Both sexes | 250,454.6 (249,116.5–251,651.7) | 208,771.2 (206,057.1–211,048.5) | 12,368.7 (12,204.7–12,485.8) | 17,829.6 (17,722.4–17,924.2) | 14,894.4 (10,076.1–21,469.1) | 592.5 (396.9–854.8) | |
| Moldova | 1990 | Both sexes | 443,851.9 (441,490.2–445,937.4) | 474,533.1 (471,884.2–476,709.3) | 34,244.0 (33,837.4–34,528.1) | 21,698.0 (21,588.6–21,795.2) | 32,147.1 (21,522.2–46,577.6) | 728.2 (488.1–1,054.8) |
| 2013 | Both sexes | 353,830.6 (352,155.6–355,400.0) | 335,457.6 (333,703.3–337,031.6) | 22,516.7 (22,331.3–22,656.3) | 21,970.2 (21,883.0–22,052.2) | 22,727.0 (15,176.1–32,872.9) | 733.0 (488.6–1,059.4) | |
| Russia | 1990 | Both sexes | 13,049,161.2 (12,956,927.2–13,118,580.5) | 12,419,744.6 (12,270,317.2–12,544,911.3) | 821,870.8 (811,901.3–829,524.4) | 18,532.1 (18,393.8–18,651.7) | 884,463.0 (593,506.1–1,280,192.6) | 628.5 (420.9–909.0) |
| 2013 | Both sexes | 12,375,903.9 (12,311,962.9–12,424,639.6) | 10,417,162.2 (10,310,244.7–10,514,772.1) | 622,150.9 (615,370.9–627,850.9) | 18,154.1 (18,068.8–18,231.0) | 738,888.8 (495,032.0–1,072,774.1) | 602.8 (401.8–878.0) | |
| Ukraine | 1990 | Both sexes | 3,671,684.5 (3,639,293.2–3,693,070.2) | 3,258,324.6 (3,202,532.5–3,302,497.0) | 204,498.3 (199,068.3–207,967.9) | 14,878.9 (14,699.9–15,004.2) | 234,162.8 (156,789.3–336,699.6) | 494.7 (330.8–712.5) |
| 2013 | Both sexes | 3,142,572.8 (3,122,475.3–3,160,930.5) | 2,371,585.2 (2,335,775.5–2,407,391.8) | 129,782.3 (127,348.3–131,317.1) | 14,681.5 (14,539.0–14,772.1) | 173,576.4 (116,390.9–249,749.6) | 483.4 (324.7–700.0) | |
| High-income | 1990 | Both sexes | 91,083,813.6 (90,934,394.6–91,220,399.2) | 71,010,515.5 (70,802,445.3–71,188,011.9) | 4,779,754.2 (4,764,654.3–4,792,742.3) | 19,455.7 (19,420.7–19,485.4) | 4,750,004.7 (3,158,561.6–6,903,728.9) | 577.2 (383.6–837.5) |
| 2013 | Both sexes | 106,261,799.2 (106,115,450.4–106,405,045.0) | 76,176,751.0 (75,923,182.7–76,373,988.3) | 4,877,227.5 (4,861,252.6–4,891,994.6) | 18,928.0 (18,895.1–18,954.3) | 5,138,029.7 (3,424,410.0–7,449,343.7) | 560.3 (372.4–813.5) | |
| High-income Asia Pacific | 1990 | Both sexes | 21,842,239.3 (21,810,745.1–21,875,604.9) | 18,315,673.7 (18,284,192.5–18,339,200.6) | 1,291,750.7 (1,287,209.1–1,296,859.2) | 25,637.2 (25,603.5–25,667.9) | 1,210,186.9 (801,663.6–1,761,995.2) | 773.7 (512.3–1,123.8) |
| 2013 | Both sexes | 23,505,546.2 (23,468,556.2–23,544,072.2) | 17,270,792.0 (17,240,503.0–17,296,910.4) | 1,109,057.1 (1,105,955.6–1,111,934.8) | 24,798.8 (24,768.5–24,826.0) | 1,132,997.1 (752,872.2–1,660,163.9) | 744.2 (494.1–1,085.3) | |
| Brunei | 1990 | Both sexes | 32,427.8 (32,349.7–32,500.3) | 31,239.6 (31,174.2–31,296.6) | 2,322.5 (2,311.9–2,331.5) | 23,859.9 (23,806.4–23,901.8) | 2,065.4 (1,367.3–3,009.6) | 704.8 (467.4–1,026.9) |
| 2013 | Both sexes | 50,486.6 (50,374.0–50,584.3) | 44,108.9 (44,026.3–44,186.4) | 3,160.4 (3,148.4–3,174.5) | 23,867.1 (23,824.1–23,906.7) | 2,921.3 (1,934.9–4,261.1) | 708.3 (469.9–1,032.0) | |
| Japan | 1990 | Both sexes | 15,304,862.2 (15,276,324.3–15,336,802.4) | 12,525,738.3 (12,496,325.8–12,547,346.8) | 855,481.0 (851,116.9–859,315.9) | 24,653.1 (24,606.3–24,693.7) | 826,793.1 (548,013.1–1,205,088.7) | 746.4 (494.4–1,085.1) |
| 2013 | Both sexes | 16,200,919.3 (16,163,135.7–16,236,192.1) | 11,904,218.9 (11,877,595.7–11,927,601.1) | 753,867.5 (751,312.1–756,264.3) | 24,114.6 (24,070.4–24,152.3) | 780,477.6 (518,821.9–1,142,286.1) | 728.7 (483.5–1,063.7) | |
| South Korea | 1990 | Both sexes | 6,141,168.2 (6,130,792.0–6,152,572.4) | 5,453,549.0 (5,442,215.7–5,461,755.5) | 412,330.1 (410,599.3–414,693.9) | 28,408.5 (28,365.3–28,449.3) | 361,117.0 (238,899.2–524,647.4) | 846.8 (561.1–1,228.9) |
| 2013 | Both sexes | 6,771,595.1 (6,760,228.3–6,783,253.3) | 4,956,905.4 (4,945,833.4–4,967,774.3) | 328,096.6 (326,392.4–329,476.0) | 26,438.4 (26,399.2–26,476.4) | 325,517.8 (216,182.4–477,185.2) | 782.8 (521.2–1,139.3) | |
| Singapore | 1990 | Both sexes | 363,781.1 (362,879.4–364,543.2) | 305,146.7 (304,417.9–305,767.5) | 21,617.1 (21,497.0–21,689.7) | 26,061.9 (26,004.8–26,109.6) | 20,211.4 (13,385.1–29,554.8) | 777.7 (516.5–1,132.5) |
| 2013 | Both sexes | 482,545.2 (481,588.0–483,226.8) | 365,558.8 (364,832.3–366,131.6) | 23,932.5 (23,836.3–23,993.6) | 24,186.0 (24,138.5–24,218.1) | 24,080.3 (15,948.2–35,302.7) | 720.4 (478.9–1,049.9) | |
| Australasia | 1990 | Both sexes | 2,041,156.3 (2,032,590.0–2,047,135.1) | 1,619,514.3 (1,611,464.4–1,626,396.2) | 110,824.2 (110,080.8–111,416.1) | 19,018.6 (18,947.3–19,081.0) | 108,353.0 (72,006.0–156,822.3) | 562.4 (374.0–814.8) |
| 2013 | Both sexes | 2,832,044.5 (2,818,340.1–2,842,268.7) | 2,067,253.7 (2,049,505.9–2,079,664.8) | 133,335.1 (132,333.7–134,143.2) | 18,791.6 (18,689.1–18,862.3) | 139,093.9 (93,186.7–201,867.4) | 555.7 (372.0–806.5) | |
| Australia | 1990 | Both sexes | 1,709,728.7 (1,701,081.9–1,715,183.8) | 1,361,353.2 (1,353,902.1–1,367,307.7) | 93,269.2 (92,605.1–93,827.9) | 19,132.9 (19,049.9–19,196.0) | 91,068.5 (60,531.5–132,169.8) | 567.0 (377.1–822.0) |
| 2013 | Both sexes | 2,390,187.1 (2,376,327.3–2,400,388.1) | 1,749,618.9 (1,731,914.3–1,761,874.7) | 112,916.2 (111,912.1–113,670.2) | 18,897.1 (18,778.0–18,982.8) | 117,663.2 (78,979.7–170,545.0) | 559.9 (374.7–811.4) | |
| New Zealand | 1990 | Both sexes | 331,427.6 (328,418.9–332,927.4) | 258,161.0 (254,807.0–259,888.1) | 17,555.0 (17,248.5–17,760.7) | 18,436.1 (18,227.3–18,529.6) | 17,284.5 (11,555.4–25,144.5) | 539.2 (360.8–785.5) |
| 2013 | Both sexes | 441,857.3 (437,875.2–444,005.8) | 317,634.8 (314,348.9–320,256.8) | 20,418.9 (20,124.6–20,654.5) | 18,229.2 (18,011.6–18,332.8) | 21,430.7 (14,307.8–31,139.8) | 533.6 (355.3–777.1) | |
| Western Europe | 1990 | Both sexes | 38,670,348.8 (38,534,656.8–38,765,224.8) | 28,256,886.0 (28,077,514.5–28,403,568.4) | 1,838,611.6 (1,828,621.2–1,846,945.3) | 19,230.4 (19,156.3–19,288.7) | 1,899,009.9 (1,263,821.3–2,753,933.5) | 564.6 (375.7–819.3) |
| 2013 | Both sexes | 43,617,259.7 (43,488,872.7–43,709,623.2) | 29,626,464.5 (29,411,043.1–29,781,578.9) | 1,854,599.7 (1,843,600.1–1,865,783.6) | 18,986.0 (18,914.1–19,036.4) | 2,009,946.2 (1,339,892.1–2,910,261.9) | 556.9 (370.0–808.2) | |
| Andorra | 1990 | Both sexes | 5,007.7 (4,974.1–5,036.0) | 3,651.8 (3,590.7–3,691.4) | 237.4 (232.3–240.9) | 19,027.0 (18,804.5–19,159.3) | 247.7 (164.5–360.7) | 562.0 (373.0–817.2) |
| 2013 | Both sexes | 8,068.3 (8,014.8–8,113.3) | 5,495.6 (5,406.8–5,565.3) | 342.8 (335.1–350.1) | 18,962.5 (18,751.6–19,095.3) | 374.2 (249.2–542.5) | 558.1 (372.2–811.9) | |
| Austria | 1990 | Both sexes | 775,909.0 (770,767.5–780,345.8) | 559,568.3 (540,695.3–567,031.8) | 35,917.7 (35,138.9–36,379.3) | 19,199.4 (18,830.0–19,351.4) | 37,903.5 (25,470.5–54,760.7) | 566.9 (378.0–824.9) |
| 2013 | Both sexes | 873,442.4 (868,018.2–878,070.6) | 578,469.7 (565,045.8–586,512.3) | 35,049.5 (34,264.3–36,198.7) | 19,100.0 (18,848.1–19,228.1) | 39,985.7 (26,376.3–57,759.6) | 566.1 (374.3–824.0) | |
| Belgium | 1990 | Both sexes | 1,008,873.6 (1,003,857.9–1,012,883.8) | 733,041.1 (723,752.4–739,868.9) | 47,448.2 (46,906.6–48,002.6) | 19,251.7 (19,136.3–19,329.7) | 49,612.5 (33,129.3–71,782.5) | 568.5 (378.7–821.6) |
| 2013 | Both sexes | 1,145,620.0 (1,137,735.4–1,151,454.6) | 787,691.3 (775,478.5–799,297.4) | 49,669.5 (48,941.2–50,501.6) | 19,098.9 (18,942.6–19,197.5) | 53,979.2 (36,260.9–77,831.5) | 563.7 (377.4–817.5) | |
| Cyprus | 1990 | Both sexes | 68,928.4 (68,703.2–69,131.1) | 58,164.4 (57,927.6–58,433.2) | 4,101.6 (4,054.5–4,129.4) | 19,603.4 (19,541.8–19,666.0) | 3,898.5 (2,592.3–5,653.0) | 581.3 (386.6–843.1) |
| 2013 | Both sexes | 88,346.6 (88,007.6–88,737.3) | 62,004.1 (61,584.1–62,475.2) | 3,924.9 (3,880.9–3,947.9) | 19,339.7 (19,277.8–19,417.2) | 4,210.3 (2,800.3–6,124.8) | 575.6 (384.9–833.9) | |
| Denmark | 1990 | Both sexes | 521,946.5 (518,967.3–524,425.8) | 368,826.8 (363,100.3–372,639.3) | 23,169.1 (22,777.5–23,499.5) | 19,147.1 (18,967.5–19,272.5) | 25,018.5 (16,666.7–36,204.9) | 564.6 (376.7–818.6) |
| 2013 | Both sexes | 573,906.0 (569,461.6–577,530.5) | 401,396.0 (392,597.2–408,377.0) | 25,659.8 (25,007.7–26,320.4) | 19,027.7 (18,800.1–19,183.5) | 27,405.9 (18,277.5–39,863.6) | 559.6 (372.8–816.4) | |
| Finland | 1990 | Both sexes | 422,768.0 (420,392.3–424,337.1) | 309,724.6 (307,556.8–311,939.3) | 20,515.9 (20,312.3–20,609.9) | 16,356.8 (16,280.2–16,412.6) | 21,197.4 (14,075.3–30,674.7) | 485.1 (322.2–702.0) |
| 2013 | Both sexes | 469,420.7 (466,754.5–471,752.2) | 308,719.6 (305,627.7–311,903.0) | 19,244.3 (19,021.5–19,414.0) | 16,245.6 (16,176.6–16,310.1) | 21,917.9 (14,628.9–31,293.3) | 485.9 (323.9–701.4) | |
| France | 1990 | Both sexes | 5,446,713.0 (5,420,328.6–5,469,123.3) | 4,038,903.6 (4,006,476.4–4,068,177.7) | 268,622.4 (264,940.8–271,053.6) | 18,116.6 (18,034.3–18,194.3) | 275,595.2 (183,749.7–400,622.0) | 535.2 (356.7–777.3) |
| 2013 | Both sexes | 6,149,028.9 (6,115,641.8–6,187,176.3) | 4,334,285.0 (4,296,791.4–4,374,897.8) | 282,671.5 (279,239.2–285,404.0) | 17,846.1 (17,779.0–17,912.2) | 300,653.8 (200,463.4–434,059.7) | 528.7 (351.7–767.0) | |
| Germany | 1990 | Both sexes | 8,190,915.9 (8,105,535.0–8,237,747.9) | 5,718,198.5 (5,563,671.9–5,817,113.4) | 355,307.0 (349,187.6–360,101.5) | 19,633.3 (19,360.2–19,793.2) | 384,267.5 (257,242.6–552,774.5) | 576.7 (384.2–835.5) |
| 2013 | Both sexes | 8,609,962.4 (8,535,625.3–8,652,725.9) | 5,548,520.2 (5,360,259.7–5,661,568.1) | 332,077.8 (325,858.2–339,194.8) | 19,345.2 (19,053.5–19,505.2) | 377,943.8 (253,049.3–547,207.1) | 568.0 (379.2–827.4) | |
| Greece | 1990 | Both sexes | 1,085,146.0 (1,080,732.6–1,089,069.8) | 815,480.8 (810,578.9–820,037.6) | 55,724.1 (55,106.5–56,089.7) | 20,274.9 (20,199.7–20,335.8) | 55,258.8 (36,845.9–80,619.7) | 598.2 (399.0–870.7) |
| 2013 | Both sexes | 1,178,249.9 (1,172,549.9–1,183,669.7) | 784,347.1 (776,486.2–792,957.2) | 49,196.5 (48,561.0–49,685.3) | 19,602.1 (19,529.0–19,678.7) | 54,047.2 (36,108.3–78,183.6) | 580.0 (386.3–843.7) | |
| Iceland | 1990 | Both sexes | 25,999.6 (25,805.2–26,118.3) | 21,317.7 (21,156.9–21,439.0) | 1,476.9 (1,456.9–1,493.7) | 19,325.0 (19,202.8–19,403.7) | 1,425.7 (949.4–2,071.6) | 568.0 (378.3–825.1) |
| 2013 | Both sexes | 32,452.6 (32,135.1–32,611.4) | 24,071.9 (23,774.4–24,294.1) | 1,584.7 (1,559.4–1,604.4) | 19,154.8 (18,950.6–19,256.7) | 1,622.9 (1,080.6–2,362.7) | 562.9 (374.4–820.7) | |
| Ireland | 1990 | Both sexes | 357,860.0 (354,680.8–359,847.3) | 308,757.0 (301,860.9–312,183.5) | 22,274.1 (22,015.5–22,479.7) | 19,264.0 (19,022.2–19,410.6) | 20,728.6 (13,807.9–29,940.6) | 567.0 (376.9–819.9) |
| 2013 | Both sexes | 464,892.7 (459,807.2–468,104.9) | 352,788.6 (344,709.0–359,080.5) | 23,469.8 (23,103.2–23,848.6) | 19,077.0 (18,800.5–19,253.3) | 23,862.8 (15,817.4–34,377.5) | 562.3 (373.4–812.2) | |
| Israel | 1990 | Both sexes | 460,982.9 (456,628.2–463,697.1) | 414,550.1 (408,284.2–418,179.6) | 30,200.8 (29,664.5–30,501.9) | 19,259.9 (19,066.9–19,397.6) | 27,897.2 (18,509.4–40,388.2) | 571.7 (379.5–827.6) |
| 2013 | Both sexes | 792,319.6 (785,565.3–796,196.6) | 667,230.0 (658,637.4–672,575.1) | 46,780.3 (46,126.2–47,272.6) | 19,159.7 (18,984.5–19,272.7) | 44,962.3 (29,942.8–65,326.3) | 567.5 (377.5–823.9) | |
| Italy | 1990 | Both sexes | 5,688,383.2 (5,667,986.7–5,707,594.2) | 4,064,799.1 (4,040,572.7–4,085,986.6) | 265,029.3 (262,546.9–266,546.5) | 19,165.2 (19,113.9–19,212.1) | 269,714.1 (178,835.4–393,641.9) | 559.3 (371.2–812.5) |
| 2013 | Both sexes | 6,371,104.4 (6,347,846.5–6,397,764.3) | 4,189,151.9 (4,155,310.9–4,225,954.9) | 260,731.5 (257,914.9–263,680.2) | 19,054.5 (18,993.9–19,109.6) | 278,730.2 (186,479.8–404,043.5) | 554.7 (369.3–805.9) | |
| Luxembourg | 1990 | Both sexes | 38,242.1 (37,991.0–38,435.2) | 27,197.6 (26,628.1–27,574.4) | 1,698.3 (1,655.8–1,732.7) | 19,143.8 (18,891.7–19,302.4) | 1,836.4 (1,229.7–2,677.6) | 564.5 (377.9–823.8) |
| 2013 | Both sexes | 54,261.5 (53,922.2–54,535.7) | 37,893.4 (36,874.5–38,503.1) | 2,407.2 (2,353.9–2,457.7) | 18,962.1 (18,730.0–19,110.0) | 2,578.7 (1,726.2–3,728.6) | 557.9 (373.0–802.9) | |
| Malta | 1990 | Both sexes | 38,246.2 (37,968.1–38,430.2) | 31,355.1 (30,837.3–31,649.8) | 2,166.9 (2,126.9–2,196.0) | 19,426.3 (19,205.8–19,558.9) | 2,102.1 (1,403.5–3,051.9) | 572.9 (382.8–831.2) |
| 2013 | Both sexes | 43,139.9 (42,890.4–43,333.1) | 28,582.3 (27,817.2–28,971.0) | 1,793.1 (1,754.1–1,822.5) | 19,078.4 (18,777.9–19,184.0) | 1,942.9 (1,294.1–2,833.3) | 560.1 (373.6–815.5) | |
| Netherlands | 1990 | Both sexes | 1,529,951.3 (1,521,889.8–1,536,317.2) | 1,114,297.4 (1,100,700.2–1,122,318.7) | 70,714.4 (69,683.2–71,692.2) | 19,518.3 (19,392.1–19,597.8) | 74,916.5 (49,412.5–107,892.4) | 575.0 (380.6–830.6) |
| 2013 | Both sexes | 1,740,514.0 (1,730,311.7–1,748,714.5) | 1,227,307.4 (1,211,039.7–1,240,101.4) | 78,225.7 (76,871.9–79,768.8) | 19,251.7 (19,118.3–19,343.7) | 83,919.1 (56,241.5–122,530.8) | 568.7 (378.0–832.3) | |
| Norway | 1990 | Both sexes | 430,119.9 (428,263.9–431,833.2) | 313,464.5 (311,418.3–315,034.2) | 20,262.4 (20,023.6–20,554.7) | 19,087.2 (19,010.2–19,142.8) | 20,570.6 (13,567.0–30,052.3) | 551.2 (364.7–802.3) |
| 2013 | Both sexes | 513,713.4 (511,282.1–516,180.2) | 365,384.1 (362,108.3–367,797.4) | 23,377.8 (23,056.9–23,798.5) | 18,941.7 (18,835.9–19,010.3) | 24,095.4 (16,060.9–35,126.8) | 547.3 (362.8–796.1) | |
| Portugal | 1990 | Both sexes | 993,414.9 (985,720.3–999,092.3) | 773,643.3 (764,334.1–780,290.2) | 52,929.3 (52,227.5–53,474.6) | 19,095.0 (18,903.5–19,209.2) | 52,224.2 (35,027.2–75,874.2) | 564.8 (378.1–821.5) |
| 2013 | Both sexes | 1,075,657.0 (1,070,002.0–1,080,675.1) | 730,302.0 (720,014.7–738,613.6) | 45,662.9 (45,054.8–46,351.2) | 18,904.1 (18,757.9–18,983.1) | 50,042.6 (33,426.2–72,049.6) | 558.7 (372.4–808.4) | |
| Spain | 1990 | Both sexes | 4,035,921.3 (3,994,779.3–4,065,167.8) | 3,089,177.9 (3,026,435.5–3,116,424.7) | 206,267.8 (203,728.2–209,216.2) | 19,777.1 (19,584.9–19,906.6) | 203,696.3 (135,973.2–296,867.8) | 572.0 (381.7–833.6) |
| 2013 | Both sexes | 4,966,007.7 (4,931,761.3–4,990,857.1) | 3,320,990.4 (3,257,995.9–3,351,095.4) | 200,650.4 (197,343.4–208,225.7) | 19,425.6 (19,274.7–19,540.9) | 218,518.4 (144,996.5–318,757.7) | 560.2 (372.3–814.3) | |
| Sweden | 1990 | Both sexes | 879,252.5 (873,219.3–884,003.7) | 625,992.5 (616,077.1–632,559.3) | 39,487.5 (38,764.8–40,067.1) | 19,162.2 (18,942.8–19,294.5) | 42,451.3 (28,326.8–61,747.4) | 564.8 (376.1–822.0) |
| 2013 | Both sexes | 988,924.5 (983,340.9–993,398.8) | 678,255.4 (665,305.0–686,979.8) | 42,389.4 (41,458.6–43,177.4) | 19,081.4 (18,863.4–19,205.0) | 46,149.7 (30,705.2–66,263.6) | 560.0 (373.7–810.1) | |
| Switzerland | 1990 | Both sexes | 679,201.8 (675,785.5–682,501.4) | 479,171.1 (471,959.9–484,887.5) | 30,467.8 (30,067.4–30,868.7) | 19,149.4 (19,032.5–19,251.4) | 32,262.0 (21,634.2–46,738.2) | 561.9 (376.2–812.8) |
| 2013 | Both sexes | 827,036.8 (822,001.8–830,784.4) | 549,874.0 (537,935.2–557,748.9) | 33,831.9 (33,212.0–34,514.9) | 19,109.0 (18,960.8–19,211.0) | 37,131.8 (24,834.7–54,090.7) | 559.1 (372.1–811.6) | |
| United Kingdom | 1990 | Both sexes | 5,942,605.6 (5,915,434.1–5,959,707.5) | 4,355,887.9 (4,303,299.7–4,385,568.1) | 282,541.9 (278,553.1–285,102.2) | 19,515.8 (19,337.4–19,609.6) | 294,054.7 (195,066.4–428,499.5) | 575.1 (382.0–838.5) |
| 2013 | Both sexes | 6,600,939.0 (6,578,110.1–6,617,571.9) | 4,609,474.9 (4,555,018.1–4,641,020.4) | 293,692.8 (289,576.5–296,510.6) | 19,251.9 (19,081.2–19,339.8) | 313,551.6 (208,816.8–454,452.5) | 566.5 (376.1–824.9) | |
| Southern Latin America | 1990 | Both sexes | 3,920,504.8 (3,904,421.2–3,935,320.3) | 3,946,360.5 (3,923,309.2–3,966,100.9) | 278,788.1 (276,532.9–280,445.2) | 16,089.3 (16,018.1–16,157.7) | 263,986.7 (176,116.7–383,023.5) | 510.6 (340.2–739.7) |
| 2013 | Both sexes | 4,754,530.4 (4,737,245.9–4,770,057.0) | 4,398,908.8 (4,373,375.3–4,422,755.3) | 291,654.6 (289,429.5–293,267.3) | 15,522.4 (15,458.3–15,580.6) | 296,152.2 (196,583.0–428,935.6) | 494.0 (328.1–715.4) | |
| Argentina | 1990 | Both sexes | 2,699,170.9 (2,684,876.4–2,710,756.4) | 2,748,168.1 (2,727,744.9–2,765,133.1) | 196,378.2 (194,272.5–197,824.2) | 16,649.7 (16,553.5–16,732.2) | 183,919.6 (122,971.8–267,204.5) | 529.0 (353.2–767.4) |
| 2013 | Both sexes | 3,280,959.1 (3,267,156.0–3,293,740.0) | 3,084,841.7 (3,061,250.5–3,105,566.2) | 206,652.3 (204,629.2–208,110.5) | 16,085.8 (15,999.6–16,162.2) | 207,183.5 (137,532.3–299,800.4) | 511.9 (339.8–740.6) | |
| Chile | 1990 | Both sexes | 956,554.8 (951,334.4–960,712.3) | 944,790.0 (938,748.6–950,246.5) | 64,919.1 (64,138.1–65,635.2) | 14,391.4 (14,313.8–14,462.7) | 63,092.7 (41,874.6–91,367.2) | 456.1 (303.0–660.7) |
| 2013 | Both sexes | 1,191,308.3 (1,185,285.2–1,196,299.5) | 1,058,260.6 (1,048,365.5–1,066,615.0) | 68,084.4 (67,296.7–68,715.4) | 13,981.7 (13,907.0–14,047.7) | 71,628.2 (47,818.2–104,465.9) | 444.2 (296.4–646.7) | |
| Uruguay | 1990 | Both sexes | 264,625.1 (263,378.2–265,661.3) | 253,265.7 (251,488.0–254,796.5) | 17,481.9 (17,308.3–17,588.4) | 17,204.7 (17,116.0–17,278.3) | 16,965.2 (11,293.3–24,547.3) | 544.8 (362.7–788.8) |
| 2013 | Both sexes | 282,034.4 (280,766.1–283,103.9) | 255,616.4 (253,109.0–257,433.5) | 16,906.0 (16,657.8–17,067.1) | 16,677.9 (16,575.0–16,749.3) | 17,327.5 (11,619.5–25,139.9) | 531.2 (356.3–771.7) | |
| High-income North America | 1990 | Both sexes | 24,609,564.4 (24,557,839.0–24,657,768.1) | 18,872,081.1 (18,805,539.8–18,940,055.5) | 1,259,779.5 (1,249,109.1–1,264,666.8) | 16,801.3 (16,764.6–16,836.7) | 1,268,468.3 (844,332.0–1,848,491.6) | 495.2 (329.7–719.1) |
| 2013 | Both sexes | 31,552,418.5 (31,483,373.5–31,616,433.0) | 22,813,332.0 (22,697,817.8–22,911,282.9) | 1,488,580.9 (1,479,729.7–1,496,456.5) | 16,773.0 (16,737.7–16,808.1) | 1,559,840.4 (1,041,759.2–2,254,251.7) | 496.4 (330.4–718.0) | |
| Canada | 1990 | Both sexes | 1,951,937.4 (1,942,568.6–1,961,961.1) | 1,627,596.7 (1,616,898.9–1,636,031.5) | 104,434.6 (103,172.1–105,725.7) | 14,385.2 (14,319.1–14,443.2) | 110,473.6 (73,705.6–159,331.8) | 446.4 (298.3–644.7) |
| 2013 | Both sexes | 2,463,157.6 (2,450,917.6–2,473,180.2) | 1,808,409.9 (1,796,167.1–1,822,467.3) | 108,130.1 (107,345.7–108,814.2) | 14,274.5 (14,222.0–14,321.6) | 124,874.4 (83,610.7–181,028.6) | 441.8 (295.1–640.7) | |
| United States | 1990 | Both sexes | 22,652,315.3 (22,601,377.3–22,700,375.0) | 17,240,356.5 (17,175,081.8–17,306,760.1) | 1,155,066.6 (1,144,354.8–1,159,516.3) | 17,074.1 (17,036.6–17,112.4) | 1,157,717.9 (770,572.9–1,687,740.9) | 500.7 (333.3–728.1) |
| 2013 | Both sexes | 29,083,601.7 (29,014,429.9–29,151,337.8) | 21,000,827.3 (20,884,770.3–21,101,540.1) | 1,380,183.8 (1,371,228.1–1,388,056.7) | 17,057.7 (17,019.1–17,098.1) | 1,434,687.1 (957,548.1–2,074,547.3) | 502.3 (334.2–726.2) | |
| Latin America and Caribbean | 1990 | Both sexes | 42,911,725.0 (42,703,991.5–43,042,155.2) | 46,100,041.4 (45,769,852.2–46,280,907.4) | 3,675,445.1 (3,639,954.5–3,695,871.0) | 21,840.3 (21,743.0–21,903.6) | 3,127,640.1 (2,091,548.1–4,519,421.5) | 700.7 (469.6–1,011.8) |
| 2013 | Both sexes | 52,639,465.4 (52,420,318.8–52,828,336.1) | 51,116,184.9 (50,794,607.3–51,368,105.5) | 3,746,592.9 (3,707,985.2–3,770,655.9) | 19,278.8 (19,189.5–19,358.0) | 3,505,007.6 (2,339,161.1–5,053,678.2) | 623.2 (416.5–897.3) | |
| Caribbean | 1990 | Both sexes | 5,938,743.8 (5,930,111.1–5,947,202.1) | 6,199,108.0 (6,190,004.7–6,207,389.1) | 571,154.8 (567,476.2–574,110.3) | 34,728.5 (34,683.1–34,771.9) | 428,480.0 (286,814.3–616,316.8) | 1,134.1 (760.5–1,629.4) |
| 2013 | Both sexes | 6,898,142.0 (6,887,287.2–6,908,126.7) | 6,554,901.6 (6,545,172.3–6,563,892.4) | 554,742.0 (550,744.0–557,840.1) | 31,618.5 (31,574.8–31,660.3) | 452,787.4 (302,762.9–652,169.7) | 1,020.3 (682.4–1,468.9) | |
| Antigua and Barbuda | 1990 | Both sexes | 8,801.1 (8,773.7–8,822.2) | 8,338.0 (8,310.6–8,358.4) | 647.0 (634.6–653.1) | 28,751.3 (28,667.4–28,817.5) | 568.0 (378.8–820.2) | 899.2 (600.4–1,297.6) |
| 2013 | Both sexes | 12,588.0 (12,551.5–12,614.9) | 11,302.3 (11,270.2–11,327.6) | 843.6 (833.8–851.6) | 27,762.2 (27,691.4–27,821.0) | 772.1 (513.7–1,113.5) | 869.0 (579.0–1,252.5) | |
| The Bahamas | 1990 | Both sexes | 35,390.2 (35,308.5–35,464.7) | 34,565.7 (34,476.7–34,657.0) | 2,731.9 (2,608.6–2,770.7) | 27,549.9 (27,472.8–27,612.3) | 2,379.1 (1,589.0–3,434.7) | 869.5 (581.3–1,252.3) |
| 2013 | Both sexes | 51,234.4 (50,995.4–51,435.5) | 42,756.9 (42,582.3–42,899.9) | 3,116.4 (3,026.5–3,174.9) | 26,828.7 (26,733.9–26,911.8) | 2,973.2 (1,995.4–4,283.0) | 845.9 (568.5–1,214.9) | |
| Barbados | 1990 | Both sexes | 37,580.2 (37,451.5–37,668.9) | 33,392.8 (33,295.2–33,474.6) | 2,506.7 (2,451.0–2,530.2) | 28,817.2 (28,727.7–28,881.5) | 2,283.3 (1,524.4–3,312.5) | 904.8 (604.4–1,310.8) |
| 2013 | Both sexes | 39,705.2 (39,538.4–39,845.5) | 32,021.6 (31,925.8–32,102.1) | 2,270.4 (2,245.9–2,293.3) | 27,271.9 (27,193.4–27,340.6) | 2,219.8 (1,490.0–3,208.0) | 854.3 (573.0–1,233.7) | |
| Belize | 1990 | Both sexes | 29,056.0 (28,996.5–29,125.1) | 31,804.7 (31,739.0–31,862.9) | 2,680.6 (2,660.8–2,695.6) | 31,100.2 (31,026.7–31,176.0) | 2,151.4 (1,439.5–3,114.4) | 968.2 (649.1–1,397.4) |
| 2013 | Both sexes | 47,786.0 (47,653.5–47,886.3) | 47,725.0 (47,621.1–47,821.7) | 3,827.1 (3,797.3–3,856.2) | 29,129.4 (29,061.2–29,186.8) | 3,239.6 (2,153.1–4,700.7) | 907.0 (604.7–1,315.7) | |
| Cuba | 1990 | Both sexes | 1,580,506.4 (1,575,874.5–1,584,728.2) | 1,351,667.6 (1,347,508.6–1,354,773.0) | 100,670.8 (99,423.2–101,449.1) | 29,345.4 (29,269.3–29,408.4) | 92,270.9 (61,655.5–133,327.8) | 913.0 (610.7–1,315.9) |
| 2013 | Both sexes | 1,591,646.0 (1,586,201.7–1,596,586.6) | 1,238,237.9 (1,234,911.8–1,241,315.8) | 86,747.8 (85,819.9–87,369.0) | 27,371.8 (27,311.8–27,429.5) | 85,599.3 (57,172.6–123,984.5) | 851.2 (567.7–1,231.0) | |
| Dominica | 1990 | Both sexes | 9,213.1 (9,191.3–9,233.4) | 8,901.6 (8,880.1–8,925.3) | 685.7 (665.0–693.7) | 26,720.4 (26,653.9–26,781.2) | 608.2 (408.1–878.4) | 835.0 (561.8–1,202.3) |
| 2013 | Both sexes | 9,287.5 (9,263.9–9,306.9) | 8,293.4 (8,273.0–8,315.3) | 621.1 (607.7–631.2) | 26,105.3 (26,046.9–26,165.7) | 570.8 (381.1–825.4) | 815.7 (544.7–1,179.8) | |
| Dominican Republic | 1990 | Both sexes | 1,135,834.3 (1,133,054.5–1,138,216.7) | 1,182,297.9 (1,179,555.2–1,184,694.6) | 99,622.0 (97,418.9–100,469.9) | 31,773.3 (31,682.0–31,838.4) | 80,804.2 (53,893.4–116,681.6) | 995.3 (663.7–1,435.6) |
| 2013 | Both sexes | 1,472,016.0 (1,467,696.7–1,475,046.9) | 1,390,019.9 (1,386,328.4–1,392,820.9) | 109,277.8 (107,492.9–110,608.7) | 28,061.2 (27,976.6–28,119.4) | 95,551.6 (64,103.5–137,473.9) | 880.0 (591.0–1,262.1) | |
| Grenada | 1990 | Both sexes | 16,629.0 (16,602.6–16,655.9) | 16,634.1 (16,598.7–16,667.6) | 1,406.9 (1,377.5–1,420.5) | 34,481.8 (34,408.1–34,548.9) | 1,135.8 (761.1–1,636.4) | 1,067.2 (718.6–1,534.7) |
| 2013 | Both sexes | 17,196.3 (17,154.4–17,232.9) | 14,880.1 (14,842.9–14,918.6) | 1,175.2 (1,151.1–1,195.4) | 31,531.8 (31,459.3–31,599.7) | 1,028.9 (688.2–1,482.5) | 972.8 (651.5–1,400.6) | |
| Guyana | 1990 | Both sexes | 137,840.4 (137,542.2–138,227.9) | 148,006.1 (147,622.1–148,295.4) | 14,215.3 (14,113.1–14,270.1) | 41,703.4 (41,610.8–41,791.2) | 10,187.8 (6,819.1–14,672.7) | 1,362.9 (913.5–1,961.1) |
| 2013 | Both sexes | 128,156.3 (127,850.0–128,406.0) | 138,191.2 (137,941.4–138,417.1) | 12,339.5 (12,261.7–12,405.1) | 34,391.2 (34,316.1–34,458.4) | 9,442.0 (6,299.4–13,622.9) | 1,099.2 (737.3–1,582.6) | |
| Haiti | 1990 | Both sexes | 1,483,355.4 (1,480,690.6–1,487,982.4) | 1,918,393.1 (1,913,567.1–1,921,500.4) | 218,620.2 (216,488.3–219,994.0) | 50,174.9 (50,064.8–50,277.8) | 135,177.5 (90,780.5–193,913.6) | 1,762.5 (1,187.3–2,518.2) |
| 2013 | Both sexes | 1,963,466.5 (1,959,492.1–1,966,763.1) | 2,236,910.4 (2,232,899.7–2,240,651.2) | 224,121.1 (222,203.1–225,824.6) | 42,607.4 (42,528.4–42,681.1) | 155,139.7 (104,084.9–223,088.7) | 1,436.1 (966.0–2,062.3) | |
| Jamaica | 1990 | Both sexes | 361,467.5 (360,653.5–362,250.5) | 366,215.1 (365,312.3–366,990.7) | 30,141.7 (29,290.8–30,505.5) | 30,366.4 (30,288.7–30,431.2) | 25,077.8 (16,777.7–36,210.9) | 958.8 (642.9–1,380.8) |
| 2013 | Both sexes | 398,737.6 (397,364.0–399,653.4) | 366,060.6 (364,951.7–367,002.4) | 28,342.2 (27,418.2–28,753.4) | 28,300.9 (28,205.3–28,366.9) | 25,112.3 (16,754.8–36,200.0) | 888.1 (592.5–1,279.6) | |
| Saint Lucia | 1990 | Both sexes | 21,558.2 (21,515.7–21,603.7) | 22,036.8 (21,983.5–22,078.8) | 1,804.7 (1,769.8–1,819.5) | 30,881.8 (30,812.4–30,943.9) | 1,490.0 (993.8–2,142.5) | 960.1 (643.0–1,379.1) |
| 2013 | Both sexes | 26,364.8 (26,273.2–26,432.1) | 23,132.7 (23,067.9–23,187.5) | 1,742.9 (1,717.2–1,759.5) | 28,531.8 (28,446.7–28,596.9) | 1,588.0 (1,058.4–2,292.7) | 892.1 (595.0–1,286.7) | |
| Saint Vincent and the Grenadines | 1990 | Both sexes | 16,736.9 (16,698.7–16,768.7) | 17,616.3 (17,572.3–17,646.1) | 1,492.5 (1,472.0–1,503.4) | 31,920.2 (31,838.5–31,982.1) | 1,198.4 (801.0–1,729.9) | 999.4 (669.1–1,442.5) |
| 2013 | Both sexes | 15,520.7 (15,472.0–15,557.7) | 13,795.6 (13,758.3–13,828.7) | 1,044.7 (1,034.2–1,053.7) | 28,064.7 (27,991.6–28,127.0) | 946.7 (631.1–1,370.0) | 876.0 (584.5–1,266.8) | |
| Suriname | 1990 | Both sexes | 70,033.9 (69,862.4–70,227.2) | 69,801.3 (69,623.5–69,936.3) | 6,011.8 (5,939.1–6,046.8) | 35,288.3 (35,201.8–35,364.0) | 4,758.4 (3,186.4–6,873.3) | 1,105.6 (742.3–1,592.9) |
| 2013 | Both sexes | 83,795.1 (83,569.6–83,965.8) | 77,382.4 (77,198.2–77,533.1) | 6,168.5 (6,117.3–6,217.4) | 31,146.7 (31,071.9–31,206.5) | 5,294.1 (3,536.2–7,630.2) | 974.2 (650.8–1,403.0) | |
| Trinidad and Tobago | 1990 | Both sexes | 179,140.0 (178,597.8–179,614.5) | 178,902.2 (178,428.9–179,314.0) | 14,435.2 (14,223.7–14,598.4) | 29,410.1 (29,331.8–29,486.6) | 12,211.0 (8,188.4–17,703.5) | 920.4 (615.5–1,329.3) |
| 2013 | Both sexes | 185,962.1 (185,228.9–186,561.1) | 154,638.9 (154,108.6–155,100.6) | 11,087.7 (10,935.5–11,200.4) | 27,312.0 (27,228.5–27,386.2) | 10,641.7 (7,111.9–15,403.8) | 854.0 (571.1–1,235.0) | |
| Andean Latin America | 1990 | Both sexes | 4,618,222.1 (4,607,096.6–4,628,420.8) | 5,687,409.6 (5,676,193.7–5,696,377.5) | 483,780.9 (482,404.4–484,914.2) | 25,020.3 (24,959.5–25,071.8) | 384,622.3 (256,395.4–553,457.0) | 847.4 (568.3–1,219.2) |
| 2013 | Both sexes | 5,883,485.1 (5,863,266.6–5,900,842.4) | 6,670,009.0 (6,636,303.0–6,690,540.5) | 518,491.0 (513,063.3–521,656.3) | 22,168.8 (22,087.1–22,230.7) | 454,300.9 (302,822.4–656,719.7) | 757.9 (505.9–1,093.9) | |
| Bolivia | 1990 | Both sexes | 893,010.0 (890,878.5–895,767.0) | 1,265,211.3 (1,262,004.2–1,267,325.6) | 128,881.0 (128,510.5–129,268.3) | 29,522.8 (29,443.1–29,597.0) | 87,713.8 (58,900.8–125,541.3) | 1,064.6 (716.4–1,526.3) |
| 2013 | Both sexes | 1,236,047.1 (1,230,900.1–1,239,722.2) | 1,630,994.0 (1,623,937.4–1,635,127.0) | 149,087.7 (148,065.3–149,725.3) | 26,106.4 (26,012.4–26,176.7) | 111,723.3 (74,543.4–160,625.8) | 932.4 (622.5–1,340.4) | |
| Ecuador | 1990 | Both sexes | 1,294,060.6 (1,290,173.2–1,298,532.5) | 1,580,850.8 (1,576,637.8–1,584,138.3) | 134,546.0 (133,746.3–135,111.1) | 26,989.0 (26,899.5–27,066.0) | 106,914.8 (71,328.5–154,214.1) | 913.1 (609.1–1,317.3) |
| 2013 | Both sexes | 1,702,894.1 (1,697,887.4–1,707,958.1) | 1,904,618.4 (1,899,350.4–1,909,751.4) | 146,145.4 (145,489.6–146,683.9) | 23,074.5 (23,005.6–23,138.9) | 129,585.0 (86,485.1–187,389.0) | 784.4 (524.7–1,132.3) | |
| Peru | 1990 | Both sexes | 2,431,151.5 (2,423,304.0–2,439,480.9) | 2,841,347.5 (2,832,693.0–2,848,153.7) | 220,353.8 (219,301.2–221,087.1) | 22,670.1 (22,590.8–22,747.2) | 189,993.7 (126,656.5–273,267.2) | 746.1 (500.3–1,072.7) |
| 2013 | Both sexes | 2,944,544.0 (2,930,083.2–2,957,754.1) | 3,134,396.7 (3,109,726.6–3,151,403.8) | 223,257.9 (218,806.2–225,868.8) | 20,283.3 (20,162.6–20,380.5) | 212,992.6 (142,665.4–308,810.8) | 678.3 (454.8–980.5) | |
| Central Latin America | 1990 | Both sexes | 19,133,876.5 (19,069,418.7–19,182,093.8) | 20,220,046.8 (20,136,035.3–20,274,140.9) | 1,621,518.8 (1,614,033.9–1,626,666.6) | 22,805.8 (22,737.6–22,856.8) | 1,367,223.9 (913,631.7–1,977,547.4) | 715.0 (477.9–1,031.3) |
| 2013 | Both sexes | 24,431,029.6 (24,247,487.4–24,535,719.4) | 23,343,421.8 (23,140,957.7–23,495,804.1) | 1,726,159.0 (1,712,910.9–1,737,200.1) | 19,739.6 (19,590.9–19,838.4) | 1,595,451.2 (1,064,379.0–2,312,758.1) | 624.4 (417.5–903.4) | |
| Colombia | 1990 | Both sexes | 3,713,050.6 (3,669,731.6–3,741,896.6) | 3,782,072.5 (3,720,335.7–3,812,499.2) | 290,576.7 (285,438.2–293,554.3) | 22,134.7 (21,883.7–22,283.2) | 254,852.0 (170,135.8–368,139.7) | 686.2 (460.3–989.9) |
| 2013 | Both sexes | 4,778,030.0 (4,598,647.7–4,847,795.8) | 4,379,709.8 (4,187,493.9–4,485,973.8) | 310,934.1 (298,436.4–319,573.3) | 19,510.4 (18,776.3–19,875.3) | 298,207.9 (198,855.3–434,377.0) | 609.1 (406.9–885.4) | |
| Costa Rica | 1990 | Both sexes | 289,562.6 (286,781.9–290,628.7) | 291,915.8 (288,185.5–293,957.7) | 21,676.1 (21,469.3–21,772.4) | 18,341.9 (18,170.5–18,435.9) | 19,731.0 (13,202.5–28,584.3) | 573.2 (384.5–829.0) |
| 2013 | Both sexes | 435,200.5 (432,308.4–436,809.1) | 381,094.3 (375,753.4–384,758.0) | 26,213.4 (25,973.7–26,358.9) | 17,805.4 (17,627.8–17,919.6) | 26,348.4 (17,555.4–38,151.2) | 563.9 (376.0–814.5) | |
| El Salvador | 1990 | Both sexes | 744,093.0 (742,061.7–746,519.2) | 923,800.4 (920,936.8–925,585.0) | 88,097.9 (87,790.2–88,362.9) | 32,198.1 (32,114.8–32,272.9) | 62,960.0 (42,258.8–90,530.1) | 1,095.9 (737.4–1,571.9) |
| 2013 | Both sexes | 824,626.1 (822,331.4–826,708.5) | 942,974.3 (940,651.1–945,314.4) | 82,966.4 (82,660.4–83,221.9) | 29,214.3 (29,139.3–29,287.2) | 64,118.0 (42,957.1–91,816.0) | 995.8 (667.1–1,424.1) | |
| Guatemala | 1990 | Both sexes | 1,670,040.5 (1,666,664.1–1,673,715.0) | 1,864,783.2 (1,859,821.7–1,867,471.4) | 179,424.6 (178,977.4–180,207.5) | 41,291.4 (41,198.2–41,376.4) | 126,580.3 (84,961.4–182,417.7) | 1,289.5 (870.5–1,850.6) |
| 2013 | Both sexes | 2,544,892.7 (2,536,366.5–2,550,015.3) | 2,675,207.9 (2,666,190.6–2,680,102.3) | 234,426.6 (233,419.9–235,172.5) | 34,575.5 (34,445.0–34,652.5) | 181,313.1 (121,047.6–261,514.9) | 1,072.1 (720.8–1,542.0) | |
| Honduras | 1990 | Both sexes | 763,829.4 (762,151.3–765,248.9) | 801,053.6 (799,228.1–802,407.8) | 67,388.9 (67,098.7–67,621.5) | 31,091.9 (30,996.9–31,166.6) | 54,008.8 (36,089.2–78,085.7) | 932.0 (625.3–1,344.7) |
| 2013 | Both sexes | 1,020,980.6 (1,014,010.0–1,026,064.7) | 957,859.6 (945,858.3–967,266.4) | 73,528.5 (72,564.4–74,263.2) | 24,168.6 (23,968.3–24,336.6) | 64,928.6 (43,407.3–93,886.4) | 724.8 (485.7–1,046.9) | |
| Mexico | 1990 | Both sexes | 9,570,893.6 (9,545,210.0–9,588,307.7) | 10,135,055.4 (10,094,687.4–10,155,406.5) | 791,596.6 (786,606.7–794,169.6) | 22,258.7 (22,197.9–22,295.9) | 685,402.4 (457,589.6–991,448.8) | 700.1 (467.1–1,010.9) |
| 2013 | Both sexes | 11,604,867.2 (11,568,412.6–11,630,086.4) | 11,113,280.8 (11,057,117.9–11,144,276.0) | 792,755.8 (786,663.5–796,011.8) | 18,922.2 (18,847.7–18,969.1) | 760,373.6 (507,699.1–1,100,584.6) | 602.1 (402.2–870.1) | |
| Nicaragua | 1990 | Both sexes | 475,633.9 (474,116.7–476,891.5) | 519,756.3 (517,455.5–522,036.4) | 41,347.7 (41,179.4–41,517.8) | 22,063.9 (21,973.2–22,141.7) | 34,472.1 (23,236.4–49,796.1) | 648.3 (437.5–924.0) |
| 2013 | Both sexes | 598,185.1 (593,359.9–603,623.9) | 567,861.8 (560,866.1–574,178.0) | 41,603.8 (41,121.4–42,084.4) | 18,980.9 (18,799.8–19,153.2) | 38,585.7 (25,874.8–55,617.1) | 582.9 (391.3–838.0) | |
| Panama | 1990 | Both sexes | 262,495.4 (261,007.3–263,725.5) | 265,242.5 (263,283.6–266,765.2) | 20,157.1 (20,025.7–20,259.9) | 20,762.9 (20,649.7–20,846.5) | 17,890.1 (11,976.2–25,856.7) | 643.9 (431.0–929.3) |
| 2013 | Both sexes | 382,761.5 (375,081.7–387,234.1) | 351,468.5 (342,913.3–358,387.0) | 25,226.3 (24,596.1–25,721.5) | 19,385.6 (18,987.0–19,670.8) | 24,051.8 (16,055.3–34,857.4) | 605.7 (405.2–877.2) | |
| Venezuela | 1990 | Both sexes | 1,644,277.5 (1,614,671.5–1,672,558.5) | 1,636,367.2 (1,610,063.0–1,670,614.0) | 121,253.3 (119,183.5–123,407.5) | 15,270.5 (15,052.8–15,507.1) | 111,327.3 (74,797.4–162,256.7) | 470.7 (316.4–681.6) |
| 2013 | Both sexes | 2,241,485.9 (2,181,355.8–2,281,628.6) | 1,973,964.9 (1,910,588.6–2,046,597.6) | 138,504.2 (134,515.4–143,371.7) | 14,007.8 (13,629.9–14,355.7) | 137,524.1 (91,347.9–198,872.0) | 436.5 (290.2–630.9) | |
| Tropical Latin America | 1990 | Both sexes | 13,220,882.7 (13,034,568.9–13,327,194.0) | 13,993,477.0 (13,729,045.1–14,152,340.2) | 998,990.6 (967,631.3–1,017,564.2) | 16,892.7 (16,674.9–17,026.9) | 947,313.9 (631,364.7–1,374,494.0) | 544.2 (363.1–786.7) |
| 2013 | Both sexes | 15,426,808.6 (15,284,747.2–15,544,259.0) | 14,547,852.4 (14,310,424.4–14,696,682.8) | 947,200.9 (918,882.9–962,969.0) | 15,257.5 (15,069.2–15,384.1) | 1,002,468.1 (669,697.8–1,442,087.1) | 496.0 (331.7–712.9) | |
| Brazil | 1990 | Both sexes | 12,861,292.1 (12,676,605.2–12,966,254.7) | 13,595,547.9 (13,334,661.0–13,751,878.4) | 970,135.2 (939,161.2–988,576.1) | 16,919.3 (16,699.0–17,055.9) | 920,493.6 (613,646.9–1,335,499.1) | 544.9 (363.6–787.8) |
| 2013 | Both sexes | 14,889,578.1 (14,749,941.4–15,006,240.3) | 13,998,035.1 (13,770,275.7–14,145,406.7) | 908,913.4 (882,332.8–924,268.5) | 15,247.8 (15,056.5–15,378.3) | 965,059.3 (644,703.1–1,387,392.3) | 495.7 (331.5–712.0) | |
| Paraguay | 1990 | Both sexes | 359,590.6 (355,008.8–361,716.9) | 397,929.1 (389,362.4–401,289.5) | 28,855.4 (27,955.8–29,278.6) | 15,898.4 (15,684.0–16,012.4) | 26,820.3 (17,851.2–38,992.3) | 517.7 (346.3–750.6) |
| 2013 | Both sexes | 537,230.5 (532,612.3–539,397.3) | 549,817.4 (535,857.9–555,115.4) | 38,287.5 (36,647.9–38,975.4) | 15,480.1 (15,265.6–15,582.5) | 37,408.7 (24,972.8–54,216.7) | 503.1 (335.3–728.7) | |
| North Africa and Middle East | 1990 | Both sexes | 50,945,834.8 (50,878,767.9–51,004,121.9) | 56,166,967.3 (56,096,038.7–56,222,508.9) | 4,957,998.8 (4,947,921.7–4,968,630.8) | 32,756.6 (32,713.4–32,793.5) | 3,766,788.6 (2,515,159.2–5,440,566.0) | 1,010.0 (676.0–1,456.4) |
| 2013 | Both sexes | 71,231,000.5 (71,135,176.5–71,317,287.2) | 68,788,986.2 (68,701,152.6–68,866,185.9) | 5,584,631.8 (5,571,567.9–5,596,303.0) | 28,353.0 (28,322.0–28,381.3) | 4,594,913.2 (3,055,766.9–6,646,118.0) | 872.4 (581.2–1,261.2) | |
| Algeria | 1990 | Both sexes | 3,816,842.8 (3,809,789.3–3,825,361.7) | 4,228,533.4 (4,219,188.9–4,234,590.4) | 353,815.8 (352,357.2–355,172.8) | 29,658.1 (29,591.1–29,712.6) | 281,566.1 (188,122.9–407,567.7) | 898.5 (600.3–1,299.2) |
| 2013 | Both sexes | 5,157,278.3 (5,147,597.5–5,166,450.3) | 4,642,047.0 (4,631,397.0–4,651,334.0) | 335,432.4 (333,484.4–337,343.2) | 25,948.2 (25,900.9–25,992.7) | 306,735.1 (203,504.6–446,707.6) | 783.0 (520.5–1,137.5) | |
| Bahrain | 1990 | Both sexes | 73,812.1 (73,669.4–73,963.2) | 76,561.0 (76,349.9–76,788.1) | 6,997.6 (6,773.5–7,102.6) | 31,836.5 (31,770.7–31,895.8) | 5,253.3 (3,530.8–7,578.1) | 1,027.1 (691.3–1,477.2) |
| 2013 | Both sexes | 175,858.3 (175,462.0–176,234.2) | 160,552.3 (160,125.3–160,948.5) | 14,117.1 (13,631.0–14,348.4) | 28,885.6 (28,835.9–28,930.7) | 11,086.5 (7,441.6–15,913.1) | 929.1 (623.8–1,329.9) | |
| Egypt | 1990 | Both sexes | 8,860,823.8 (8,842,398.4–8,886,812.2) | 9,673,875.5 (9,642,457.6–9,690,364.8) | 831,694.9 (827,829.6–838,030.9) | 32,906.7 (32,820.9–32,979.2) | 645,815.7 (431,452.3–932,099.0) | 1,025.7 (686.6–1,480.2) |
| 2013 | Both sexes | 11,609,428.9 (11,583,595.9–11,630,385.1) | 11,597,126.8 (11,572,394.4–11,617,717.7) | 918,878.0 (915,095.4–922,201.7) | 28,989.9 (28,930.0–29,041.9) | 769,570.4 (512,865.3–1,113,636.3) | 897.8 (598.7–1,297.3) | |
| Iran | 1990 | Both sexes | 8,659,325.8 (8,646,338.5–8,670,242.9) | 9,367,288.7 (9,353,770.9–9,378,780.8) | 790,430.2 (786,307.0–793,768.6) | 30,740.3 (30,685.1–30,789.7) | 624,664.9 (417,628.6–904,496.0) | 905.9 (603.7–1,313.6) |
| 2013 | Both sexes | 9,192,375.4 (9,170,815.6–9,208,771.9) | 7,544,080.1 (7,524,942.4–7,561,072.1) | 516,376.2 (513,794.0–518,089.4) | 23,035.1 (22,992.5–23,072.3) | 497,980.2 (330,648.3–723,404.7) | 676.5 (450.1–980.3) | |
| Iraq | 1990 | Both sexes | 2,712,130.1 (2,707,236.1–2,717,480.9) | 3,037,040.2 (3,031,086.7–3,041,299.4) | 261,174.4 (258,984.0–262,807.7) | 31,843.7 (31,777.3–31,900.9) | 202,819.5 (135,395.8–293,607.4) | 967.8 (647.6–1,399.0) |
| 2013 | Both sexes | 4,973,410.0 (4,964,795.7–4,980,040.2) | 5,276,367.1 (5,268,059.6–5,283,280.6) | 436,710.5 (433,071.8–439,138.6) | 29,941.3 (29,886.5–29,985.0) | 352,033.1 (235,144.7–510,786.3) | 909.6 (608.7–1,317.8) | |
| Jordan | 1990 | Both sexes | 454,606.2 (453,860.8–455,412.8) | 518,840.9 (517,968.7–519,452.2) | 44,187.3 (43,994.3–44,404.9) | 28,000.3 (27,941.3–28,047.7) | 34,539.2 (23,013.8–49,976.5) | 850.4 (567.0–1,231.0) |
| 2013 | Both sexes | 934,576.8 (932,810.8–936,109.5) | 936,352.4 (934,481.3–937,827.5) | 72,427.6 (71,925.1–72,758.3) | 26,099.9 (26,051.5–26,138.9) | 61,909.4 (40,980.5–89,822.5) | 794.8 (527.0–1,150.4) | |
| Kuwait | 1990 | Both sexes | 278,197.9 (277,668.7–278,785.8) | 267,312.2 (266,748.5–267,779.2) | 21,321.0 (21,240.1–21,398.4) | 26,833.8 (26,785.3–26,880.7) | 17,855.9 (11,857.5–25,872.1) | 779.8 (518.9–1,132.5) |
| 2013 | Both sexes | 409,003.0 (408,425.2–409,589.7) | 324,182.9 (323,519.0–324,811.5) | 23,216.1 (23,105.1–23,309.8) | 23,622.8 (23,587.3–23,657.6) | 21,666.7 (14,340.3–31,643.1) | 680.9 (451.9–989.8) | |
| Lebanon | 1990 | Both sexes | 353,648.4 (352,809.9–354,419.7) | 360,149.5 (359,288.7–360,855.5) | 27,886.8 (27,743.1–28,031.9) | 26,040.0 (25,974.6–26,092.4) | 23,650.6 (15,825.0–34,188.9) | 788.1 (527.7–1,137.7) |
| 2013 | Both sexes | 606,318.9 (605,038.7–607,463.1) | 524,199.6 (522,929.3–525,373.0) | 37,612.1 (37,420.0–37,793.1) | 25,417.0 (25,372.3–25,458.2) | 34,687.9 (23,101.2–50,198.2) | 773.7 (515.6–1,118.4) | |
| Libya | 1990 | Both sexes | 559,178.2 (558,018.6–560,515.4) | 606,427.7 (605,093.9–607,379.1) | 49,594.9 (48,989.0–49,925.5) | 26,125.5 (26,064.6–26,177.1) | 40,338.5 (26,932.7–58,502.2) | 781.7 (520.2–1,132.4) |
| 2013 | Both sexes | 807,051.1 (805,442.9–808,447.7) | 763,063.8 (761,569.2–764,381.9) | 57,471.0 (56,866.2–57,800.3) | 26,000.1 (25,950.1–26,043.3) | 50,613.0 (33,732.8–73,415.8) | 785.8 (524.8–1,139.1) | |
| Morocco | 1990 | Both sexes | 3,798,889.6 (3,790,833.7–3,807,124.4) | 4,096,148.3 (4,087,921.2–4,102,358.6) | 345,905.8 (343,611.8–347,731.7) | 31,742.1 (31,676.8–31,798.3) | 273,141.4 (182,392.5–394,121.0) | 968.0 (647.1–1,395.3) |
| 2013 | Both sexes | 4,665,117.1 (4,656,941.0–4,672,845.5) | 4,284,233.5 (4,277,021.1–4,291,419.7) | 321,133.8 (318,158.0–322,770.7) | 28,177.9 (28,132.6–28,222.4) | 283,183.9 (188,053.9–411,402.6) | 853.1 (567.2–1,237.6) | |
| Palestine | 1990 | Both sexes | 291,064.6 (290,570.0–291,590.2) | 329,286.2 (328,722.4–329,696.2) | 26,899.7 (26,778.7–27,074.4) | 27,582.6 (27,522.3–27,635.8) | 21,809.8 (14,525.6–31,617.4) | 832.3 (553.9–1,204.4) |
| 2013 | Both sexes | 559,740.6 (558,786.3–560,589.5) | 595,904.5 (594,941.2–596,794.9) | 47,279.2 (47,123.1–47,428.4) | 25,762.4 (25,713.0–25,807.8) | 39,503.5 (26,352.4–57,203.1) | 777.3 (517.5–1,124.3) | |
| Oman | 1990 | Both sexes | 317,479.8 (317,014.6–317,953.6) | 341,988.2 (341,453.5–342,482.0) | 30,631.2 (30,305.9–30,815.4) | 35,588.4 (35,528.7–35,642.2) | 23,060.3 (15,350.0–33,282.1) | 1,069.0 (716.3–1,538.8) |
| 2013 | Both sexes | 483,640.0 (482,929.1–484,308.1) | 376,985.5 (376,214.7–377,654.5) | 28,268.0 (27,734.5–28,609.9) | 26,719.4 (26,680.6–26,753.0) | 25,477.0 (16,975.6–36,900.3) | 786.6 (526.0–1,134.3) | |
| Qatar | 1990 | Both sexes | 54,928.3 (54,860.4–54,989.6) | 45,656.5 (45,582.8–45,721.8) | 3,416.1 (3,396.0–3,433.1) | 22,389.4 (22,359.6–22,414.8) | 3,054.3 (2,025.0–4,442.3) | 640.6 (425.9–928.2) |
| 2013 | Both sexes | 210,064.2 (209,797.3–210,257.6) | 125,481.4 (125,204.4–125,769.0) | 8,269.0 (8,236.2–8,296.1) | 20,411.6 (20,386.9–20,433.8) | 8,520.4 (5,616.6–12,564.8) | 583.8 (387.9–850.7) | |
| Saudi Arabia | 1990 | Both sexes | 2,554,370.7 (2,550,534.5–2,558,788.4) | 2,645,914.4 (2,639,524.8–2,653,644.5) | 227,770.6 (221,941.6–230,551.1) | 31,760.6 (31,697.5–31,818.2) | 179,059.5 (119,610.3–258,075.0) | 949.3 (636.5–1,367.9) |
| 2013 | Both sexes | 3,688,488.2 (3,682,139.2–3,694,102.6) | 3,329,647.6 (3,322,347.1–3,335,751.5) | 262,499.9 (252,834.9–266,737.9) | 25,478.4 (25,422.8–25,524.1) | 225,631.9 (150,688.6–326,408.8) | 762.3 (509.6–1,100.4) | |
| Syria | 1990 | Both sexes | 1,936,073.5 (1,932,879.7–1,939,295.8) | 2,202,104.0 (2,198,536.6–2,204,844.8) | 190,827.4 (189,704.2–192,006.6) | 32,254.4 (32,194.8–32,306.9) | 146,522.9 (97,796.7–211,711.3) | 968.1 (647.5–1,397.1) |
| 2013 | Both sexes | 2,995,762.7 (2,991,178.7–3,000,167.2) | 3,032,303.4 (3,027,727.7–3,036,825.1) | 241,584.1 (239,986.6–242,525.3) | 27,585.6 (27,548.9–27,622.8) | 200,884.1 (133,736.8–290,686.1) | 827.6 (551.5–1,199.4) | |
| Tunisia | 1990 | Both sexes | 1,132,214.6 (1,129,883.1–1,134,557.0) | 1,181,461.7 (1,179,072.6–1,183,428.5) | 95,380.7 (94,563.2–96,072.2) | 28,084.1 (28,024.1–28,134.9) | 78,709.6 (52,405.8–113,894.2) | 851.3 (566.8–1,232.2) |
| 2013 | Both sexes | 1,384,440.8 (1,381,363.4–1,387,051.4) | 1,197,197.5 (1,193,863.7–1,200,001.0) | 84,369.9 (83,839.7–84,809.2) | 24,951.5 (24,899.6–24,997.3) | 79,327.0 (52,639.0–115,457.7) | 756.6 (502.8–1,098.9) | |
| Turkey | 1990 | Both sexes | 7,995,034.3 (7,978,788.7–8,012,062.3) | 8,240,303.5 (8,221,706.4–8,251,609.2) | 669,134.6 (666,432.2–671,593.2) | 30,089.5 (30,030.3–30,143.5) | 547,121.9 (366,404.5–793,083.8) | 914.3 (612.4–1,325.2) |
| 2013 | Both sexes | 9,395,772.0 (9,379,645.4–9,410,221.3) | 8,540,659.9 (8,527,691.7–8,552,710.0) | 620,104.3 (617,792.6–622,108.7) | 25,076.9 (25,039.7–25,111.5) | 563,057.1 (374,568.9–818,363.6) | 758.6 (504.9–1,101.5) | |
| United Arab Emirates | 1990 | Both sexes | 271,902.9 (271,571.2–272,215.0) | 231,790.3 (231,390.0–232,110.7) | 18,774.8 (18,634.5–18,878.7) | 29,526.4 (29,484.6–29,565.6) | 15,602.6 (10,365.5–22,615.7) | 853.9 (569.9–1,234.3) |
| 2013 | Both sexes | 1,155,442.2 (1,153,636.6–1,157,023.9) | 758,283.5 (756,449.3–759,869.5) | 51,520.4 (50,992.9–51,839.1) | 25,441.0 (25,405.0–25,472.8) | 51,053.6 (33,906.6–74,936.4) | 737.8 (493.6–1,069.1) | |
| Yemen | 1990 | Both sexes | 2,441,119.4 (2,437,185.1–2,449,189.3) | 3,198,996.9 (3,187,981.4–3,203,281.5) | 346,640.9 (345,142.0–349,184.8) | 49,602.3 (49,484.1–49,701.7) | 220,562.6 (147,553.9–316,604.4) | 1,664.8 (1,118.6–2,384.4) |
| 2013 | Both sexes | 5,305,270.0 (5,298,665.9–5,312,045.5) | 6,366,823.4 (6,357,722.0–6,375,407.8) | 699,324.3 (697,604.3–701,071.7) | 50,813.6 (50,745.8–50,879.1) | 442,192.9 (296,559.6–636,199.2) | 1,714.1 (1,153.1–2,457.2) | |
| South Asia | 1990 | Both sexes | 250,534,908.3 (250,163,550.5–251,141,169.4) | 311,017,380.4 (310,342,024.7–311,427,364.2) | 37,085,993.0 (36,949,764.8–37,188,025.7) | 53,600.1 (53,501.4–53,686.7) | 21,931,897.7 (14,751,353.7–31,334,203.7) | 1,874.4 (1,266.1–2,669.2) |
| 2013 | Both sexes | 283,437,229.8 (282,888,457.1–283,888,687.3) | 283,419,709.9 (282,907,232.9–283,916,295.1) | 24,828,081.6 (24,676,215.7–24,941,750.4) | 35,755.9 (35,693.7–35,815.2) | 19,207,951.5 (12,843,105.6–27,610,019.2) | 1,130.9 (756.8–1,623.5) | |
| Afghanistan | 1990 | Both sexes | 2,685,507.9 (2,682,916.6–2,691,890.9) | 3,721,215.5 (3,714,592.1–3,724,661.6) | 463,669.7 (462,654.7–464,669.0) | 57,402.7 (57,325.5–57,489.7) | 262,726.9 (176,943.8–374,725.1) | 2,051.4 (1,392.0–2,912.2) |
| 2013 | Both sexes | 6,452,643.1 (6,446,490.8–6,459,348.9) | 8,288,074.0 (8,280,277.6–8,295,777.4) | 926,905.5 (924,586.4–928,889.6) | 51,072.5 (51,016.7–51,130.4) | 575,290.0 (386,497.3–825,710.8) | 1,717.1 (1,161.7–2,458.2) | |
| Bangladesh | 1990 | Both sexes | 24,912,860.0 (24,864,012.6–24,994,350.3) | 34,909,928.0 (34,810,075.6–34,959,451.6) | 4,782,565.0 (4,771,293.0–4,792,239.2) | 60,678.3 (60,546.0–60,801.4) | 2,524,039.7 (1,705,123.1–3,585,871.9) | 2,254.0 (1,528.6–3,192.6) |
| 2013 | Both sexes | 29,369,953.7 (29,302,141.7–29,429,322.8) | 29,449,553.0 (29,385,453.0–29,521,574.4) | 2,664,553.5 (2,651,849.8–2,677,622.8) | 39,348.3 (39,259.7–39,435.1) | 1,994,019.8 (1,333,001.9–2,874,179.6) | 1,239.5 (828.4–1,780.0) | |
| Bhutan | 1990 | Both sexes | 81,930.4 (81,764.9–82,124.8) | 92,036.7 (91,805.9–92,181.2) | 7,882.3 (7,841.5–7,910.6) | 31,466.3 (31,380.6–31,534.7) | 6,170.7 (4,130.7–8,924.5) | 977.7 (655.2–1,410.9) |
| 2013 | Both sexes | 76,122.9 (74,663.0–76,550.3) | 74,245.1 (72,676.4–74,769.0) | 5,349.9 (5,256.1–5,395.0) | 20,515.8 (20,137.5–20,638.8) | 4,954.5 (3,297.2–7,198.7) | 641.5 (427.3–931.4) | |
| India | 1990 | Both sexes | 197,484,225.5 (197,146,527.7–198,074,869.6) | 242,764,403.3 (242,131,839.6–243,121,155.8) | 28,911,010.3 (28,772,479.2–29,006,790.4) | 54,189.2 (54,074.1–54,291.3) | 17,124,429.9 (11,520,720.0–24,457,190.0) | 1,896.5 (1,281.3–2,699.5) |
| 2013 | Both sexes | 215,706,218.1 (215,258,354.4–216,083,184.4) | 212,827,806.1 (212,383,414.6–213,251,012.7) | 18,525,569.5 (18,380,241.1–18,629,697.7) | 35,744.5 (35,675.1–35,810.1) | 14,440,372.7 (9,649,495.6–20,755,590.4) | 1,131.8 (757.8–1,624.4) | |
| Nepal | 1990 | Both sexes | 3,787,669.8 (3,782,162.1–3,794,798.0) | 4,379,260.7 (4,372,301.7–4,384,760.6) | 445,527.7 (444,623.6–446,309.0) | 46,536.2 (46,458.2–46,612.8) | 300,037.7 (201,110.3–431,413.7) | 1,505.3 (1,010.1–2,160.4) |
| 2013 | Both sexes | 4,671,257.9 (4,661,886.7–4,678,192.6) | 4,737,408.4 (4,731,125.4–4,743,304.9) | 402,863.3 (401,713.6–403,910.8) | 34,427.0 (34,371.1–34,473.2) | 317,721.5 (212,078.0–459,017.5) | 1,047.3 (696.8–1,514.0) | |
| Pakistan | 1990 | Both sexes | 21,582,714.6 (21,545,993.0–21,625,072.7) | 25,150,536.0 (25,107,712.3–25,184,918.0) | 2,475,338.0 (2,465,719.8–2,482,502.3) | 42,706.6 (42,617.0–42,787.4) | 1,714,492.7 (1,148,332.5–2,469,076.3) | 1,373.7 (923.7–1,970.7) |
| 2013 | Both sexes | 27,161,034.1 (27,100,434.9–27,212,548.3) | 28,042,623.4 (27,990,980.2–28,092,652.2) | 2,302,840.0 (2,288,204.2–2,312,991.1) | 30,694.5 (30,635.0–30,747.3) | 1,875,593.0 (1,254,378.5–2,709,539.8) | 954.7 (637.9–1,378.2) | |
| Sub-Saharan Africa | 1990 | Both sexes | 89,040,525.3 (88,898,291.6–89,127,145.2) | 119,012,467.9 (118,880,037.9–119,160,979.7) | 13,955,485.4 (13,868,657.0–13,999,980.3) | 42,080.4 (42,028.8–42,125.7) | 8,419,729.3 (5,669,257.1–11,988,879.5) | 1,456.6 (985.6–2,071.6) |
| 2013 | Both sexes | 147,744,661.0 (147,576,626.5–147,888,295.0) | 189,575,856.0 (189,363,382.9–189,748,395.3) | 20,358,244.3 (20,238,275.9–20,423,531.8) | 36,315.8 (36,273.9–36,348.6) | 13,256,982.9 (8,892,691.9–18,928,345.7) | 1,237.2 (833.0–1,766.4) | |
| Central Sub-Saharan Africa | 1990 | Both sexes | 10,779,192.9 (10,748,089.1–10,795,138.7) | 13,888,708.2 (13,854,073.6–13,929,190.4) | 1,550,849.9 (1,528,488.7–1,561,417.6) | 48,541.2 (48,442.7–48,633.9) | 967,429.9 (651,239.2–1,374,680.6) | 1,663.8 (1,126.3–2,358.4) |
| 2013 | Both sexes | 19,907,991.8 (19,876,522.1–19,937,898.8) | 24,830,871.1 (24,789,360.7–24,865,088.1) | 2,641,819.4 (2,609,248.5–2,655,512.9) | 45,090.3 (45,011.9–45,161.4) | 1,724,435.3 (1,156,488.3–2,455,378.2) | 1,515.8 (1,021.3–2,154.0) | |
| Angola | 1990 | Both sexes | 2,342,842.3 (2,330,370.9–2,350,222.5) | 3,136,500.3 (3,125,469.1–3,153,169.1) | 383,108.9 (378,166.7–385,877.1) | 56,977.6 (56,810.6–57,156.4) | 222,187.8 (149,751.4–314,625.3) | 2,070.7 (1,406.0–2,920.4) |
| 2013 | Both sexes | 3,892,961.6 (3,884,611.4–3,899,775.2) | 4,517,405.5 (4,507,280.1–4,526,289.7) | 428,233.7 (421,791.6–431,556.6) | 39,931.4 (39,846.2–40,005.8) | 309,071.9 (206,772.2–443,365.7) | 1,297.2 (871.4–1,853.5) | |
| Central African Republic | 1990 | Both sexes | 602,129.5 (599,623.1–602,954.1) | 746,986.3 (745,892.0–748,156.6) | 79,602.2 (78,708.8–80,085.1) | 47,828.7 (47,737.0–47,899.0) | 51,488.8 (34,739.2–73,557.0) | 1,613.6 (1,093.5–2,295.7) |
| 2013 | Both sexes | 964,924.3 (962,792.0–966,363.7) | 1,170,965.7 (1,168,819.6–1,172,851.8) | 125,967.4 (124,353.2–126,661.1) | 48,220.8 (48,117.1–48,299.4) | 81,348.0 (54,644.9–116,268.0) | 1,643.5 (1,107.2–2,344.1) | |
| Congo | 1990 | Both sexes | 434,352.1 (429,520.5–436,165.4) | 583,434.5 (581,747.3–585,088.9) | 63,962.7 (62,816.8–64,473.1) | 43,227.3 (43,035.1–43,375.2) | 40,555.8 (27,249.7–57,824.4) | 1,519.4 (1,026.0–2,156.1) |
| 2013 | Both sexes | 778,435.7 (776,519.5–779,675.7) | 1,019,582.2 (1,017,691.0–1,021,393.5) | 106,941.3 (105,235.4–107,579.4) | 40,410.1 (40,310.6–40,489.5) | 70,627.1 (47,394.5–101,200.8) | 1,414.1 (953.1–2,018.7) | |
| Democratic Republic of the Congo | 1990 | Both sexes | 7,125,940.7 (7,100,248.9–7,139,926.8) | 9,081,767.3 (9,050,252.6–9,113,766.8) | 985,947.5 (964,302.2–994,667.2) | 46,634.4 (46,501.5–46,756.1) | 629,394.3 (424,371.7–894,357.5) | 1,564.2 (1,060.7–2,223.6) |
| 2013 | Both sexes | 13,827,331.3 (13,800,898.2–13,853,705.7) | 17,594,030.9 (17,558,512.9–17,621,538.5) | 1,925,321.5 (1,893,735.0–1,936,557.8) | 46,951.5 (46,845.9–47,041.2) | 1,226,619.5 (822,875.6–1,744,437.9) | 1,586.1 (1,069.1–2,249.3) | |
| Equatorial Guinea | 1990 | Both sexes | 80,293.9 (80,108.1–80,474.7) | 90,148.9 (89,936.1–90,461.7) | 9,226.0 (9,003.9–9,329.1) | 46,668.5 (46,546.3–46,770.7) | 6,232.9 (4,192.1–8,928.4) | 1,561.3 (1,054.3–2,229.0) |
| 2013 | Both sexes | 117,921.3 (117,552.7–118,178.9) | 127,580.3 (127,058.9–127,955.5) | 10,848.1 (10,472.6–10,963.2) | 31,657.9 (31,529.4–31,741.5) | 8,680.5 (5,808.1–12,486.6) | 1,016.9 (685.4–1,457.3) | |
| Gabon | 1990 | Both sexes | 193,634.4 (193,006.3–194,147.4) | 249,870.8 (249,197.6–251,014.3) | 29,002.8 (28,586.5–29,198.5) | 49,452.0 (49,311.4–49,575.6) | 17,570.2 (11,851.7–24,963.5) | 1,770.3 (1,199.5–2,506.2) |
| 2013 | Both sexes | 326,417.6 (325,752.4–326,961.9) | 401,306.6 (400,585.1–402,031.0) | 44,507.4 (43,866.0–44,772.3) | 45,865.5 (45,776.1–45,945.4) | 28,088.4 (18,964.6–40,075.5) | 1,608.6 (1,090.3–2,285.2) | |
| Eastern Sub-Saharan Africa | 1990 | Both sexes | 30,641,447.7 (30,599,833.0–30,672,075.5) | 40,295,837.0 (40,250,545.0–40,336,252.6) | 4,208,706.4 (4,198,468.6–4,217,785.6) | 35,621.3 (35,577.4–35,656.9) | 2,780,443.3 (1,865,408.1–3,982,776.3) | 1,192.5 (803.1–1,704.3) |
| 2013 | Both sexes | 50,127,608.4 (50,073,010.2–50,175,435.3) | 63,556,993.7 (63,473,733.3–63,620,243.8) | 5,942,691.4 (5,925,087.3–5,956,032.9) | 29,062.2 (29,029.3–29,091.8) | 4,325,199.2 (2,892,741.8–6,215,770.5) | 965.6 (647.6–1,384.0) | |
| Burundi | 1990 | Both sexes | 737,078.4 (734,102.4–739,550.3) | 893,310.5 (888,373.2–897,910.7) | 76,514.2 (75,227.1–77,394.4) | 23,747.8 (23,672.9–23,816.6) | 60,007.1 (40,218.4–86,320.1) | 748.5 (500.2–1,079.2) |
| 2013 | Both sexes | 1,415,707.6 (1,412,429.4–1,418,869.1) | 1,656,301.9 (1,649,015.4–1,661,843.0) | 145,249.0 (143,426.6–146,359.2) | 25,922.9 (25,845.1–25,992.2) | 112,388.8 (75,251.7–162,719.5) | 819.3 (548.7–1,181.8) | |
| Comoros | 1990 | Both sexes | 58,955.2 (58,852.4–59,046.1) | 74,905.4 (74,790.9–75,006.3) | 6,818.0 (6,795.0–6,832.6) | 29,519.8 (29,452.9–29,568.9) | 5,074.3 (3,388.8–7,299.5) | 971.6 (649.7–1,393.4) |
| 2013 | Both sexes | 102,740.4 (102,502.1–102,930.8) | 126,315.6 (126,098.3–126,523.5) | 11,198.5 (11,153.4–11,234.1) | 28,483.9 (28,406.0–28,546.7) | 8,552.7 (5,735.6–12,316.5) | 939.8 (632.3–1,354.5) | |
| Djibouti | 1990 | Both sexes | 80,983.2 (80,723.8–81,210.7) | 101,588.0 (101,285.1–101,798.0) | 9,236.8 (9,198.9–9,276.1) | 29,230.0 (29,131.6–29,303.2) | 6,897.9 (4,615.8–9,930.3) | 966.6 (647.9–1,389.5) |
| 2013 | Both sexes | 131,012.3 (130,628.2–131,319.7) | 146,941.1 (146,561.4–147,272.5) | 13,111.7 (13,003.5–13,164.6) | 31,638.6 (31,542.7–31,719.8) | 10,015.1 (6,699.2–14,419.3) | 1,045.2 (701.4–1,500.8) | |
| Eritrea | 1990 | Both sexes | 648,904.4 (647,679.6–651,459.0) | 892,740.1 (888,707.0–894,101.5) | 107,379.5 (107,082.4–107,708.8) | 47,750.5 (47,624.1–47,861.8) | 63,221.8 (42,510.1–90,233.1) | 1,663.5 (1,121.8–2,366.1) |
| 2013 | Both sexes | 1,103,450.8 (1,100,205.5–1,105,767.9) | 1,403,285.8 (1,400,646.2–1,405,806.0) | 145,689.4 (145,162.8–146,060.8) | 39,056.6 (38,952.3–39,143.1) | 96,979.0 (64,966.6–139,135.0) | 1,312.2 (881.7–1,877.6) | |
| Ethiopia | 1990 | Both sexes | 8,198,618.9 (8,182,482.5–8,212,110.1) | 9,965,301.5 (9,947,862.5–9,981,394.7) | 1,029,148.8 (1,025,599.8–1,032,237.8) | 35,394.7 (35,310.2–35,465.7) | 689,633.3 (462,352.0–988,736.7) | 1,123.9 (755.9–1,611.1) |
| 2013 | Both sexes | 12,346,102.2 (12,319,878.2–12,367,307.2) | 14,391,354.8 (14,344,120.7–14,429,957.3) | 1,279,836.6 (1,274,224.1–1,284,206.9) | 25,605.5 (25,528.1–25,664.4) | 976,830.8 (654,020.4–1,400,903.4) | 808.7 (543.6–1,160.8) | |
| Kenya | 1990 | Both sexes | 3,467,083.1 (3,456,023.7–3,473,930.6) | 4,551,630.0 (4,541,109.6–4,560,967.9) | 426,300.5 (419,237.3–429,835.0) | 30,662.6 (30,571.2–30,735.2) | 309,491.0 (207,176.7–444,967.8) | 1,013.1 (679.2–1,449.6) |
| 2013 | Both sexes | 5,581,201.1 (5,568,201.7–5,590,173.9) | 6,823,546.2 (6,810,630.9–6,836,250.8) | 573,007.7 (562,925.3–577,774.2) | 24,981.1 (24,915.6–25,031.3) | 460,039.2 (308,057.4–664,567.5) | 825.3 (554.1–1,189.2) | |
| Madagascar | 1990 | Both sexes | 2,186,819.1 (2,182,248.0–2,189,586.1) | 2,683,162.4 (2,680,072.6–2,687,594.5) | 281,939.5 (279,682.8–283,219.6) | 41,149.7 (41,083.6–41,217.9) | 185,248.2 (124,457.8–264,359.3) | 1,328.4 (891.6–1,895.7) |
| 2013 | Both sexes | 4,251,781.9 (4,245,259.4–4,256,822.1) | 5,060,968.1 (5,053,547.8–5,067,823.9) | 519,550.4 (513,168.1–521,986.6) | 40,312.2 (40,245.1–40,373.0) | 349,664.5 (234,329.2–501,652.0) | 1,308.3 (878.0–1,873.0) | |
| Malawi | 1990 | Both sexes | 1,556,360.6 (1,550,686.7–1,559,201.9) | 2,227,167.6 (2,223,510.7–2,232,448.0) | 258,813.4 (257,416.6–259,710.6) | 37,321.2 (37,227.3–37,395.7) | 156,410.4 (105,476.1–223,019.6) | 1,295.4 (875.6–1,845.7) |
| 2013 | Both sexes | 2,244,952.4 (2,240,839.6–2,248,006.3) | 3,128,396.2 (3,122,845.9–3,132,304.1) | 317,316.0 (315,086.8–318,451.1) | 29,291.9 (29,220.1–29,344.8) | 215,443.2 (144,151.3–309,387.3) | 1,011.9 (680.1–1,449.3) | |
| Mauritius | 1990 | Both sexes | 143,263.5 (143,014.8–143,499.7) | 131,920.0 (131,664.2–132,172.4) | 9,933.1 (9,868.7–9,990.8) | 26,658.8 (26,614.4–26,701.5) | 8,771.9 (5,805.2–12,699.3) | 798.4 (529.0–1,154.2) |
| 2013 | Both sexes | 122,218.8 (121,843.3–122,559.3) | 99,815.6 (99,321.2–100,149.2) | 6,570.7 (6,528.5–6,604.4) | 19,742.2 (19,675.1–19,788.1) | 6,638.1 (4,402.4–9,661.7) | 595.4 (394.9–867.1) | |
| Mozambique | 1990 | Both sexes | 2,367,555.4 (2,358,588.2–2,375,267.2) | 3,724,324.8 (3,715,669.2–3,734,240.0) | 470,784.9 (469,539.7–473,236.9) | 45,506.1 (45,373.2–45,635.0) | 264,514.9 (178,485.9–375,084.8) | 1,722.6 (1,166.8–2,425.6) |
| 2013 | Both sexes | 3,919,071.8 (3,908,204.8–3,926,410.8) | 5,824,599.1 (5,812,806.2–5,834,376.9) | 621,206.4 (618,518.6–623,285.0) | 36,678.9 (36,568.3–36,772.8) | 400,296.6 (268,618.6–571,773.4) | 1,335.3 (901.4–1,893.5) | |
| Rwanda | 1990 | Both sexes | 1,064,778.7 (1,061,405.6–1,066,954.0) | 1,314,625.0 (1,308,033.5–1,317,672.1) | 115,865.3 (115,113.6–116,344.5) | 29,217.6 (29,127.8–29,286.0) | 88,470.2 (58,923.8–127,375.5) | 926.8 (620.6–1,335.4) |
| 2013 | Both sexes | 1,438,223.3 (1,433,746.8–1,442,369.6) | 1,660,638.2 (1,653,502.0–1,666,580.6) | 132,879.6 (132,106.5–133,478.4) | 23,357.7 (23,255.6–23,449.1) | 111,070.3 (74,343.8–160,274.2) | 744.2 (497.5–1,071.5) | |
| Seychelles | 1990 | Both sexes | 6,862.1 (6,843.3–6,870.7) | 6,964.4 (6,949.9–6,978.0) | 510.1 (506.1–512.6) | 18,856.5 (18,823.1–18,885.8) | 459.3 (305.2–668.2) | 568.2 (376.7–824.6) |
| 2013 | Both sexes | 8,115.5 (8,097.5–8,128.3) | 6,845.0 (6,826.6–6,860.2) | 441.5 (437.9–443.6) | 17,199.4 (17,163.8–17,226.0) | 451.7 (298.9–656.4) | 520.8 (345.3–755.1) | |
| Somalia | 1990 | Both sexes | 962,311.4 (959,531.8–964,477.9) | 1,210,677.6 (1,207,742.3–1,213,519.6) | 111,585.4 (111,090.0–111,894.0) | 30,597.9 (30,514.7–30,674.7) | 81,969.4 (54,806.4–117,948.1) | 1,007.3 (675.7–1,447.3) |
| 2013 | Both sexes | 1,710,982.7 (1,707,722.1–1,713,463.3) | 2,232,257.9 (2,228,865.0–2,235,219.7) | 221,413.1 (220,593.5–222,013.5) | 34,867.0 (34,788.8–34,931.3) | 152,806.1 (102,342.8–219,159.6) | 1,155.5 (777.7–1,658.9) | |
| Tanzania | 1990 | Both sexes | 4,281,259.6 (4,263,001.7–4,294,759.1) | 6,016,615.3 (5,993,548.9–6,026,862.1) | 654,587.3 (651,290.4–657,146.4) | 39,293.6 (39,156.6–39,404.5) | 417,066.0 (280,073.6–596,295.4) | 1,380.6 (928.6–1,967.8) |
| 2013 | Both sexes | 7,064,406.9 (7,046,944.4–7,077,001.6) | 9,550,905.6 (9,532,977.9–9,567,514.5) | 911,190.6 (902,162.4–917,890.2) | 31,336.7 (31,251.3–31,403.0) | 650,796.7 (434,744.3–934,844.1) | 1,085.2 (727.2–1,557.2) | |
| Uganda | 1990 | Both sexes | 2,674,331.3 (2,669,159.7–2,678,320.8) | 3,684,123.2 (3,678,990.6–3,688,268.7) | 371,886.5 (370,124.9–373,116.6) | 32,727.5 (32,658.3–32,785.4) | 250,643.5 (168,287.2–359,650.6) | 1,096.0 (737.4–1,569.6) |
| 2013 | Both sexes | 5,022,958.1 (5,013,564.5–5,030,552.9) | 6,857,498.7 (6,846,117.2–6,867,443.8) | 631,526.6 (628,596.5–633,492.1) | 27,171.7 (27,107.1–27,225.5) | 463,214.4 (309,845.2–665,649.6) | 915.3 (614.0–1,312.5) | |
| Zambia | 1990 | Both sexes | 1,139,897.6 (1,137,134.3–1,141,902.6) | 1,448,661.0 (1,445,696.4–1,452,522.6) | 132,446.1 (129,112.5–133,598.4) | 29,838.7 (29,758.0–29,910.1) | 98,189.4 (65,792.1–140,945.0) | 979.3 (654.5–1,402.7) |
| 2013 | Both sexes | 1,945,537.2 (1,942,028.3–1,948,030.1) | 2,468,995.7 (2,464,604.3–2,473,831.5) | 215,028.7 (209,607.9–216,686.0) | 26,310.8 (26,252.3–26,360.0) | 166,319.6 (111,335.1–239,990.5) | 864.4 (579.0–1,241.6) | |
| Southern Sub-Saharan Africa | 1990 | Both sexes | 8,084,397.0 (8,066,636.0–8,102,575.2) | 8,875,349.5 (8,854,795.7–8,889,088.0) | 750,356.3 (748,530.1–753,620.2) | 31,269.4 (31,186.3–31,336.0) | 599,500.4 (401,004.9–861,736.8) | 993.4 (668.4–1,425.3) |
| 2013 | Both sexes | 10,130,466.8 (10,106,789.3–10,150,394.3) | 10,262,962.4 (10,242,246.8–10,283,157.9) | 805,802.3 (803,807.1–807,437.8) | 27,402.2 (27,343.2–27,455.8) | 692,461.9 (462,410.4–997,765.0) | 870.5 (582.3–1,252.0) | |
| Botswana | 1990 | Both sexes | 226,680.0 (226,133.0–227,277.1) | 264,809.9 (264,083.0–265,269.7) | 23,562.4 (23,436.6–23,659.6) | 34,274.1 (34,168.6–34,356.1) | 17,947.9 (11,981.3–25,841.3) | 1,096.3 (733.2–1,577.8) |
| 2013 | Both sexes | 265,222.1 (263,649.2–266,112.6) | 272,007.6 (269,245.3–273,039.5) | 21,256.1 (21,013.0–21,365.4) | 26,493.2 (26,307.7–26,585.4) | 18,279.5 (12,241.9–26,485.6) | 833.8 (559.7–1,203.5) | |
| Lesotho | 1990 | Both sexes | 246,146.8 (245,534.1–246,815.4) | 277,692.5 (277,062.3–278,191.8) | 23,562.1 (23,414.1–23,752.2) | 31,398.4 (31,301.6–31,488.3) | 18,753.4 (12,540.9–26,961.9) | 991.8 (665.4–1,427.9) |
| 2013 | Both sexes | 276,709.2 (275,821.4–277,484.4) | 288,115.6 (287,324.3–288,755.9) | 22,823.3 (22,721.2–22,884.3) | 26,936.8 (26,844.8–27,015.7) | 19,389.7 (12,967.5–27,972.0) | 845.5 (568.3–1,217.8) | |
| Namibia | 1990 | Both sexes | 256,951.8 (256,329.2–257,635.4) | 300,285.7 (299,166.6–300,817.8) | 28,105.9 (28,002.1–28,199.7) | 39,023.2 (38,893.2–39,118.9) | 20,468.3 (13,705.2–29,565.2) | 1,261.5 (846.1–1,812.8) |
| 2013 | Both sexes | 357,032.6 (353,857.8–358,035.8) | 379,892.3 (375,656.5–381,076.0) | 31,801.3 (31,424.0–31,950.1) | 31,991.5 (31,655.3–32,090.7) | 25,655.5 (17,125.2–37,047.1) | 1,016.6 (679.2–1,462.3) | |
| South Africa | 1990 | Both sexes | 5,682,151.8 (5,666,420.2–5,700,148.2) | 6,014,717.2 (5,994,831.5–6,026,629.4) | 499,867.2 (498,138.1–503,100.9) | 31,222.3 (31,114.2–31,303.4) | 406,723.4 (272,468.7–583,883.1) | 989.9 (667.3–1,418.4) |
| 2013 | Both sexes | 6,950,168.0 (6,927,801.6–6,967,705.0) | 6,747,397.7 (6,728,770.0–6,765,971.4) | 509,446.5 (507,553.7–510,758.4) | 26,420.0 (26,341.8–26,483.9) | 455,557.2 (304,850.4–655,797.0) | 835.5 (559.8–1,200.8) | |
| Swaziland | 1990 | Both sexes | 131,652.9 (131,314.9–131,940.1) | 153,862.5 (153,553.5–154,169.9) | 12,939.1 (12,902.0–12,964.4) | 30,979.3 (30,898.8–31,052.3) | 10,306.8 (6,883.8–14,808.1) | 979.1 (655.8–1,409.2) |
| 2013 | Both sexes | 172,408.5 (171,864.2–172,841.0) | 182,248.3 (181,796.2–182,652.3) | 14,496.4 (14,444.8–14,535.0) | 27,657.8 (27,569.6–27,733.8) | 12,182.5 (8,125.6–17,516.4) | 865.3 (578.0–1,245.0) | |
| Zimbabwe | 1990 | Both sexes | 1,540,813.8 (1,536,731.4–1,543,768.4) | 1,863,981.7 (1,860,777.2–1,868,069.7) | 162,319.6 (161,767.0–162,754.3) | 29,871.3 (29,801.9–29,934.6) | 125,300.5 (83,902.3–181,120.9) | 952.5 (640.1–1,372.0) |
| 2013 | Both sexes | 2,108,926.4 (2,104,150.5–2,113,051.0) | 2,393,300.9 (2,388,101.4–2,397,725.8) | 205,978.6 (205,073.2–206,572.9) | 30,841.6 (30,759.5–30,911.6) | 161,397.4 (107,643.0–232,420.1) | 987.2 (663.0–1,421.1) | |
| Western Sub-Saharan Africa | 1990 | Both sexes | 39,535,487.7 (39,389,009.1–39,593,152.3) | 55,952,573.2 (55,863,047.5–56,072,319.8) | 7,445,572.8 (7,365,220.9–7,482,216.4) | 49,491.5 (49,397.5–49,569.0) | 4,072,355.8 (2,757,081.4–5,773,071.0) | 1,779.5 (1,207.3–2,522.1) |
| 2013 | Both sexes | 67,578,594.1 (67,485,042.9–67,677,190.7) | 90,925,028.7 (90,799,139.9–91,037,378.8) | 10,967,931.2 (10,845,694.1–11,021,409.1) | 43,211.4 (43,146.1–43,267.4) | 6,514,886.5 (4,380,919.3–9,270,522.5) | 1,511.0 (1,019.0–2,150.8) | |
| Benin | 1990 | Both sexes | 1,003,490.2 (993,515.2–1,007,637.1) | 1,561,972.5 (1,557,504.2–1,578,579.4) | 226,352.8 (223,482.1–227,876.8) | 54,270.9 (54,017.9–54,596.1) | 115,730.5 (78,450.2–163,619.0) | 2,094.2 (1,429.3–2,943.5) |
| 2013 | Both sexes | 1,923,823.4 (1,918,283.1–1,930,627.6) | 2,762,803.6 (2,755,703.0–2,768,702.5) | 350,170.3 (344,445.7–353,411.0) | 46,838.1 (46,709.2–46,956.1) | 199,898.1 (134,885.0–283,911.4) | 1,738.6 (1,178.7–2,467.8) | |
| Burkina Faso | 1990 | Both sexes | 1,637,745.3 (1,627,374.9–1,643,764.2) | 2,562,085.4 (2,556,425.4–2,570,467.7) | 446,957.9 (443,054.6–448,984.7) | 48,944.7 (48,777.7–49,087.2) | 200,357.3 (135,649.2–282,741.8) | 1,833.3 (1,244.6–2,585.8) |
| 2013 | Both sexes | 3,008,005.4 (3,000,999.8–3,017,184.9) | 4,536,585.5 (4,528,457.9–4,543,539.9) | 739,159.3 (729,942.6–743,467.3) | 44,719.5 (44,610.3–44,817.7) | 350,766.7 (236,259.5–498,594.9) | 1,660.3 (1,119.0–2,351.7) | |
| Cameroon | 1990 | Both sexes | 2,148,273.8 (2,139,482.9–2,152,234.0) | 2,832,292.1 (2,826,925.0–2,846,002.5) | 302,233.9 (295,472.7–304,842.5) | 39,656.5 (39,540.5–39,757.9) | 196,372.4 (131,913.0–280,108.9) | 1,332.2 (898.9–1,900.7) |
| 2013 | Both sexes | 3,712,200.4 (3,704,311.5–3,719,067.3) | 4,693,449.8 (4,683,856.6–4,702,688.3) | 474,327.9 (463,502.7–477,604.8) | 36,418.0 (36,334.8–36,489.1) | 324,303.9 (217,101.6–465,589.3) | 1,215.8 (817.3–1,741.4) | |
| Cape Verde | 1990 | Both sexes | 59,152.3 (59,022.8–59,279.2) | 79,926.2 (79,776.8–80,052.8) | 8,495.5 (8,456.1–8,518.4) | 37,428.9 (37,329.0–37,520.3) | 5,565.9 (3,737.4–7,986.2) | 1,284.5 (862.9–1,842.8) |
| 2013 | Both sexes | 71,244.9 (70,990.6–71,448.2) | 78,758.2 (78,554.7–78,968.3) | 7,093.2 (7,045.0–7,124.2) | 30,906.5 (30,805.2–30,997.9) | 5,410.4 (3,614.7–7,785.8) | 1,042.3 (697.7–1,500.7) | |
| Chad | 1990 | Both sexes | 1,265,612.5 (1,262,472.0–1,268,407.9) | 1,859,515.9 (1,856,059.8–1,862,193.3) | 267,547.0 (266,307.4–268,394.9) | 54,259.1 (54,135.7–54,354.0) | 136,824.9 (92,602.1–193,969.7) | 1,951.9 (1,321.5–2,768.5) |
| 2013 | Both sexes | 2,512,955.0 (2,508,217.7–2,516,475.3) | 3,484,962.4 (3,481,038.2–3,489,370.3) | 438,277.5 (434,239.1–439,831.5) | 46,145.7 (46,039.3–46,237.5) | 249,585.1 (168,060.2–355,683.8) | 1,570.4 (1,056.4–2,243.6) | |
| Cote d’Ivoire | 1990 | Both sexes | 2,326,223.1 (2,314,114.3–2,330,805.6) | 3,089,841.4 (3,084,532.2–3,095,408.1) | 360,151.6 (356,606.6–362,849.7) | 44,929.1 (44,783.3–45,020.6) | 217,367.8 (146,239.6–309,431.0) | 1,537.6 (1,038.8–2,179.2) |
| 2013 | Both sexes | 3,946,362.7 (3,939,229.0–3,951,968.7) | 5,120,818.9 (5,113,261.2–5,128,039.2) | 592,974.7 (587,927.9–596,871.4) | 45,349.6 (45,264.6–45,430.6) | 361,129.8 (242,419.8–515,732.1) | 1,567.1 (1,055.8–2,229.9) | |
| The Gambia | 1990 | Both sexes | 173,164.9 (172,737.8–173,627.9) | 237,681.9 (236,867.7–238,278.9) | 28,752.1 (28,352.7–28,961.4) | 44,513.9 (44,400.4–44,615.7) | 16,928.6 (11,391.9–24,109.7) | 1,536.2 (1,039.0–2,187.2) |
| 2013 | Both sexes | 316,269.5 (315,452.2–316,883.5) | 426,480.9 (425,411.9–427,312.1) | 46,576.7 (46,060.5–46,891.0) | 38,172.8 (38,077.6–38,258.0) | 29,840.8 (20,055.2–42,679.6) | 1,300.9 (877.9–1,864.1) | |
| Ghana | 1990 | Both sexes | 2,883,315.6 (2,867,917.5–2,893,662.0) | 3,978,759.5 (3,969,198.4–3,991,512.9) | 491,610.1 (483,817.0–495,789.7) | 48,437.4 (48,262.9–48,576.9) | 284,955.9 (191,474.9–405,574.3) | 1,737.1 (1,171.7–2,472.1) |
| 2013 | Both sexes | 4,464,871.4 (4,452,603.4–4,476,976.3) | 5,654,548.8 (5,641,057.9–5,666,481.6) | 597,041.8 (584,224.0–603,175.5) | 39,618.8 (39,522.0–39,700.4) | 395,770.0 (265,595.7–566,790.0) | 1,379.9 (928.1–1,971.9) | |
| Guinea | 1990 | Both sexes | 1,115,115.5 (1,112,367.2–1,117,904.8) | 1,580,914.7 (1,577,304.0–1,583,896.2) | 207,966.6 (205,289.1–209,420.6) | 44,856.3 (44,732.7–44,963.8) | 114,436.3 (77,255.8–162,798.0) | 1,596.4 (1,079.3–2,267.3) |
| 2013 | Both sexes | 2,063,617.6 (2,059,363.9–2,067,079.6) | 2,831,922.3 (2,826,432.4–2,837,177.6) | 347,962.9 (343,036.8–350,632.2) | 41,519.4 (41,420.3–41,614.2) | 203,216.8 (136,864.2–289,421.8) | 1,467.7 (988.9–2,089.4) | |
| Guinea-Bissau | 1990 | Both sexes | 199,645.9 (199,094.1–200,283.5) | 273,175.8 (272,168.9–273,868.8) | 33,644.5 (33,399.0–33,828.8) | 46,612.2 (46,476.1–46,738.5) | 19,446.2 (13,088.2–27,674.8) | 1,623.9 (1,098.5–2,308.9) |
| 2013 | Both sexes | 311,750.3 (311,092.2–312,319.8) | 404,191.0 (403,464.5–405,180.7) | 45,642.8 (45,370.0–45,886.0) | 42,078.4 (41,994.0–42,166.3) | 28,361.4 (19,058.1–40,608.6) | 1,438.7 (970.1–2,054.5) | |
| Liberia | 1990 | Both sexes | 388,961.5 (387,750.0–389,524.7) | 526,492.7 (525,779.2–527,539.4) | 59,911.1 (59,458.6–60,228.9) | 41,599.3 (41,520.7–41,668.6) | 36,709.7 (24,723.3–52,370.3) | 1,407.3 (950.8–2,008.9) |
| 2013 | Both sexes | 800,614.5 (799,083.6–801,639.2) | 1,057,385.1 (1,055,914.1–1,058,648.2) | 122,350.9 (121,568.2–123,005.0) | 43,622.3 (43,541.4–43,690.5) | 74,175.8 (49,927.8–105,715.3) | 1,488.4 (1,007.9–2,120.8) | |
| Mali | 1990 | Both sexes | 1,635,217.2 (1,631,233.6–1,640,824.9) | 2,622,107.1 (2,615,680.3–2,626,592.6) | 412,636.5 (408,389.9–414,736.7) | 56,888.1 (56,739.9–57,035.8) | 197,571.1 (133,778.7–280,118.9) | 2,215.4 (1,510.1–3,114.3) |
| 2013 | Both sexes | 2,970,336.5 (2,964,442.2–2,975,651.6) | 4,600,133.5 (4,593,957.6–4,607,090.9) | 661,505.4 (650,996.6–665,559.6) | 51,061.1 (50,959.9–51,148.6) | 340,960.6 (230,706.1–484,593.7) | 1,925.0 (1,305.6–2,724.5) | |
| Mauritania | 1990 | Both sexes | 437,090.3 (435,130.5–438,363.9) | 651,878.1 (650,323.7–652,918.5) | 94,978.7 (94,590.5–95,252.3) | 56,869.3 (56,663.7–57,000.1) | 48,038.4 (32,448.0–68,215.1) | 2,122.9 (1,440.5–2,995.4) |
| 2013 | Both sexes | 714,899.7 (713,012.4–716,203.3) | 913,333.2 (911,724.6–914,980.1) | 102,762.8 (101,958.9–103,174.1) | 41,880.0 (41,788.4–41,964.5) | 64,189.6 (43,103.2–91,722.5) | 1,435.8 (966.5–2,045.5) | |
| Niger | 1990 | Both sexes | 1,431,966.4 (1,428,838.0–1,434,936.4) | 2,053,472.9 (2,049,899.1–2,057,578.5) | 264,513.2 (260,753.5–266,736.2) | 43,828.7 (43,704.5–43,933.0) | 148,586.3 (100,130.5–211,361.3) | 1,534.2 (1,039.5–2,184.8) |
| 2013 | Both sexes | 3,191,938.3 (3,183,289.2–3,197,712.1) | 4,604,933.5 (4,598,174.5–4,612,175.8) | 580,984.2 (571,605.3–585,505.0) | 41,884.0 (41,786.2–41,967.6) | 332,567.0 (223,813.7–472,318.9) | 1,454.7 (977.2–2,081.1) | |
| Nigeria | 1990 | Both sexes | 19,757,353.4 (19,607,643.9–19,807,358.1) | 27,729,298.0 (27,654,491.7–27,835,401.3) | 3,690,950.7 (3,615,311.5–3,722,728.9) | 51,349.4 (51,168.3–51,494.8) | 2,022,908.9 (1,370,837.6–2,865,970.5) | 1,849.3 (1,258.4–2,622.8) |
| 2013 | Both sexes | 32,301,981.3 (32,227,249.7–32,383,902.1) | 42,691,792.8 (42,590,056.8–42,780,663.6) | 5,008,707.9 (4,899,840.3–5,053,751.8) | 43,082.9 (42,972.7–43,172.4) | 3,049,358.5 (2,056,420.3–4,342,622.1) | 1,489.3 (1,005.8–2,117.2) | |
| Sao Tome and Principe | 1990 | Both sexes | 20,786.3 (20,734.5–20,832.7) | 27,396.8 (27,337.2–27,477.1) | 2,882.0 (2,816.4–2,908.2) | 40,216.6 (40,109.9–40,320.8) | 1,907.5 (1,279.1–2,734.7) | 1,345.7 (902.9–1,924.1) |
| 2013 | Both sexes | 33,304.7 (33,227.5–33,377.3) | 40,415.0 (40,335.3–40,499.0) | 4,009.4 (3,926.6–4,048.9) | 37,374.1 (37,278.6–37,461.2) | 2,804.5 (1,882.3–4,032.1) | 1,243.1 (833.9–1,781.5) | |
| Senegal | 1990 | Both sexes | 1,492,171.5 (1,488,896.4–1,496,807.7) | 2,208,881.9 (2,203,280.2–2,212,695.0) | 298,790.8 (295,886.2–300,296.4) | 51,051.5 (50,932.5–51,159.7) | 160,976.9 (108,874.0–228,501.7) | 1,873.9 (1,268.7–2,659.8) |
| 2013 | Both sexes | 2,723,141.6 (2,716,770.1–2,727,746.0) | 3,844,384.4 (3,837,846.0–3,850,356.5) | 485,811.1 (481,085.2–489,249.4) | 47,777.9 (47,672.2–47,865.7) | 276,651.1 (186,001.5–393,735.7) | 1,732.3 (1,169.1–2,458.5) | |
| Sierra Leone | 1990 | Both sexes | 833,945.4 (831,340.8–835,856.9) | 1,074,627.0 (1,071,854.0–1,078,084.2) | 125,437.6 (122,359.6–126,685.4) | 48,202.3 (48,085.5–48,309.3) | 75,988.9 (51,305.2–108,313.4) | 1,636.6 (1,110.1–2,324.4) |
| 2013 | Both sexes | 1,222,298.5 (1,219,209.9–1,225,080.9) | 1,492,621.6 (1,488,829.4–1,496,050.5) | 164,960.2 (161,588.4–166,503.9) | 45,042.5 (44,913.3–45,144.2) | 105,445.4 (70,870.0–150,542.5) | 1,515.6 (1,020.4–2,166.4) | |
| Togo | 1990 | Both sexes | 725,096.6 (723,464.8–726,707.1) | 1,000,864.6 (998,552.4–1,003,849.5) | 121,590.7 (119,054.0–122,829.7) | 45,732.7 (45,602.2–45,845.1) | 71,582.5 (48,074.3–101,786.4) | 1,599.7 (1,080.9–2,279.4) |
| 2013 | Both sexes | 1,288,163.2 (1,284,874.9–1,290,950.5) | 1,684,683.5 (1,681,289.3–1,688,516.1) | 197,525.0 (193,373.5–199,260.5) | 44,162.2 (44,058.3–44,252.1) | 120,392.9 (81,063.7–171,463.9) | 1,543.1 (1,040.3–2,193.7) | |
| South Sudan | 1990 | Both sexes | 1,051,345.7 (1,048,922.0–1,053,905.4) | 1,348,468.0 (1,345,389.1–1,350,605.0) | 142,898.8 (142,234.3–143,419.9) | 39,987.9 (39,876.7–40,085.2) | 93,017.5 (62,447.8–133,264.6) | 1,327.8 (894.9–1,898.2) |
| 2013 | Both sexes | 1,688,384.0 (1,683,930.7–1,691,763.1) | 2,078,583.1 (2,074,293.3–2,082,367.0) | 193,762.9 (192,719.3–194,601.1) | 31,743.1 (31,651.0–31,814.5) | 140,990.0 (94,126.6–202,333.0) | 1,039.0 (695.9–1,487.3) | |
| Sudan | 1990 | Both sexes | 4,349,963.0 (4,340,284.9–4,358,298.3) | 5,481,366.5 (5,471,676.1–5,488,896.5) | 612,388.4 (610,225.0–615,256.7) | 51,743.8 (51,658.7–51,818.9) | 379,228.5 (254,667.2–542,773.6) | 1,742.4 (1,177.5–2,482.8) |
| 2013 | Both sexes | 7,442,698.0 (7,433,356.2–7,451,250.1) | 8,340,593.8 (8,329,840.9–8,350,242.2) | 802,225.3 (798,474.7–804,918.7) | 42,614.1 (42,559.0–42,667.0) | 564,922.2 (377,719.4–813,976.9) | 1,347.1 (901.2–1,935.0) |
Related posts:
 Sickle Cell Disease in Sub-Saharan Africa
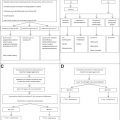 Hematological Practice in India
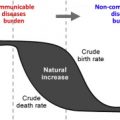 The Present and Future Global Burden of the Inherited Disorders of Hemoglobin
 Introduction: The Complexity and Challenge of Preventing, Treating, and Managing Blood Diseases in the Developing Countries
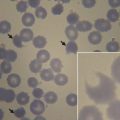 Glucose-6-Phosphate Dehydrogenase Deficiency
Improving Laboratory and Clinical Hematology Services in Resource Limited Settings
Glucose-6-Phosphate Dehydrogenase Deficiency
Improving Laboratory and Clinical Hematology Services in Resource Limited Settings
Stay updated, free articles. Join our Telegram channel

Full access? Get Clinical Tree


