The Geriatric Patient: Demography, Epidemiology, and Health Services Utilization: Introduction
From the physician’s perspective, the demographic curve strongly argues that medical practice in the future will include a growing number of older adults. Today persons age 65 years and older currently represent a little more than one-third of the patients seen by a primary care physician; in 40 years, we can safely predict that at least every other adult patient will age 65 or older. The “old-old” (older than 85), however, are the most rapidly growing group of older individuals, with a growth rate twice that of those age 65 years and older and four times that of the total population. This group now represents approximately 10% of the older population and is anticipated to grow from 5.7 million in 2010 to over 19 million by 2050 (Day, 1993). Among this old-old group those age 90 and above will show the steepest population rise (Federal Interagency Forum on Aging-Related Statistics, 2010). People in this old-old group tend to have poorer physical activity, be more dependent in activities of daily living, and have more cognitive impairment (Zhao et al., 2010).
The concern so often heard about the epidemic of aging stems primarily from two factors: numbers and dollars. We hear a great deal of talk about the incipient demise of Social Security, the bankrupt status of Medicare, the death of the family as a social institution, and dire predictions of demographic cataclysms. There is, indeed, cause for concern but not necessarily for alarm. The message of the numbers is straightforward: we cannot go on as we have; new approaches are needed. The shape of those approaches to meeting the needs of growing numbers of elderly persons in this society will reflect societal values. The costs associated with an aging society have already stimulated major changes in the way we provide care.
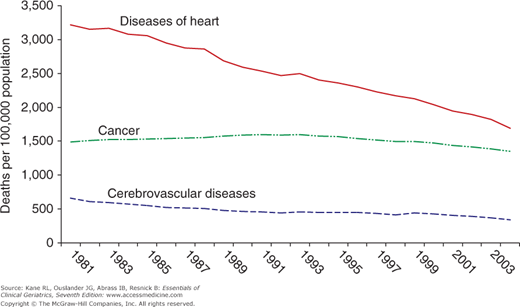
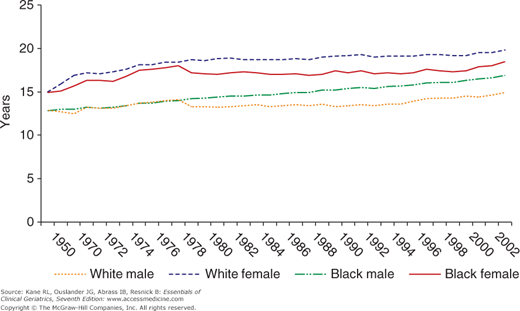
There is actually some basis for optimism. Data from the National Long-Term Care Survey show a decline in the rate of disability among older people. Overall, the rate of disability among older persons has decreased by 1% or more annually for the last several decades. However, the growth in the aging population more than offsets this gain. The number of disabled persons age 65 years and older in 1982 was 6.4 million. It increased to 7 million in 1994, and in 1999, the projected level of disability applied to population projections called for was about 9.3 million. It remains to be seen whether this trend toward lower disability rates can be sustained, but if so, it will greatly offset the effects of an aging population. Death rates from major killers have been falling in some areas. As seen in Figure 2-1, death in older men from heart disease has dropped precipitously, while death from cerebrovascular disease has declined somewhat, but death from cancer overall has not changed much. The pattern for women is very similar. Life expectancy at age 65 continues to increase for both men and women, and the gender gap is narrowing (Fig. 2-2). However, the obesity epidemic we now face may alter longevity among current adults. In a recent study, for example, obesity reduced U.S. life expectancy at age 50 years by 1.5 years for women and by 1.9 years for men (Preston and Stokes, 2011). Similarly, the number of patients with type 2 diabetes is increasing rapidly, which is known to be associated with premature death (van Dieren et al., 2010). Consequently, life expectancy in the United States is anticipated to drop lower than that experienced in other countries. Global excess mortality attributable to diabetes in adults was estimated to be 3.8 million deaths.
However, aging is not the only contributor to the rapidly escalating costs of care. Although older people use a disproportionately large amount of medical care, most of the growth in costs is traceable to tremendous expansion in medical technology, both diagnostic and therapeutic. We have potent, but often expensive tools at our disposal. In some ways, we can be said to be reaping the fruits of our success. While a substantial number of older people live to enjoy many active years, some persons who might not have survived in earlier times are now living into old age and bringing with them the chronic disease burden that would have been avoided by death.
The Patient Protection and Affordable Care Act (PPACA) and the Reconciliation Act contain provisions designed to reduce Medicare program costs by approximately $390 billion over the next 10 years through adjustments in payments to certain types of providers, by equalizing payment rates between Medicare Advantage and fee-for-service Medicare, and by increasing efficiencies in the way that health services are paid for and delivered. Medical practices and other organizations are changing in response to the PPACA and developing into patient-centered medical homes or accountable care organizations.
It is not clear exactly what changes in health care will be implemented. It is, however, an exciting time for geriatricians and other members of the health-care profession as we rethink how care is provided to best meet the needs of an aging America. Increasingly, there will be an emphasis on quality versus quantity of life. Older adults and their caregivers will be looking to geriatricians to help them with decisions about screening practices, such as when to stop going for mammography, as well as treatment decisions, such as whether or not to undergo cancer treatment or invasive surgical interventions.
Growth in Numbers
A look at a few trends will help to focus the problem. The numbers of older people in this country (and in the world) have been growing in both absolute and relative terms. The growth in numbers can be traced to two phenomena: (1) the advances in medical science that have improved survival rates from specific diseases and (2) the birth rate. The relative numbers of older persons is primarily the result of two birth rates: (1) the one that occurred 65 or more years ago and (2) the current one. The first one provides the people, most of whom will survive, to become old. The second means that the proportion of those who are old depends on how many were born subsequently. This ratio is critical in estimating the size of the workforce available to support an elderly population. The looming demographic crisis is based on the forecast of a large number of older persons increasing through the first half of the next century as a result of the post–World War II baby boom. That group of people, born in the late 1940s and early 1950s, will begin to reach seniority by 2010. The relative rate of growth increases with each decade over age 75 years. Indeed, many older persons are now surviving longer. It is no longer rare to encounter a centenarian. In fact, the United States currently has the greatest number of centenarians of any nation, estimated at 70,490 on September 1, 2010 (Census Data, 2010). This corresponds to a national incidence of one centenarian per 4400 people.
The impact of this projection can be better appreciated by looking at Table 2–1, which expresses the growth as a percentage of the total population. Although these forecasts can vary with the future birth and death rates, they are likely to be reasonably accurate. Thus, since the turn of the twentieth century, we have gone from a situation in which 4% of the population was age 65 or older to a time when more than 12% has reached 65 years. By the year 2030, that older population will have almost doubled. Put another way, in 2030, there will be as many people older than 75 years as there are today who are older than 65 years. When that observation is combined with the reduction in births in the cohort behind the baby boomers, the social implications become more obvious. There will be fewer workers to support the larger older population. This demographic observation has led to several urgent recommendations: (1) redefine retirement age to recognize the increase in life expectancy and thereby reduce the ratio of retirees to workers; (2) encourage younger persons to personally save more for their retirement to avoid excessive dependency on public funds; (3) encourage volunteerism among older adults to augment services in libraries, health-care facilities, and schools as well as provide professional services (von Bonsdorff and Rantanen, 2011); and (4) change public programs to address the needs of an aging society.
Percentage of the total population | |||||||
|---|---|---|---|---|---|---|---|
Age (years) | 1900 | 1940 | 1960 | 1990 | 2010 | 2030 | 2050 |
65-74 | 2.9 | 4.8 | 6.1 | 7.3 | 7.4 | 12.0 | 10.5 |
75-84 | 1.0 | 1.7 | 2.6 | 4.0 | 4.3 | 7.1 | 7.2 |
85+ | 0.2 | 0.3 | 0.5 | 1.3 | 2.2 | 2.7 | 5.1 |
65+ | 4.0 | 6.8 | 9.2 | 12.6 | 13.9 | 21.8 | 22.9 |
Because older people use more health-care services than do younger people, there will be an even greater demand on the health-care system and a concomitant rise in total health-care costs. Because Medicare beneficiaries use more institutional services (ie, hospital and nursing home care), their health-care costs are higher than those for younger groups. Only 12% of the population, those age 65 years and older, accounts for over one-third of health expenditures.
As seen in Table 2–2, health expenditures increase substantially with disability. However, the rate of increase has been greater among those with less disability.
Limitations | 1992 | 2003 | % Change 1992-2003 |
|---|---|---|---|
None | $4,257 | $6,683 | 57% |
Physical limitation only | $4,954 | $7,639 | 54% |
IADL | $8,243 | $11,669 | 42% |
1-2 ADLs | $10,533 | $14,573 | 38% |
3-6 ADLs | $24,368 | $29,433 | 21% |
The growth in the number of aged persons reflects improvements in both social living conditions and medical care. Over the course of this century, we have moved from a preponderance of acute diseases (especially infections) to an era of chronic illnesses. Today at least two-thirds of all the money spent on health care goes toward chronic disease. (For older people that proportion is closer to 95%.) Changes in the health-care system proposed within the PPACA are facilitating an increased focus on chronic care and management of not only single but multiple chronic illnesses (Boult and Wieland, 2010). Table 2–3 reflects the changes in the common causes of death from 1900 to 2002 (Anderson and Smith, 2005). Many of those common at the turn of the twentieth century are no longer even listed. Today, the pattern of death in old age is generally similar to that of the population as a whole. The leading causes are basically the same, but there are some differences in the rankings. The leading causes of death are heart disease, cancer, stroke, chronic obstructive pulmonary disease, and influenza/pneumonia. Alzheimer disease features prominently.
Rate per 100,000 | ||||||
|---|---|---|---|---|---|---|
All ages | Age 65+ | |||||
1900 | Rank | 2002 | Rank | 2000 | Rank | |
Diseases of heart | 13.8 | 4 | 847 | 1 | 1677 | 1 |
Malignant neoplasms | 6.4 | 8 | 193 | 1311 | ||
Cerebrovascular diseases | 10.7 | 5 | 56 | 2 | 431 | 2 |
Chronic lower respiratory diseases | 4.5 | 9 | 43 | 386 | 3 | |
Influenza and pneumonia | 22.9 | 1 | 23 | 154 | 5 | |
Diabetes mellitus | 1.1 | 25 | 5 | 183 | ||
Alzheimer disease | 20 | 6 | 158 | 4 | ||
Nephritis, nephritic syndrome, and nephrosis | 8.9 | 6 | 14 | 7 | 109 | 7 |
Accidents | 7.2 | 7 | 37 | 101 | 8 | |
Septicemia | 12 | 8 | 86 | 9 | ||
Other | 181 | 9 | 955 | 10 | ||
Although the most dramatic reduction of mortality has occurred in infants and mothers, there has been a perceptible increase in survival even after age 65. Our stereotypes of what to expect from older people may therefore need reexamination. The average 65-year-old woman can expect to live another 19.2 years and a 65-year-old man another 16.3 years. Even at age 85, there is an expectation of more than 5 years.
However, this gain in survival includes both active and dependent years. Indeed, one of the great controversies of modern gerontological epidemiology is whether the gain in life expectancy brings with it equivalent gains in years free of dependency. The answer lies somewhere between. Although increased survival may be associated with more disability, the overall effect has been a pattern of decreasing disability (Cutler, 2001). Moreover, not all disability is permanent. Some older people experience transient episodes.
Some analysts have used disability as the basis for defining quality of life. They have then seized on the concept of active life expectancy to create a concept of quality-adjusted life-years (QALYs). Under this formulation, which is especially popular with economists who are seeking a common denominator against which to weigh all interventions, the goal of health care is to maximize individuals’ periods of disability-free time. However, such a formulation immediately raises concerns about the care of all those who are already frail; they would derive no benefit from any actions on their behalf unless they could convert them to a disability-free state.
