Highlights
- •
The median FI of a/mRCC was 12.5, which implied that the trial outcomes would be reversed due to event changes in 13 patients.
- •
P -values were negatively associated with the FI.
- •
FI should be added as a supplement to the P -value to evaluate the robustness of the outcomes.
Abstract
Purpose
The fragility index (FI) has been applied as a supplement to the noncomprehensive P -values to assess the robustness of randomized controlled trials (RCTs). The objective of this study is to evaluate the statistical robustness of RCTs of advanced/metastatic renal cell cancer (a/mRCC) using the FI.
Materials and methods
RCTs related to a/mRCC published in the 4 highest-impact general medical journals and the 25 highest-impact urological journals between January 1, 2000, and December 31, 2023, were identified from PubMed database. The FI was calculated by using Fisher’s exact test. Spearman’s correlation analysis was conducted to assess potential correlates regarding FI.
Results
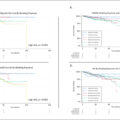
16 eligible RCTs were screened with a median total sample size of 654.5 (IQR, 461–847) and a median patients lost to follow-up of 14 (IQR, 3–23). The median FI was 12.5 (IQR, 8.5–27), suggesting that a switch in outcomes in only 13 patients would have reversed the significance of the trials. The number of patients lost to follow-up exceeded or equaled to the FI in 7 (44%) RCTs. P -values were negatively associated with the FI, while the number of patients lost to follow-up and patients enrolled were not statistically significant.
Conclusion
Not all RCTs associated with a/mRCC are as statistically robust as previously considered and should therefore be construed carefully. We suggest that additional reporting of FI in urological RCTs as a supplement to the P -value to assist readers in concluding reliably by considering the fragility of the outcomes.
1
Introduction
Renal cell carcinoma (RCC) is one of the 3 most common urological malignancies, representing nearly 90% of all malignant renal tumors [ ]. Statistics from a global cancer survey in 2020 showed that the incidence and mortality of kidney cancer were 431,288 and 179,368, respectively [ ]. Besides surgery, embolization, surveillance and ablative therapy in localized RCC, systemic treatments for advanced/metastatic renal cell cancer (a/mRCC) including surgery combined with adjuvant, targeted or immunotherapy are recommended [ ]. Nevertheless, no consensus has yet been reached [ ]. The choice of treatment protocol was typically determined by the clinicians or directed by evidence-based medicine (EBM). EBM highlights the significance of the outcomes of randomized controlled trials (RCTs) in steering therapeutic decisions, which were considered as the gold standard for the comparison of clinical interventions.
RCTs, which are assumed to provide highly reliable evidence if proper methods are administered, are aimed at evaluating the safety and efficacy of interventions. P < 0.05 has been conventionally applied to recognize whether there is a difference between interventions in RCTs [ ]. Clinicians regularly depend on the P -values presented to explain outcomes and to confirm the significance of RCTs. Nevertheless, the threshold P -value has been heavily critiqued as an excessively straightforward concept in establishing statistical significance [ ]. The outcomes may be sharply reversed due to minor differences in P -values once the P -values are distributed exactly on the left and right sides around the thresholds. For example, one is 0.049 and the other is 0.051. Moreover, any P -value within the threshold is called “statistically significant” regardless of the size of the P -value. Consequently, there are limitations to relying on P -values alone to determine the differences of outcomes in trials.
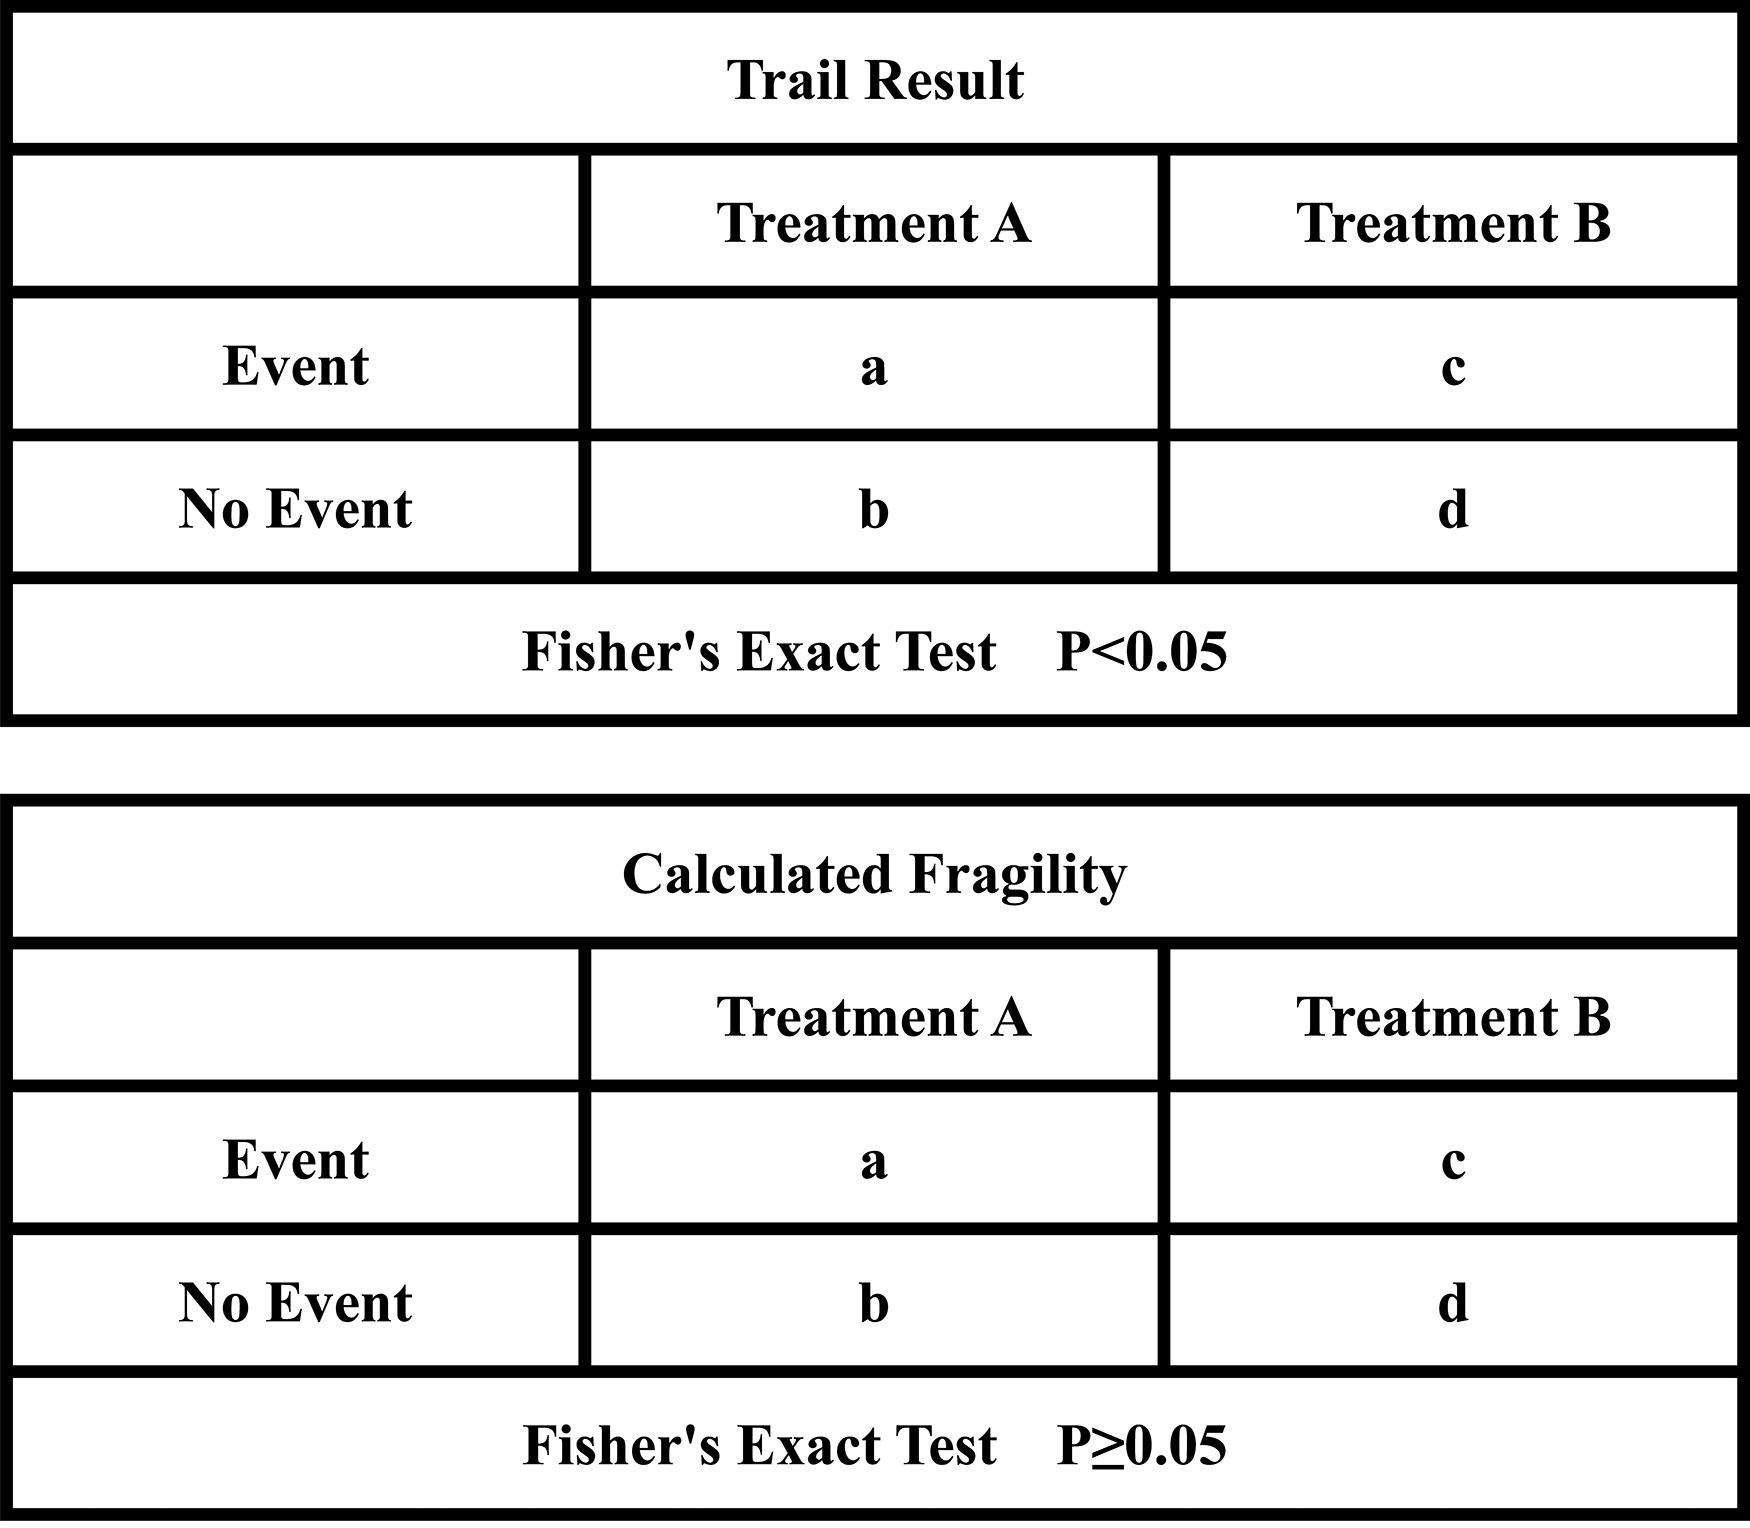
Based on the above, the fragility index (FI) has been suggested in recent years to supplement the limitations of the P -values and to evaluate the robustness of the statistical significance of the RCTs [ ]. FI was defined as the minimum number of patients reversals (from a nonevent to an event) required to convert a statistically significant result to a nonsignificant result ( Fig. 1 ). The smaller the number is, the more fragile the statistical outcome of the event is. Recently, FI has been used extensively in medical RCTs, encompassing the treatments of various tumors. However, the median values of FI among them vary. For example, the statistics show that the median FI is 5 in hepatocellular carcinoma (HCC) [ ], −2 in cholangiocarcinoma [ ], 2 in rectal cancer [ ] and 28 in common solid tumors (including lung, breast, prostate and colon cancer and melanoma) [ ].
For all we know, there are no studies that have analyzed the fragility of statistical differences in RCTs concerned with RCC till now. The purpose of our study is to evaluate the statistical robustness of RCTs for the treatment of a/mRCC by utilizing FI.
2
Materials and methods
2.1
Search strategy
In addition to 4 high-impact general medical journals including The Lancet, The New England Journal of Medicine (NEJM), The British Medical Journal (BMJ), and The Journal of the American Medical Association (JAMA), we used InCites Journal Citation Reports to identify the top 25 highest impact urological journals. RCTs related to a/mRCC published in the above journals were systematically searched in PubMed using the MeSH terms for “randomized controlled trials” and “renal/kidney cell cancer/carcinoma” along with synonymous keywords from January 1, 2000, to December 31, 2023, publishing language set to English.
2.2
Eligibility criteria
The following inclusion criteria was included: (1) 2 parallel arms or two-by-two factorial design RCTs (randomized 1:1) related to a/mRCC, (2) at least one of the primary or secondary endpoints with a statistically significant outcome in the dichotomous trials ( P < 0.05 or a 95% confidence interval that excluded the null value), (3) involved human participants. The exclusion criteria covered case reports, meta-analyses, systematic reviews, cadaveric studies, animal studies, in vitro studies, and nondichotomous data.
2.3
Study selection and data extraction
The titles and abstracts of each article were screened by 2 independent reviewers to confirm that the literature for initial inclusion met the eligibility criteria. We have excluded studies on the diagnostic, cost-effective, non-a/mRCC, without specific numbers of patients in the 2 arms and investigation of baseline factors for outcomes. All included studies were on the comparison of treatments. The full text of the initially included studies was subsequently reviewed for final inclusion. Any disagreements between the 2 reviewers were resolved by a third reviewer.
We gathered the following variables for each trial that ultimately met the inclusion criteria: authors, publication year, journal name, sample size of patients enrolled, arms and number of patients per arm, number of patients lost to follow-up, P -value recalculated, efficacy outcomes and whether outcomes were primary or secondary.
2.4
Application of the fragility index
In case of more than one outcome variable was reported to be eligible for the calculation of FI in the studies, we gave priority to the primary outcome. If the primary outcome was not eligible, we then considered the most significant secondary outcome according to the Grading of Recommendations Assessment, Development and Evaluation guideline (GRADE) [ ]. We described trials in which the number of patients lost to follow-up was greater than or equal to FI as statistical fragility group, while vice versa as statistical robustness group. We calculated the FI for each trial utilizing a two-by-two contingency table based on the methodology presented by Walsh et al. [ ]. The P -value for each outcome was firstly recalculated by using a 2-sided Fisher’s exact test. We then repeatedly added the number of events in the arm with the lower number of events while simultaneously subtracting the number of nonevents to maintain the total number of patients unchanged. The number of additional events that when the P -value exactly changed from< 0.05 to ≥ 0.05 by Fisher’s exact test represented the FI. If the recalculated P -value was greater than or equal to 0.05 without change in the event, the FI was reported as zero.
2.5
Statistical analysis
SPSS software (version 23; IBM, Armonk, NY, USA) and Microsoft Excel 2016 (Redmond, WA, USA) were used for data analysis. Agreement amongst reviewers was determined using the Cohen kappa coefficient. The interpretation of kappa values was performed according to the guidelines previously published by Landis and Koch [ ]: kappa values of 0.00 to 0.20, 0.21 to 0.40, 0.41 to 0.60, 0.61 to 0.80, 0.81 to 1.00 are considered to be slightly, fairly, moderately, substantially, and almost perfectly consistent, respectively. We utilized descriptive statistics to conclude the FI of the RCTs and determined interquartile ranges (IQRs) to contribute to the overall understanding and explanation of the reported variability and dispersion. Spearman correlation analyses were conducted to investigate the relationship between the FI and trial characteristics variables including trial sample size, number of patients lost to follow-up, and P -value. All significance tests were 2-tailed, with a P -value less than 0.05 considered significant.
3
Results
3.1
Study selection
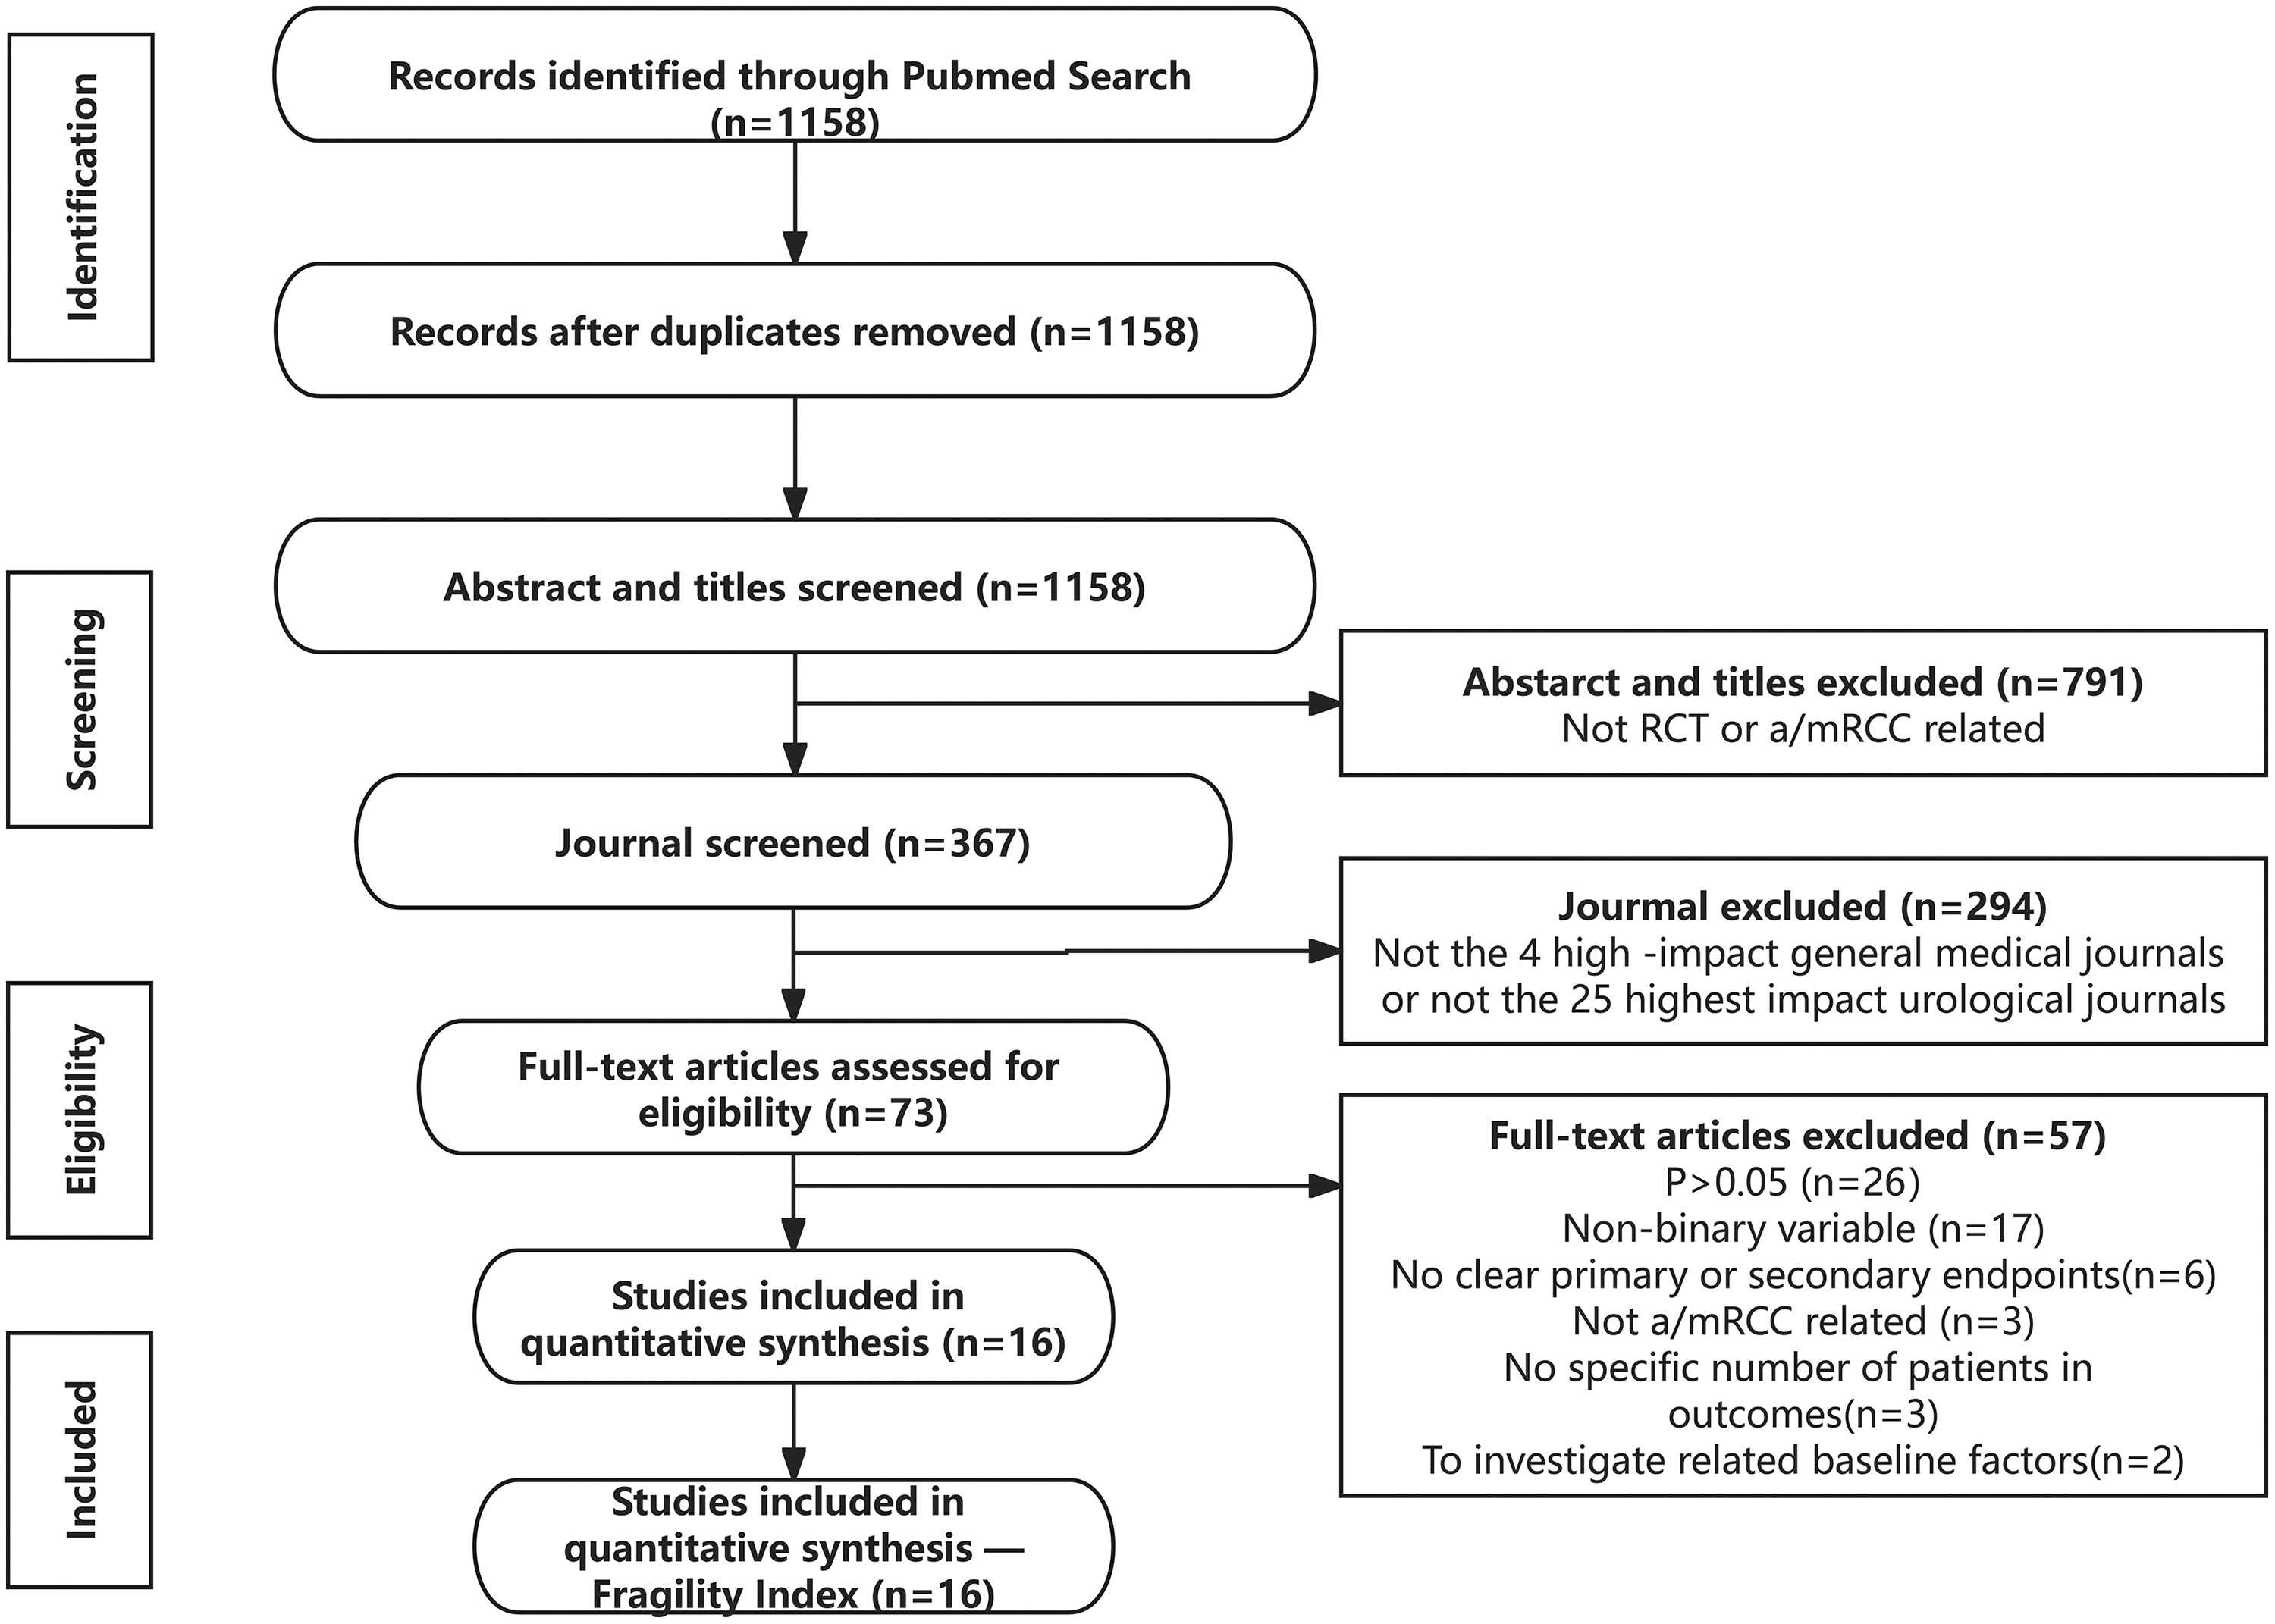
The literature search identified 1158 potentially eligible studies. After excluding duplicate articles and screening titles, abstracts, and journals, 73 articles were eligible for full-text review. Finally, 16 RCTs related to a/mRCC were included after a review of full texts ( Fig. 2 ). The agreement between the 2 reviewers for eligibility was substantially consistent (kappa = 0.67).
3.2
Trial characteristics and outcomes
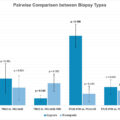
The characteristics of all included studies were summarized in Table 1 ( Supplementary Table 1 in details). The median total number of patients in the samples was 654.5 (IQR, 461–847). All included RCTs unequivocally reported patients lost to follow-up, with a median of 14 (IQR, 3–23). Among all the outcomes reported in the confirmed studies, 13 were primary outcomes (81%) [ ], and 3 were secondary outcomes (19%) [ ]. Reported P -values (a total of 19 P -values, including co-primary endpoints in 2 studies) for each outcome were less than 0.05 but greater than or equal to 0.01 for 5 (26%) [ , , , , ], less than 0.01 but greater than or equal to 0.001 for 4 (21%) [ , , , ], and less than 0.001 for ten (53%) [ , , , , , , ]. The treatment management could be categorized into comparisons between single agents of the same category (12.5%) (including mTOR inhibitors and tyrosine kinase inhibitors [TKI]), single agents of different categories (43.75%) (3 of which were comparisons with placebo), and 2-drug combinations vs. single agents (43.75%) (4 comparisons of immune checkpoint inhibitors (ICI)+TKI vs. TKI and 3 comparisons of ICI+ICI vs. TKI). The outcomes (a total of 19 outcomes, including co-primary endpoints with co-outcomes in 2 studies) reported in the trials were as follows: overall survival (OS), objective response rate (ORR), progression-free survival (PFS), disease-free survival (DFS), and the proportion of patients achieving an objective response.
| Authors | Year | Journal | Patients enrolled | Efficacy outcomes | Lost to follow-up | P -value | FI |
|---|---|---|---|---|---|---|---|
| Bernard et al. [ ] | 2007 | N Engl J Med | 903 | PFS | 17 | <0.001 | 20 |
| Bernard et al. [ ] | 2007 | The Lacent | 649 | PFS | 21 | <0.001 | 34 |
| Robert et al. [ ] | 2007 | N Engl J Med | 750 | PFS | 35 | <0.001 | 54 |
| Powles et al. [ ] | 2016 | Eur Urol | 49 | PFS | 2 | <0.001 | 8 |
| Toni et al. [ ] | 2016 | The Lacent Oncology | 658 | PFS | 25 | 0.005 | 11 |
| Robert et al. [ ] | 2017 | N Engl J Med. | 821 | OS | 18 | 0.011 | 9 |
| Robert et al. [ ] | 2018 | N Engl J Med | 847 | OS | 3 | <0.001 | 38 |
| ORR | <0.001 | 36 | |||||
| PFS | NA | NA | |||||
| Robert et al. [ ] | 2019 | N Engl J Med | 560 | PFS | 13 | 0.022 | 4 |
| Robert et al. [ ] | 2019 | Lancet Oncol | 847 | OS | 3 | 0.002 | 18 |
| PFS | 0.022 | 5 | |||||
| The proportion achieving objective response | <0.001 | 25 | |||||
| Brian et al. [ ] | 2019 | The Lacent | 362 | PFS | 4 | 0.044 | 1 |
| Brian et al. | 2019 | The Lacent | 915 | P > 0.05 | |||
| Thomas et al. [ ] | 2020 | Lancet Oncol | 861 | OS | 34 | 0.009 | 10 |
| Brian et al. [ ] | 2020 | Lancet Oncol | 350 | PFS | 2 | <0.001 | 10 |
| T.K. et al. [ ] | 2021 | N Engl J Med | 651 | PFS | 12 | <0.001 | 20 |
| T.K. et al. [ ] | 2021 | N Engl J Med | 994 | DFS | 31 | 0.003 | 14 |
| Robert et al. [ ] | 2022 | Lancet Oncol | 651 | PFS | 15 | <0.001 | 37 |
| Gr¨¹nwald et al. [ ] | 2023 | Eur Urol | 49 | ORR | 1 | 0.038 | 1 |
Related posts:
 Is primary retroperitoneal lymph node dissection the way forward for patients with testicular seminoma and limited retroperitoneal metastases?
 Critical care therapy and in-hospital mortality after radical nephroureterectomy for nonmetastatic upper urinary tract carcinoma
 The clinical relevance of cut-off percentage for high-grade urothelial carcinoma within low-grade urothelial carcinoma: A determining factor?
 Cumulative smoking exposure impacts oncologic outcomes of upper tract urothelial carcinoma
Multicenter study of active surveillance for small renal masses: Real world practice pattern
Cumulative smoking exposure impacts oncologic outcomes of upper tract urothelial carcinoma
Multicenter study of active surveillance for small renal masses: Real world practice pattern
 Pathologic prostate cancer grade concordance among high-resolution micro-ultrasound, systematic transrectal ultrasound and MRI fusion biopsy
Stay updated, free articles. Join our Telegram channel

Full access? Get Clinical Tree


