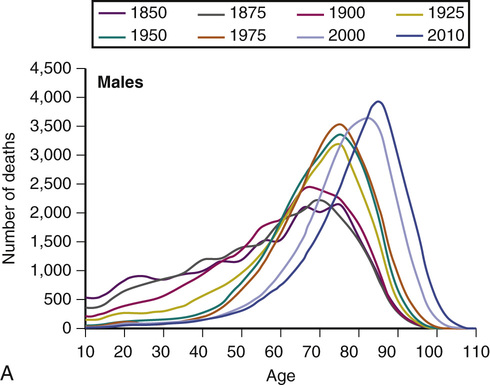
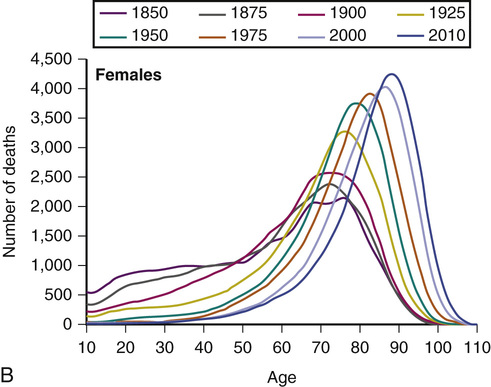
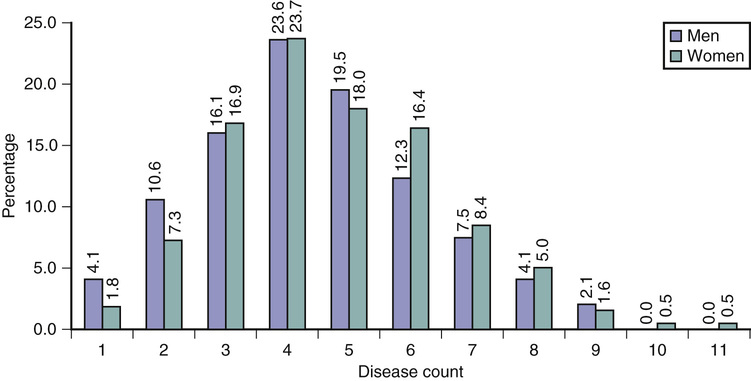
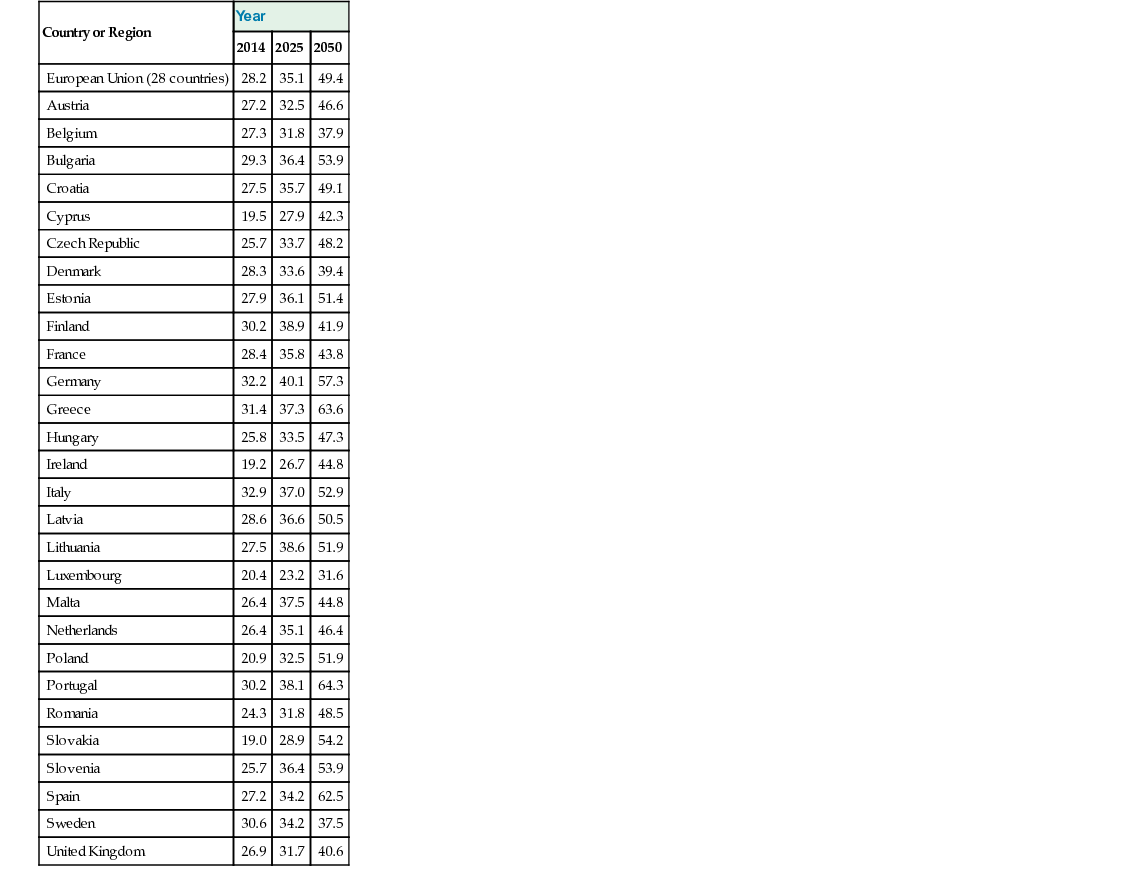
Carol Jagger Age is not measured by years. Nature does not equally distribute energy. Some people are born old and tired while others are going strong at seventy. Dorothy Thompson According to Wikipedia, epidemiology is defined as “the science that studies the patterns, causes, and effects of health and disease conditions in defined populations.” Epidemiology was first concerned with epidemics of infectious diseases when these were the main cause of death. However, with what demographers termed the epidemiologic transition, when the main cause of death in most populations worldwide shifted from infectious to noninfectious disease, epidemiologists moved their attention to chronic diseases, as well as to aging, which is more a characteristic of the population as life expectancy increases. The body of knowledge of the epidemiology of aging has evolved into concentrating on three main areas: the causes and consequences of the aging of populations, the natural history of diseases of old age, and the evaluation of services set up to assist older people. This chapter will concentrate on the first of these, with a discussion of the burden of disease in old age generally, rather than for specific disease, and the implications of this for health and care services; the other two sections will be covered more fully elsewhere in the text. The early twenty-first century is unique in a number of aspects, but in relation to the people of the world, it is most remarkable as a time when humans live appreciably longer than ever before. Perhaps even more remarkably this rate of prolongation of average life expectancy shows little signs of abating. This extraordinary piece of good luck for those of us who live at this time is tempered a little by the knowledge that life insurers and those calculating pensions have been betting our money on our not living so long, so we may be poorer than we had hoped. The constancy of the increase in human life expectancy over the past decades, at around 2 years every decade, or 4 to 5 hours per day, has surprised scientists and the population generally. Before 1950, most of the gain in life expectancy was due to reductions in death rates at younger ages. Demographers were confidently predicting that once these gains, made by reducing mortality in early and middle life, had reached completion, growth in longevity would stop and we would see the fixed reality of the aging process. However, in the second half of the twentieth century, improvements in survival after the age of 65 years caused the increase in the length of people’s lives and, indeed, mortality rates even in very old age have fallen. Experts who have repeatedly asserted that life expectancy is close to an ultimate ceiling have repeatedly been proven wrong, and most forecasts of the maximum possible life expectancy in recent years have been broken within 5 years of the forecast.1,2 The results of these remarkable increases in life expectancy have been the so-called graying of our populations. In 2010, around 8% of the world’s population was aged 65 years or over, and this is expected to double, to 16%, by 2050—but these figures hide two facts. First, that the older population itself is aging; the fastest growing section of most populations worldwide is those aged 85 years and older, the very old, who are forecast to number 377 million worldwide by 2050. There has also been an exponential increase in the number of centenarians in countries such as Japan, France, and the United Kingdom (UK), as well as the emergence of another section of the population, supercentenarians, those aged 110 years and over. The modal age at death, a measure of average life span, has been increasing steadily in the UK (Figure 2-1), reaching 85 years for men and 89 years for women in 2010, and therefore already surpassing the upper limit for life span of 85 years to be reached by 2045 (theorized by Fries3). Second, not all countries are aging at the same pace. It took France around 110 years for its older population (aged 65+ years) to rise from 7% of the population to 14%. Sweden took 80 years and the UK 50 years, but Brazil and South Korea are forecast to reach this level of demographic aging in less than 20 years. Thus, the political and societal accommodation to demographic aging will have to be made much more rapidly in developing countries. The ratio of the dependent population to the economically active or working population is termed the dependency ratio. This has been commonly defined as the ratio of the population aged 65 years and over to those aged 15 to 64 years. For the European Union (EU) as a whole, the dependency ratio is 28.2 and it is projected to rise to 49.2 by 2050. However, the aging of the population and low fertility rates means that for some European countries, the dependency ratio is much higher. For example, the ratio in Spain is 27.2 but by 2050 will reach 60.5 (Table 2-1). Nevertheless, this ratio may become less useful in the future as the retirement age is increased, and indeed many people over the age of 65 remain in the workforce, whereas there are those under the age of 65 who are not part of the working population—children, students, housewives, husbands, and the unemployed. Being not formally employed does not mean that they are not contributing to the economy. Grandparents contribute hugely in terms of child care for working and retired people, especially women, and are one of the biggest groups caring for older disabled relatives, most often a spouse. Thus, the dependency ratio does not reflect the need for care, the more usual use of the term dependency. For this, the oldest old support ratio, the ratio of people aged 50 to 74 years to those aged 85 years and older, has been proposed.4 TABLE 2-1 Old Age Dependency Ratio* Because of the youthfulness of immigrants, immigration is often seen as a solution to the “problem” of population aging in countries with low fertility. Presently, the lack of people to take jobs in developed countries, for example in the care sector, draws young people from developing countries, lowering the average age of the population. There are, however, cohorts from the West Indies and Southeast Asia, predominantly India and Pakistan, who came to the UK in the 1960s and 1970s and who have now aged into the older population. Although their numbers are small, they will increase, and they are known to have higher risks of cardiovascular disease, stroke, and diabetes,5 although little is known about their rates of cognitive impairment or disability. There now appears to be a reasonably clear consensus that the aging process is caused by an accumulation of molecular damage over time. The rate of aging in an individual is therefore a complex interaction among damage, maintenance, and repair. These interactions are, of course, influenced by genetic and environmental factors. It has been said that whoever created humans, whether nature or a creator, did a poor job but, being aware of it, put in a lot of backup systems. On the other hand, it may be a universal law that hyperefficiency is less effective in the long run than flexibility. This may be a useful lesson beyond the realms of longevity in a world seemingly more concerned about efficiency than effectiveness. It is assumed that genetic changes are unlikely to alter appreciably, under evolutionary pressure, over the short period, during which longevity has dramatically increased. The reason for the increasing longevity is therefore said to be caused by the interplay of advances in income, nutrition, education, sanitation, and medicine, with the mix varying over age, period, cohort, place, and disease. It seems likely, then, that these changes are largely a result of a wide range of environmental factors. The birth cohorts of the early 1900s experienced huge changes in socioeconomic conditions, hygiene, lifestyle, and medical care, leading to dramatic falls in infant mortality and infectious and respiratory disease rates. The main effects were improvements in housing, sanitation, and nutrition; the control of infectious diseases and maternal mortality; and the advent of antibiotics and vaccination.6 In later years, it has been the survival of older people that has led to the extension of life expectancy, due predominantly to reductions in cardiovascular and stroke mortality and increasing survival for many cancers. Life expectancy at age 65 years in the UK has risen by 5.2 years for men and 3.8 years for women since 1981, equating to an increase of 40% for men and 20% for women. The prevalence of the major chronic diseases—coronary heart disease (CHD), stroke, and dementia—which have grown in importance over the century, increases with age. This is particularly the case for dementia, where the prevalence approximately doubles for every 5-year increase in age.7 Moreover, very old age is characterized by multiple, rather than single, diseases. In the Newcastle 85+ Study, none of the men and women aged 85 years were free of disease (Figure 2-2); on average, men and women had four and five diseases respectively, whereas around 30% had six or more diseases.8 This accumulation of disease has implications for the delivery of health care because, at least in the UK, secondary care is organized predominantly around single diseases. However, the high level of multimorbidity is also a strong contributor to frailty, reflecting the accumulation of deficits inherent in the Frailty Index.9 In the past, life expectancy has been used as a surrogate measure of the health of populations and, even today, there are those who purport that we are healthier than previous cohorts simply because we are living longer. On the other hand, the burden of disease and increasing frailty and dependency in late old age would suggest the opposite. What is clear is that life expectancy itself does not equate with health, and we need to ensure that our extra years of life are healthy ones (or as Fries, termed it, compression of morbidity3) rather than unhealthy ones through extending the life of those already sick (expansion of morbidity).10 To explore these opposing theories, the concept of health expectancy was developed. Health expectancy is a population health indicator combining information on the quantity of life (life expectancy) and quality of the remaining years (health).11 Because there are many measures of health, there are many possible health expectancies, but the most common are based on self-reported general health (healthy life expectancy) and disability (disability-free life expectancy). Unlike quality-adjusted life-years (QALYs), health expectancies do not generally incorporate weighting of health states; they therefore give a more transparent picture of how the health of a population is evolving alongside increasing life expectancy. More recently, the development of harmonized health measures across Europe has enabled comparative health expectancies between European countries. Indeed, the first health indicator for the EU was healthy life years (HLYs), a disability-free life expectancy. This indicator, computed annually across all EU countries, highlights the huge inequalities across Europe and that using life expectancy as the metric vastly underestimates inequalities. In 2011, male life expectancy at age 65 in the EU27 was 17.8 years, of which only 8.6 years (48%) were HLYs, but with a range of life expectancy across countries of 5.8 years (from 13.4 to 19.3 years) and a range of HLYs of 10.3 years (from 3.5 to 13.9 years; Table 2-2). More recently, frailty-free life expectancy has been computed for 13 countries who are part of the Survey of Health and Retirement in Europe (SHARE), showing considerable heterogeneity in the years spent as robust, prefrail, frail, or with severe activity limitation (Figure 2-3).12 TABLE 2-2 Male and Female Life Expectancy (LE) and Healthy Life Years (HLYs)*
The Epidemiology of Aging
Introduction
The Causes and Consequences of Population Aging
Longevity
Country or Region
Year
2014
2025
2050
European Union (28 countries)
28.2
35.1
49.4
Austria
27.2
32.5
46.6
Belgium
27.3
31.8
37.9
Bulgaria
29.3
36.4
53.9
Croatia
27.5
35.7
49.1
Cyprus
19.5
27.9
42.3
Czech Republic
25.7
33.7
48.2
Denmark
28.3
33.6
39.4
Estonia
27.9
36.1
51.4
Finland
30.2
38.9
41.9
France
28.4
35.8
43.8
Germany
32.2
40.1
57.3
Greece
31.4
37.3
63.6
Hungary
25.8
33.5
47.3
Ireland
19.2
26.7
44.8
Italy
32.9
37.0
52.9
Latvia
28.6
36.6
50.5
Lithuania
27.5
38.6
51.9
Luxembourg
20.4
23.2
31.6
Malta
26.4
37.5
44.8
Netherlands
26.4
35.1
46.4
Poland
20.9
32.5
51.9
Portugal
30.2
38.1
64.3
Romania
24.3
31.8
48.5
Slovakia
19.0
28.9
54.2
Slovenia
25.7
36.4
53.9
Spain
27.2
34.2
62.5
Sweden
30.6
34.2
37.5
United Kingdom
26.9
31.7
40.6
Why Do We Age?
Healthy Aging
Country
Gender
Male
Female
LE (Years)
HLYs (Years)
% HLY/LE
LE (Years)
HLYs (Years)
% HLYs/LE
Austria
18.1
8.3
45.9
21.7
8.3
38.4
Belgium
18.0
9.8
54.5
21.6
10.3
47.5
Bulgaria
14.0
8.6
61.5
17.3
9.7
55.7
Cyprus
18.2
8.0
44.0
20.3
5.9
29.0
Czech Republic
15.6
8.4
53.8
19.2
8.7
45.4
Denmark
17.3
12.4
71.6
20.1
13.0
64.6
Estonia
14.8
5.6
37.9
20.1
5.7
28.6
Finland
17.7
8.4
47.3
21.7
8.6
39.8
France
19.3
9.7
50.5
23.8
9.9
41.8
Germany
18.2
6.7
36.7
21.2
7.3
34.2
Greece
18.2
9.0
49.6
21.2
7.9
37.2
Hungary
14.3
6.0
41.9
18.2
6.0
33.0
Ireland
17.9
10.9
60.8
20.9
11.8
56.5
Italy
18.6
8.1
43.4
22.4
7.0
31.1
Latvia
13.4
4.8
35.7
18.7
5.0
26.7
Lithuania
14.0
6.2
44.1
19.2
6.7
34.8
Luxembourg
17.8
11.5
64.6
21.6
11.8
54.8
Malta
17.7
11.8
67.0
21.0
11.0
52.3
Netherlands
18.1
10.4
57.7
21.2
9.9
46.8
Poland
15.4
7.6
49.7
19.9
8.3
41.8
Portugal
17.8
7.8
43.6
21.6
6.3
29.4
Romania
14.7
5.4
36.9
17.7
4.7
26.7
Slovakia
14.5
3.5
23.8
18.4
2.9
16.0
Slovenia
16.9
6.2
36.8
21.1
6.9
32.5
Spain
18.8
9.7
51.7
23.0
9.3
40.4
Sweden
18.5
13.9
75.0
21.3
15.2
71.3
United Kingdom
18.5
11.0
59.6
21.1
11.9
56.3
EU27
17.8
8.6
48.2
21.3
8.6
40.4
Minimum
13.4
3.5
23.8
17.3
2.9
16.0
Maximum
19.3
13.9
75.0
23.8
15.2
71.3
Range
5.8
10.4
51.2
6.4
12.3
55.4 ![]()
Stay updated, free articles. Join our Telegram channel

Full access? Get Clinical Tree


The Epidemiology of Aging
2