Fig. 8.1
Rapalogs retain the basic structure of the parent rapamycin compound, but differ by the moiety added at position C43 to increase the agents’ solubility and bioavailability: addition of an ester, an ether, or a phosphonate group creates temsirolimus (Fig. 8.1b), everolimus (Fig. 8.1c), and ridaforolimus (Fig. 8.1d), respectively [12]. Temsirolimus and ridaforolimus are both water soluble and thus may be administered intravenously (IV). Sirolimus and everolimus, however, have low solubility and are only available orally [13]. Like the parent compound, the synthetic rapalogs form a complex with the intracellular receptor FK 506 binding protein 12 (FKBP12) and preferentially inhibit the mTOR complex 1 (mTORC1) rather than the mTOR complex 2 (mTORC2) [1, 14, 15]. Newer agents are also currently being developed that target mTOR at a different binding site. These ATP-competitive agents include the mTOR-selective inhibitors, which target both mTORC1 and mTORC2 simultaneously, as well as the dual mTOR and PI3K inhibitors, which target both mTOR complexes as well as PI3K [4]. The applications of these newer agents will be discussed further in a separate chapter.
The recommended dosage of temsirolimus is 25 mg infused intravenously over a 30–60 min period once a week, with prophylactic diphenhydramine 25–50 mg administered intravenously about 30 min prior to treatment (http://labeling.pfizer.com/showlabeling.aspx?id=490). The dosage was determined in part by a phase II study of temsirolimus in patients with advanced refractory advanced RCC given at 25, 75, and 250 mg [16]. In this study, it was determined that when given at 25 mg, the maximum concentration (C max) of temsirolimus in the serum was 595 ng/mL, the area under the concentration versus time curve (AUC) was 1,580 ng⋅h/mL, and the terminal half-life was 12.8 h. The volume of distribution was high at 232 L and increased substantially with increasing dose (Table 8.1). This finding was unusual and suggestive of extensive tissue distribution that increases with increasing dose. Ultimately, it was found that tumor response rates as well as median survival were comparable among the different dose levels, and thus, it was proposed that 25 mg, the lowest strength studied, would be the one used in subsequent studies [16]. Temsirolimus is metabolized fairly rapidly to sirolimus through de-esterification in the liver [13, 19], and this metabolite is seen as early as 15 min after temsirolimus infusion [20]. However, temsirolimus is not considered a prodrug for sirolimus, as both agents are pharmacologically active [21]. Peak concentrations of sirolimus are around 10–20 % of the maximum concentration of temsirolimus, and because sirolimus has a longer half-life of around 40–57 h, a higher relative exposure to the metabolite than to temsirolimus was seen [16]. It is thought that this longer half-life of the metabolite allows for the weekly dosing of temsirolimus [14]. As CYP 3A4 is the major isozyme that metabolizes both temsirolimus and sirolimus, the manufacturer recommends caution and possible dose adjustment when coadministering strong CYP3A4 inducers or inhibitors with temsirolimus [22], (http://labeling.pfizer.com/showlabeling.aspx?id=490). Furthermore, grapefruit juice, which also possesses cytochrome P450 inhibition qualities, should be avoided (http://labeling.pfizer.com/showlabeling.aspx?id=490). Elimination of temsirolimus occurs mainly through the feces, though urinary excretion occurs at a small percentage as well (http://labeling.pfizer.com/showlabeling.aspx?id=490).
The recommended dosage for everolimus used in the oncologic setting is 10 mg orally once daily, taken with or without food (http://www.pharma.us.novartis.com/product/pi/pdf/afinitor.pdf). A preclinical study found that everolimus administered daily had a greater inhibitory effect on S6 kinase 1 (S6K1) than when administered even at higher doses on a weekly basis [23]. A phase I study using the modulation of pS6 (phosphorylated S6 at Ser235/236 and at Ser240/244) and peIF-4G (phosphorylated eIF-4G at Ser1108) in skin and tumor biopsies as a marker for mTOR inhibition determined that orally administered everolimus at the 10 mg per day dose level would be the optimal everolimus treatment dosage [24]. In the same study, it was determined that the oral bioavailability was about 30 %. In another phase I and pharmacologic study, O’Donnell et al. found that when given as a daily regimen, everolimus was rapidly absorbed and reached C max within 1–2 h, although steady-state concentration was reached much later (within 1 week). At the 10 mg per day dosing, the C max in the serum was 61 ng/mL, and the AUC at steady state was 514 ng⋅h/mL [17] (Table 8.1). As everolimus is taken in the oral form, considerations should be taken in regard to coadministration with food. A study done in healthy male volunteers showed that when everolimus was administered with a high-fat meal, the time to C max was delayed by a median of 1.25 h, with the peak blood concentration reduced by 60 % and the AUC decreased by 16 % [25]. The authors thus recommend that in order to reduce the long-term variability in drug exposure, everolimus should be taken consistently either with or without food [25]. At therapeutic concentrations, over 75 % of everolimus is partitioned into red blood cells, and the remaining plasma fraction is about 75 % protein bound [26, 27]. Everolimus is metabolized extensively by CYP3A4, CYP3A5, and CYP2C8 in the gut and liver [26]. Thus, as with temsirolimus, coadministration with CYP3A4 inducers or inhibitors should occur with caution, as these could cause either decreased or increased exposure to everolimus, respectively (http://www.pharma.us.novartis.com/product/pi/pdf/afinitor.pdf). Patients should also avoid grapefruit, grapefruit juice, and other foods known to inhibit cytochrome P450 activity (http://www.pharma.us.novartis.com/product/pi/pdf/afinitor.pdf). At least 13 metabolites of everolimus have been discovered [26], though the main metabolite is hydroxy-everolimus, with a time to maximum serum concentration of 1.2–2 h after administration of everolimus [27]. Unlike temsirolimus, which has sirolimus as its main pharmacologically active metabolite, it is unclear whether the metabolites of everolimus have any biologic activity [26]. The mean elimination half-life of everolimus was found to be about 30 h [17], with approximately 98 % excreted in the bile as metabolites and 2 % excreted in the urine [26, 27].
Ridaforolimus is a relatively newer rapalog that is still under investigation and has been studied in both intravenous and oral formulations for various malignancies. A phase I study examined ridaforolimus administered without premedication as a 30 min IV infusion once daily for 5 consecutive days given every 2 weeks in a 28-day cycle [18]. The authors chose this schedule in order to strike a balance between a feasible IV dosing schedule and daily dosing to achieve sustained kinase inhibition. The study confirmed that ridaforolimus was not a prodrug of sirolimus, as levels of sirolimus were below the limit of quantitation or less than 1 % of ridaforolimus levels. The mean half-life of IV ridaforolimus was found to range from approximately 56 to 74 h. The C max and AUC of IV ridaforolimus increased dose proportionally at lower doses, but seemed to plateau at around a dose of 12.5 mg per day. At higher doses, the exposure of the drug was nonlinear. At the 12.5 mg per day dosing, the C max was 519 ng/mL, the AUC was 4690 ng⋅h/mL, and the volume of distribution was 171 L (Table 8.1). Because of the plateau of the C max and the AUC, as well as findings of more frequent toxicities with doses higher than 12.5 mg per day, the study recommended the dosing of 12.5 mg once daily for five consecutive days every 2 weeks as the regimen for future studies [18]. Ridaforolimus has been studied in the oral formulation as well. A phase I/II study tested escalating doses of ridaforolimus given orally on various daily dosing regimens [28]. Out of these various combinations, it was determined that the regimen of 40 mg given daily for 5 days weekly offered the best combination of cumulative dose, dose density, and cumulative exposure; this regimen was thus selected for use in future studies. Similar to the pharmacokinetics of IV ridaforolimus, the study also found that drug exposure with oral administration was nonlinear, as AUC and C max increased less than proportionally with increased dosing, particularly with doses higher than 40 mg. At the regimen of ridaforolimus 40 mg taken orally every day for 5 days, the terminal half-life was 42 h, the time to peak concentration was 3 h, the C max was 112 ng/mL, and the AUC was 2,017 ng⋅h/mL [28]. In contrast to everolimus, food intake does not appear to have any clinically significant effect on oral ridaforolimus absorption. A study by Stroh et al. performed in healthy volunteers showed that taking ridaforolimus after consuming a light breakfast resulted in no change in drug absorption compared to when taken on an empty stomach. After consuming a high-fat breakfast, elevations in AUC and C max were also clinically insignificant. As such, the authors recommend that ridaforolimus may be administered orally without any regard to concurrent food intake [29].
8.3 Toxicity
8.3.1 Stomatitis/Oral Toxicity
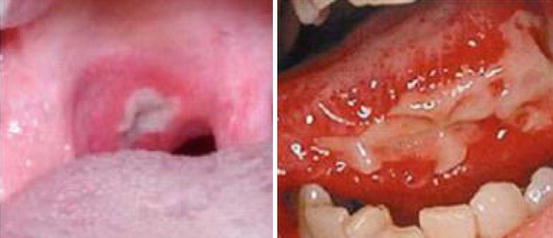
Stomatitis is one of the most commonly described toxicities of mTOR inhibitors in clinical studies [30]. It is generally believed that these oral ulcerations induced by mTOR inhibitor therapy represent a class effect very distinct from conventional mucositis induced by cytotoxics and/or radiation therapy [7, 31]. Sonis et al. first introduced the term mTOR inhibitor-associated stomatitis (mIAS) in a 2010 interim safety data analysis on two phase I trials of ridaforolimus in patients with solid malignancies. In general, the lesions of mIAS strongly resemble those of aphthous stomatitis and are characterized by distinct, oval, well-demarcated ulcers [31]. Development of an overlying pseudomembrane has been variably described [31–33]. Much like aphthous ulcers, mIAS lesions can also present with minor (≤1.0 cm), major (>1.0 cm), and herpetiform (clustering of minor lesions) patterns and are confined to nonkeratinized, mobile mucosa, including the inner aspect of the lips, lateral tongue, buccal mucosa, and soft palate (Fig. 8.2) [7, 31, 34]. Appearance of these lesions occurs approximately 10 days following the start of mTOR inhibitor therapy [34]. In early-phase studies of mTOR inhibitors, the reported incidence and toxicity grades of oral sores consistent with mIAS were higher early in the course of treatment and at higher dose levels [20, 35]. Noteworthy, the frequency and severity of the lesions tended to decrease with repeated cycles of treatment, which has clinical implications as detailed further in the chapter [18, 36].
Interestingly, it has been shown that the incidence of other gastrointestinal adverse events is similar between patients who developed mIAS and patients who did not [31], suggesting that mucosal ulcerations caused by mTOR inhibitors are mainly limited to the mouth. In contrast, mucositis from conventional cytotoxic chemotherapy is characterized by ulcers in both the oropharynx and other areas of the gastrointestinal mucosa [37]. Conventional mucositis usually begins with emergence of erythema 4–5 days after chemotherapy or total head and neck irradiation of approximately 10 Gy, followed by appearance of ulceration at 7–10 days after chemotherapy or 30 Gy of radiation treatment. These lesions also primarily involve only the mobile, nonkeratinized surfaces of the buccal mucosa and lateral and ventral aspects of the tongue, though radiation-induced mucositis may occasionally involve the hard palate as well. The mucositis from chemotherapy generally lasts approximately 1 week and heals spontaneously on day 21 of infusion; however, radiation-induced mucositis can last up to 5–7 weeks [37].
Despite comparisons to recurrent aphthous stomatitis (RAS), the pathobiology behind mIAS remains unclear [30]. The mechanism behind chemotherapy- and radiotherapy-induced mucositis, however, has been better described [38]. Although it was previously believed that antineoplastic therapy nonspecifically destroys rapidly dividing cells of the basal epithelium, there has been evidence to suggest that the pathogenesis of mucositis actually involves five distinct stages: (1) initiation, (2) primary damage response, (3) signal amplification, (4) ulceration, and (5) healing. This process begins with radiation- or chemotherapy-induced DNA and non-DNA damage and reactive oxygen species formation in epithelial and submucosal cells, leading to activation of intracellular pathways that produce pro-inflammatory cytokines, culminating in cellular apoptosis and tissue damage [38].
Martins et al. in 2013 performed a meta-analysis on the incidence of mIAS associated with mTOR inhibitor therapy for various malignancies. A total of 44 phase I to III studies using temsirolimus, everolimus, and ridaforolimus were examined, for a total of 2822 patients. It was found that the incidence of all-grade mIAS with temsirolimus was 60.8 %, whereas the incidence of grade 3–4 mIAS was 5.2 %. The incidence of all-grade mIAS with everolimus was 44.3 %, whereas the incidence of grade 3–4 mIAS was 5.2 %. The incidence of all-grade mIAS with ridaforolimus was 54.6 %, whereas the incidence of grade 3–4 mIAS was 8.2 %. The authors also found that, overall, stomatitis was the most frequent adverse event, the most frequent dose limiting toxicity (DLT) accounting for 52.5 % of DLTs, the second most frequent cause of dose reductions (27.3 % of cases), and the most frequent cause of drug discontinuation at 12.9 % [30].
Conventional mucositis due to antineoplastic therapy has been found to derive some benefit from prophylaxis with cryotherapy with ice chips and palifermin, a human recombinant keratinocyte growth factor [39]. The belief is that cryotherapy with ice chips may lead to blood vessel constriction to reduce mucosal tissue exposure to chemotherapy [37], whereas palifermin exerts its effects on barrier integrity through its pleiotropic activities on cell survival and mitogenesis in epithelial cells, endothelial cells, fibroblasts, and keratinocytes [40]. In more severe cases, narcotic analgesia and even total parenteral nutrition (TPN) may be required [37, 38]. Similarly, stomatitis from mTOR inhibitors may also have a significant effect on oral intake of food and medication, and TPN requirements due to mIAS have been described as well [20]. However, as the driving mechanisms behind mIAS and conventional mucositis are different, the management strategy for each is understandably different. Unfortunately, data for prophylaxis and treatment of mIAS has been sparse, and recommendations have largely been anecdotal or based on retrospective studies limited by small sample size. Experiences with therapies used in mucositis such as chewing ice chips [7], antiseptic mouthwashes [20], and “Miracle Mouthwash” solutions containing a combination of lidocaine-diphenhydramine-antacid medications [41] have been largely ineffective. There is some evidence to suggest that corticosteroids may play a role in treating mIAS. In a case series of eight post-renal transplant patients on sirolimus immunosuppression, clobetasol 0.05 % cream applied topically twice daily to aphthous ulcers was shown to improve symptoms immediately, and all patients experienced resolution of oral lesions within 3–7 days. Treatment with this topical steroid did not lead to any overt adverse events in these patients [41]. In another study, patients who developed mIAS on either everolimus or ridaforolimus and did not initially respond to palliative or topical steroids mostly saw improvement with either intralesional injection of steroids or systemic steroid therapy. Though two cases of pseudomembranous candidiasis developed secondary to corticosteroid therapy, both were successfully managed with fluconazole [34]. In some cases, dose reductions or temporary discontinuation of therapy is required for more severe episodes of stomatitis and is usually associated with spontaneous resolution of symptoms [27, 28, 30, 34, 35,]. In addition, patients should be counseled to maintain good oral hygiene, seek treatment of anticipated foci for infections such as periodontal disease, inform their healthcare provider of lesions greater than three in number lasting longer than 3 days or interfering with day-to-day activity, and avoid alcohol or peroxide containing products, which may exacerbate symptoms [42]. Based on sporadic literature information as well as from our personal experience, early intervention with mouthwashes may prevent progression toward severe stomatitis and thus may allow continuation of dosing with mTOR inhibitors. Stop-and-go strategies should be used as soon as a significant impact on oral intake is reported. Moreover, although mIAS tends to recur with resuming the causal agent, its severity often decreases over time, which allows continuation of treatment in patients who derive clinical benefit. Dose reduction should also be considered if previous strategies are ineffective, or if the dosing interruptions required for recovery are too protracted according to the treating physician’s assessment. Finally, patient education regarding this common side effect pertaining to its management, diet adjustment (avoidance of spicy condiments, acids, or irritants), need for maintaining an adequate hydration, etc. is paramount to avoiding related complications and for sustaining an adequate dose intensity of the mTOR inhibitor.
8.3.2 Dermatologic Toxicities
Skin rash is another commonly experienced toxicity of mTOR inhibitors. The reported incidence of skin rash has been widely variable, partly due to the disparate sample sizes between studies. A meta-analysis [43] of phase II–III randomized controlled trials (RCT) and single-arm monotherapy trials using everolimus 10 mg orally once daily for different cancers found that the incidence of all-grade rash ranged from 10.6 to 60.6 % and the incidence of high-grade (≥3) rash ranged from 0.4 to 5.3 %. When the random effects model was applied, the summary incidence of all-grade rash was 28.6 %, and when the fixed effects model was applied, the summary incidence of high-grade rash was 1 %. A similar meta-analysis [32] of phase II–III trials done on temsirolimus infusion for various cancers showed that the incidence of all-grade rash ranged from 12.5 to 72.2 % and the incidence of high-grade rash ranged from 0.6 to 4.4 %. When the random effects model was applied, the summary incidence of all-grade rash was 45.8 %, and when the fixed effects model was applied, the summary incidence of high-grade rash was 3.3 %. As ridaforolimus is a relatively newer mTOR inhibitor, no meta-analysis of the incidence of rash has been published to date. Based on available phase II–III studies on ridaforolimus use in various cancers, the incidence of all-grade rash ranged from 28.3 to 37 %, and the incidence of high-grade rash ranged from 0 to 0.6 % [44, 45].
The dermatologic toxicities of mTOR inhibitor therapy have various manifestations. In an analysis [46] of 13 patients on either everolimus or temsirolimus, it was found that the onset of rash usually occurred within the first month of treatment. Pruritus was the most common complaint, and erythematous papules and pustules were the main lesion morphologies, typically involving areas rich in sebaceous glands (Fig. 8.3) [32, 46]. The trunk was the most commonly affected area, followed by the extremities, neck, face, and scalp. A variant presentation of rash is erythematous plaques often developing in the antecubital and popliteal folds, characteristic of eczematous or psoriasiform rashes [46]. Generally, skin toxicity resolved spontaneously during treatment and often did not require dose reduction or delay in treatment [20]. Although it has been suggested that the presence of a rash in epithelial growth factor receptor (EGFR) inhibitor therapy may be a surrogate marker for drug activity as rash development has been correlated with treatment response [47], there is no known association between rash severity and treatment response to mTOR inhibitors [46].
Fig. 8.3
mTOR inhibitor-induced rash manifesting as (a) erythematous papules on the chest and (b) pustules on the back [46]
The etiology of mTOR inhibitor-related rash remains unclear. In clinical studies with everolimus, biopsies of papulopustular lesions were consistent with a suppurative folliculitis, whereas biopsies of erythematous papules and maculopapular rashes showed perivascular inflammation with eosinophils [46]. Biopsies of eczematous-type lesions seen with either everolimus or temsirolimus demonstrated psoriasiform and spongiotic dermatitis patterns with eosinophilic infiltration, which are commonly seen in eczematous processes (Fig. 8.4) [46, 48]. In other studies with temsirolimus, biopsies of acneiform lesions showed nonspecific accumulation of neutrophils in the dermis and epidermis [20]. Given the morphologic similarities between the rashes of mTOR inhibitors and EGFR inhibitors, there has been a degree of extrapolation of the pathophysiology behind mTOR inhibitor-related rash from studies on EGFR inhibitors. In EGFR inhibitor-associated rash, the most common manifestation is an acneiform or papulopustular rash that has a predilection for sebaceous areas in the scalp, face, and upper trunk, which have high levels of EGFR expression [49]. The rash initially starts as erythema and swelling and progresses to acne-like appearance with central purulence [49]. It is believed that EGFR inhibition in basal keratinocytes disrupts cellular growth and migration; subsequent inflammatory changes and cell detachment result in dysesthesia and development of the papulopustular rash [49]. As mTOR inhibition has been shown to disrupt epidermal growth factor-induced cell transformation 50], it has also been hypothesized that the overlap between the Akt/mTOR and EGFR pathways may potentially explain the mechanism of mTOR inhibitor-associated rash [20, 43]. In another theory, a basic science study found that mouse skin keratinocytes with depressed Akt/mTOR signaling activity were smaller in size and have decreased protein translation [51], potentially playing a role in the development of rash. Other authors suggest a possible delayed-type hypersensitivity reaction as a cause for rash, especially given peripheral eosinophilia seen in certain patients [43]. Further studies are needed to elucidate the pathway behind mTOR inhibitor-related rash.
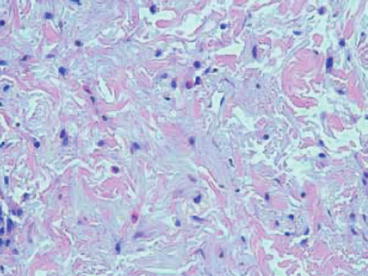
Fig. 8.4
Biopsy of a temsirolimus-induced skin rash showing spongiotic dermatitis with eosinophils [48]
There has been no consensus on optimal management of cutaneous toxicities. Some authors recommend basing the approach to treatment of skin lesions on clinical phenotype [46]. For grade 1 papulopustular and maculopapular rashes, topical steroids and antibiotics may be useful. For intolerable grade 2 as well as grade 3 rashes, oral antibiotics such as minocycline or doxycycline, oral steroids, and dose modification or reduction may be considered [33, 46].
Aside from the aforementioned rashes, other dermatologic toxicities of mTOR inhibitors also occur quite frequently and include skin dryness, skin discoloration, and nail disorders such as thinning, dystrophy, and paronychia (Fig. 8.5) [20, 33, 52]. The incidence of mTOR inhibitor-related nail disorders has ranged from 5 to 18 % with everolimus [24, 53] and 14 to 46 % with temsirolimus [10, 16, 20, 54]. Topical steroids have shown some effect against paronychia [52]. Skin dryness may be managed conservatively with fragrance-free moisturizer lotion [55]. Hot water and harsh soaps that may dry the skin should be avoided [32].

Fig. 8.5
Fragile nails, paronychia, and leukonychia of the first digit in a patient with temsirolimus-induced onychopathy [52]
8.3.3 Pneumonitis
Pulmonary toxicities have been linked to mTOR inhibitors even with the early course of sirolimus use in post-renal transplant immunosuppression [56]. Noninfectious pneumonitis, sometimes referred to simply as “pneumonitis,” is now a known class effect of mTOR inhibitors and is seen with usage of sirolimus, everolimus, temsirolimus, and, most recently, ridaforolimus [28, 57, 58]. The reported incidence of pneumonitis from mTOR inhibitors varies across the different agents. Data from the RECORD-1 phase III trial with everolimus in advanced renal cell carcinoma (ARCC) found that of 274 patients receiving everolimus, 37 patients (13.5 %) developed pneumonitis (all grades included), ten (3.6 %) of which were grade 3; no grade 4 pneumonitis was seen; and no patients in the placebo arm developed pneumonitis. Of these 37 patients, 19 (51.4 %) had cough, 16 (43.2 %) had dyspnea, and 12 (32.4 %) had both cough and dyspnea [58]. Meanwhile, data from the Global ARCC trial [59] comparing interferon alpha and temsirolimus found that of 208 patients on temsirolimus, only four patients (2 %) were diagnosed with temsirolimus-related symptomatic pneumonitis [55]. In regard to ridaforolimus, a phase I/II study found that pneumonitis attributable to treatment occurred in ten (6.8 %) of 147 patients [28].
Clinically, the most common symptoms associated with pneumonitis are dyspnea on exertion and dry cough [33]. Other systemic manifestations such as hypoxemia, fever, and fatigue may occur as well [57]. The median time to onset of pneumonitis after treatment initiation has been shown to be 108 days, though can range from about 3 to 37 weeks [60]. In many cases, pneumonitis can be asymptomatic and only detected on imaging studies. In fact, a higher percentage of new pulmonary radiographic findings were seen even in asymptomatic patients on everolimus when compared to patients on placebo (38.9 vs. 15.2 %) [58]. Similarly, in a subsequent retrospective radiographic review of chest imaging on patients in the Global ARCC trial with temsirolimus, it was found that 52 (29 %) of 178 evaluable patients actually had radiographically identified drug-related pneumonitis, despite the previously reported incidence of 2 % [61]. These findings suggest that asymptomatic pneumonitis from temsirolimus and likely other rapalogs occurs more frequently than physicians may recognize.
Early in the course of pneumonitis, characteristics seen on pulmonary imaging are often discreet and nonspecific [57]. On chest computed tomography (CT), the most common abnormalities seen are multifocal, patchy ground-glass opacities, inter- or intralobular septal linear thickening, and multifocal lung parenchyma consolidation in more advanced cases (Fig. 8.6) [57, 61, 62]. These lesions have a predilection for the lung base and periphery, are often asymmetric, and usually affect multiple lobes bilaterally [57, 61]. Less commonly, pleural effusions can be seen especially during the early course of mTOR inhibitor therapy [57]. When pulmonary function testing (PFT) is performed, a mildly reduced diffusing capacity of the lungs for carbon monoxide (DLCO) is observed, which can be a sensitive parameter for early pneumonitis [62].
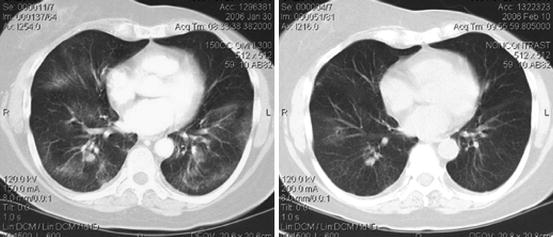
Fig. 8.6
Ridaforolimus-induced pneumonitis (left) with radiographic resolution (right) 10 days after treatment withheld [7]
Histologically, bronchoalveolar lavage (BAL) and transbronchial biopsies of patients who developed pneumonitis on mTOR inhibitors showed several features, with pulmonary alveolar hemorrhage, organizing pneumonia, and lymphocytic pneumonitis seen most commonly [58, 63]. Typically, infectious workup failed to identify any bacterial, fungal, viral, or other pathogenic organisms. Autoimmune serologies such as ANA, p-ANCA, c-ANCA, and anti-GBM antibodies were also frequently negative [63].
The mechanism behind mTOR inhibitor-induced pneumonitis is not yet well elucidated, though a few hypotheses do exist. In mouse models, it was found that rapamycin enhances lung injury and cellular apoptosis in the setting of lipopolysaccharide (LPS) exposure through induction of the proapoptotic transcription factor STAT1 [64]. In another hypothesis, Pham et al. describe a T-cell mediated, delayed-type hypersensitivity as a possible mechanism [63]. Although sirolimus itself is not likely to induce an immune response, its combination with plasma proteins may increase its immunogenicity as a hapten. The protein-sirolimus complex is processed by pulmonary antigen-presenting cells, which induces preferential differentiation of Th0 to Th1 over Th2. Subsequent exposure to sirolimus may then result in increased antigen presenting to Th1 cells. The activation of Th1 cells then causes the release of Th1 cytokines and recruitment of macrophages and other inflammatory cells, thereby causing the damage seen in mTOR inhibitor-induced pneumonitis [63].
A number of treatment recommendations and algorithms have been described to help manage pneumonitis seen with mTOR inhibitor use [42, 57, 58]. In general, infectious etiologies, including “atypical pneumonia,” should always be ruled out before considering mTOR inhibitor pneumonitis. For example, Pneumocystis jirovecii infection should be ruled out in patients with CD4+ cell counts of less than 200 per μL, as should Legionella infection in hospitalized patients [42]. In the presence of fever, infection biomarkers such as pro-calcitonin levels can be obtained to determine infectious versus noninfectious causes [42]. Based on recommendations gleaned from experience with the RECORD-1 trial as well as toxicity data from other pivotal studies, Albiges et al. generated a decision tree for management of mTOR inhibitor-related pneumonitis [57]. Prior to initiation of an mTOR inhibitor, baseline imaging with chest plain radiograph and high-resolution CT (HRCT) are recommended. In patients with pulmonary conditions at baseline, PFTs should be obtained. In asymptomatic grade 1 patients who are found to have abnormal findings suggestive of interstitial lung disease on routine imaging, the authors recommend educating the patient to increase awareness of symptoms; no specific dose adjustments are necessary. With grade 2 symptoms, the authors suggest subdividing this nonuniform category further into grade 2a (slight-to-moderate cough that does not affect activities of daily living) and grade 2b (severe cough and dyspnea on exertion with or without hypoxemia that begin to affect activities of daily living). Patients with grade 2a pneumonitis should initially be monitored clinically at 2 weeks and radiographically at 4 weeks. Subsequently, an HRCT scan should be performed every 6–8 weeks. Dose reduction is unnecessary especially if the patient has seen improvement from the drug, though this would be at the physician’s discretion. For grade 2b symptoms, initial clinical monitoring should occur at 1 week and imaging at 2 weeks. Dose reduction here should be based on the clinical situation and how rapidly the pneumonitis progressed. Bronchoscopy and BAL should be considered, as should the use of systemic corticosteroids depending on the overall clinical picture. Follow-up HRCT scans should be done every 4 weeks until symptoms resolve. For patients experiencing grade 3 pneumonitis (severe cough and dyspnea on exertion that interfere with ADL or cause supplemental oxygen requirements) or grade 4 pneumonitis (life-threatening symptoms), the authors recommend immediate treatment interruption and admission to the hospital. When infectious etiologies and disease progression have successfully been ruled out, corticosteroids such as oral prednisolone and intravenous methylprednisolone should be administered. Antibiotics should also be started if a concurrent infection is suspected. In case of grade 3 pneumonitis, if mTOR inhibitor treatment has been shown to have therapeutic benefit, the drug may be restarted at a reduced dose after symptom resolution. If the reduced dosing does not appear to be therapeutic, a dose re-escalation may be considered if corticosteroids are administered concurrently and if pneumonitis does not reoccur. For patients who experienced grade 4 pulmonary toxicity, the causative agent should be permanently withdrawn, and switching to another mTOR inhibitor is not recommended as the risk of recurrence is considerable. HRCT scans for both grade 3 and 4 pneumonitis should be done at 4-week intervals until resolution of symptoms [57]. In terms of reversibility, the RECORD-1 trial using everolimus found that most patients with pneumonitis saw symptom resolution with dose reduction or treatment discontinuation [58].
Related posts:
 The Role of mTOR Inhibitors in Neuroendocrine Tumors
The Evolving Role of Mammalian Target of Rapamycin (mTOR) Inhibitors in Renal Cell Carcinoma
The Role of PI3K/AKT/mTOR Inhibitors in the Treatment of Hematological Malignancies
Potential Future Indication of Rapamycin Analogs for the Treatment of Solid Tumors
The Role of mTOR Inhibitors in Neuroendocrine Tumors
The Evolving Role of Mammalian Target of Rapamycin (mTOR) Inhibitors in Renal Cell Carcinoma
The Role of PI3K/AKT/mTOR Inhibitors in the Treatment of Hematological Malignancies
Potential Future Indication of Rapamycin Analogs for the Treatment of Solid Tumors
 Predictive Biomarkers of Response to mTOR Inhibitors
 Rational Combinations of mTOR Inhibitors as Anticancer Strategies
Stay updated, free articles. Join our Telegram channel

Full access? Get Clinical Tree


