Background
The syndemic of injection drug use (IDU) and HIV infection has been well recognized since the origin of the HIV epidemic. Although transmission in persons who inject drugs (PWID) was documented in 1977 [ ], phylogenetic analysis suggests that the HIV infection was circulating in this population as early as 1970 [ ]. Following rapid spread in this population, it is estimated that at least 100,000 PWID were infected when AIDS was first recognized in 1981, with estimates of HIV infection in PWID ranging from 900,000 to 4.8 million worldwide. At that time, HIV seroprevalence was estimated at 50% in the IDU population in New York City [ ]. Since then, it has been established that IDU is one of the most efficient methods of HIV transmission, behind only blood transfusion and unprotected receptive anal intercourse [ ]. Once introduced, HIV spreads rapidly through a population of PWID, with little genetic variation [ , ]. Incidence rates of up to 10 to 31/100 person-years have been observed in Bangkok [ ], Vancouver [ ], and Tallinn [ ], while other communities have seen HIV prevalence increase up to 50% within 6–24 months, including Kathmandu [ ], Manipur [ ], Kiev [ ], and Rio de Janeiro [ ]. While these outbreaks have occurred in urban and not rural areas, they serve as an example of how rapidly HIV infection can disseminate in these at-risk populations.
Factors that have been associated with the rapid spread of HIV in communities include limited knowledge of risk, limited access to sterile injection equipment, and large, frequently changing networks of injection partners [ ]. While not all factors must be present for an HIV outbreak to occur in PWID, a number of these (frequently modifiable) factors are typically present [ ].
Outbreak
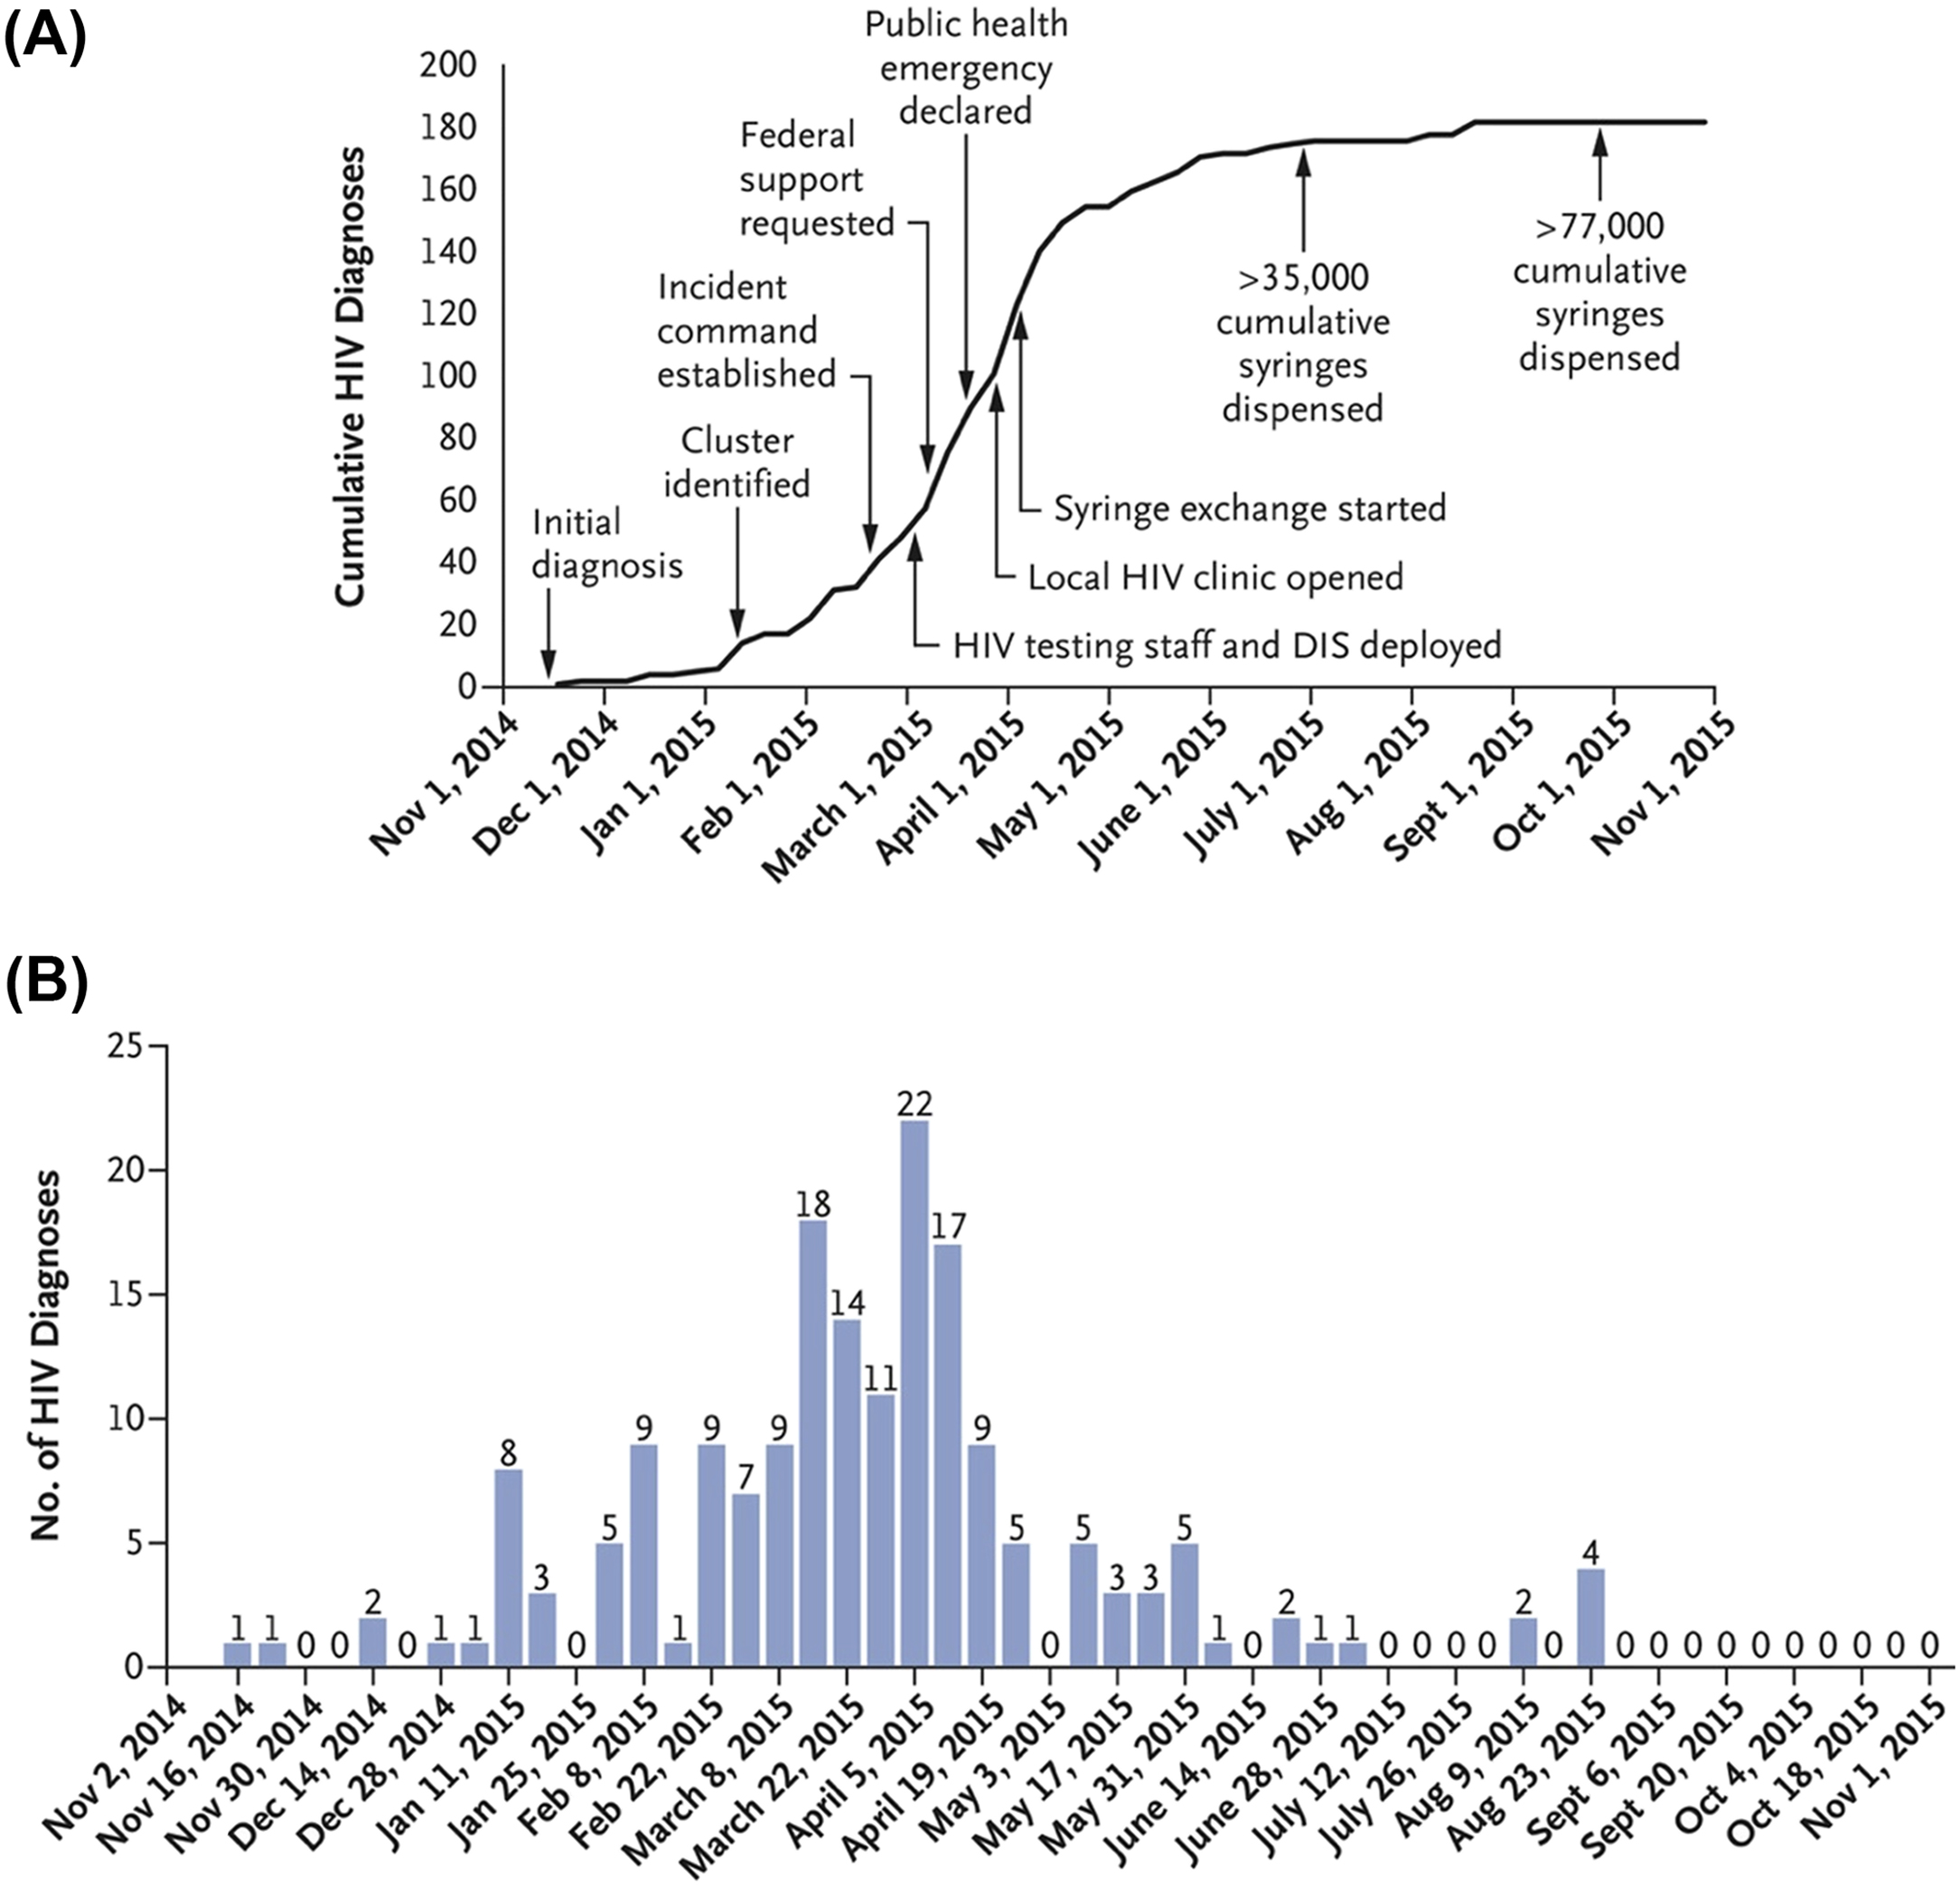
In December 2014, a physician in Austin, Indiana, identified two new diagnoses of HIV infection, shortly followed by a third case. These were quickly followed by 8 others and by the end of March 2015, 68 new cases of HIV infection had been identified [ ]. By November 1, 2015, 181 cases had been diagnosed [ ], with 205 cases by September 2016 [ ] and 215 by March 2, 2017 [ ] ( Fig. 2.1 ).
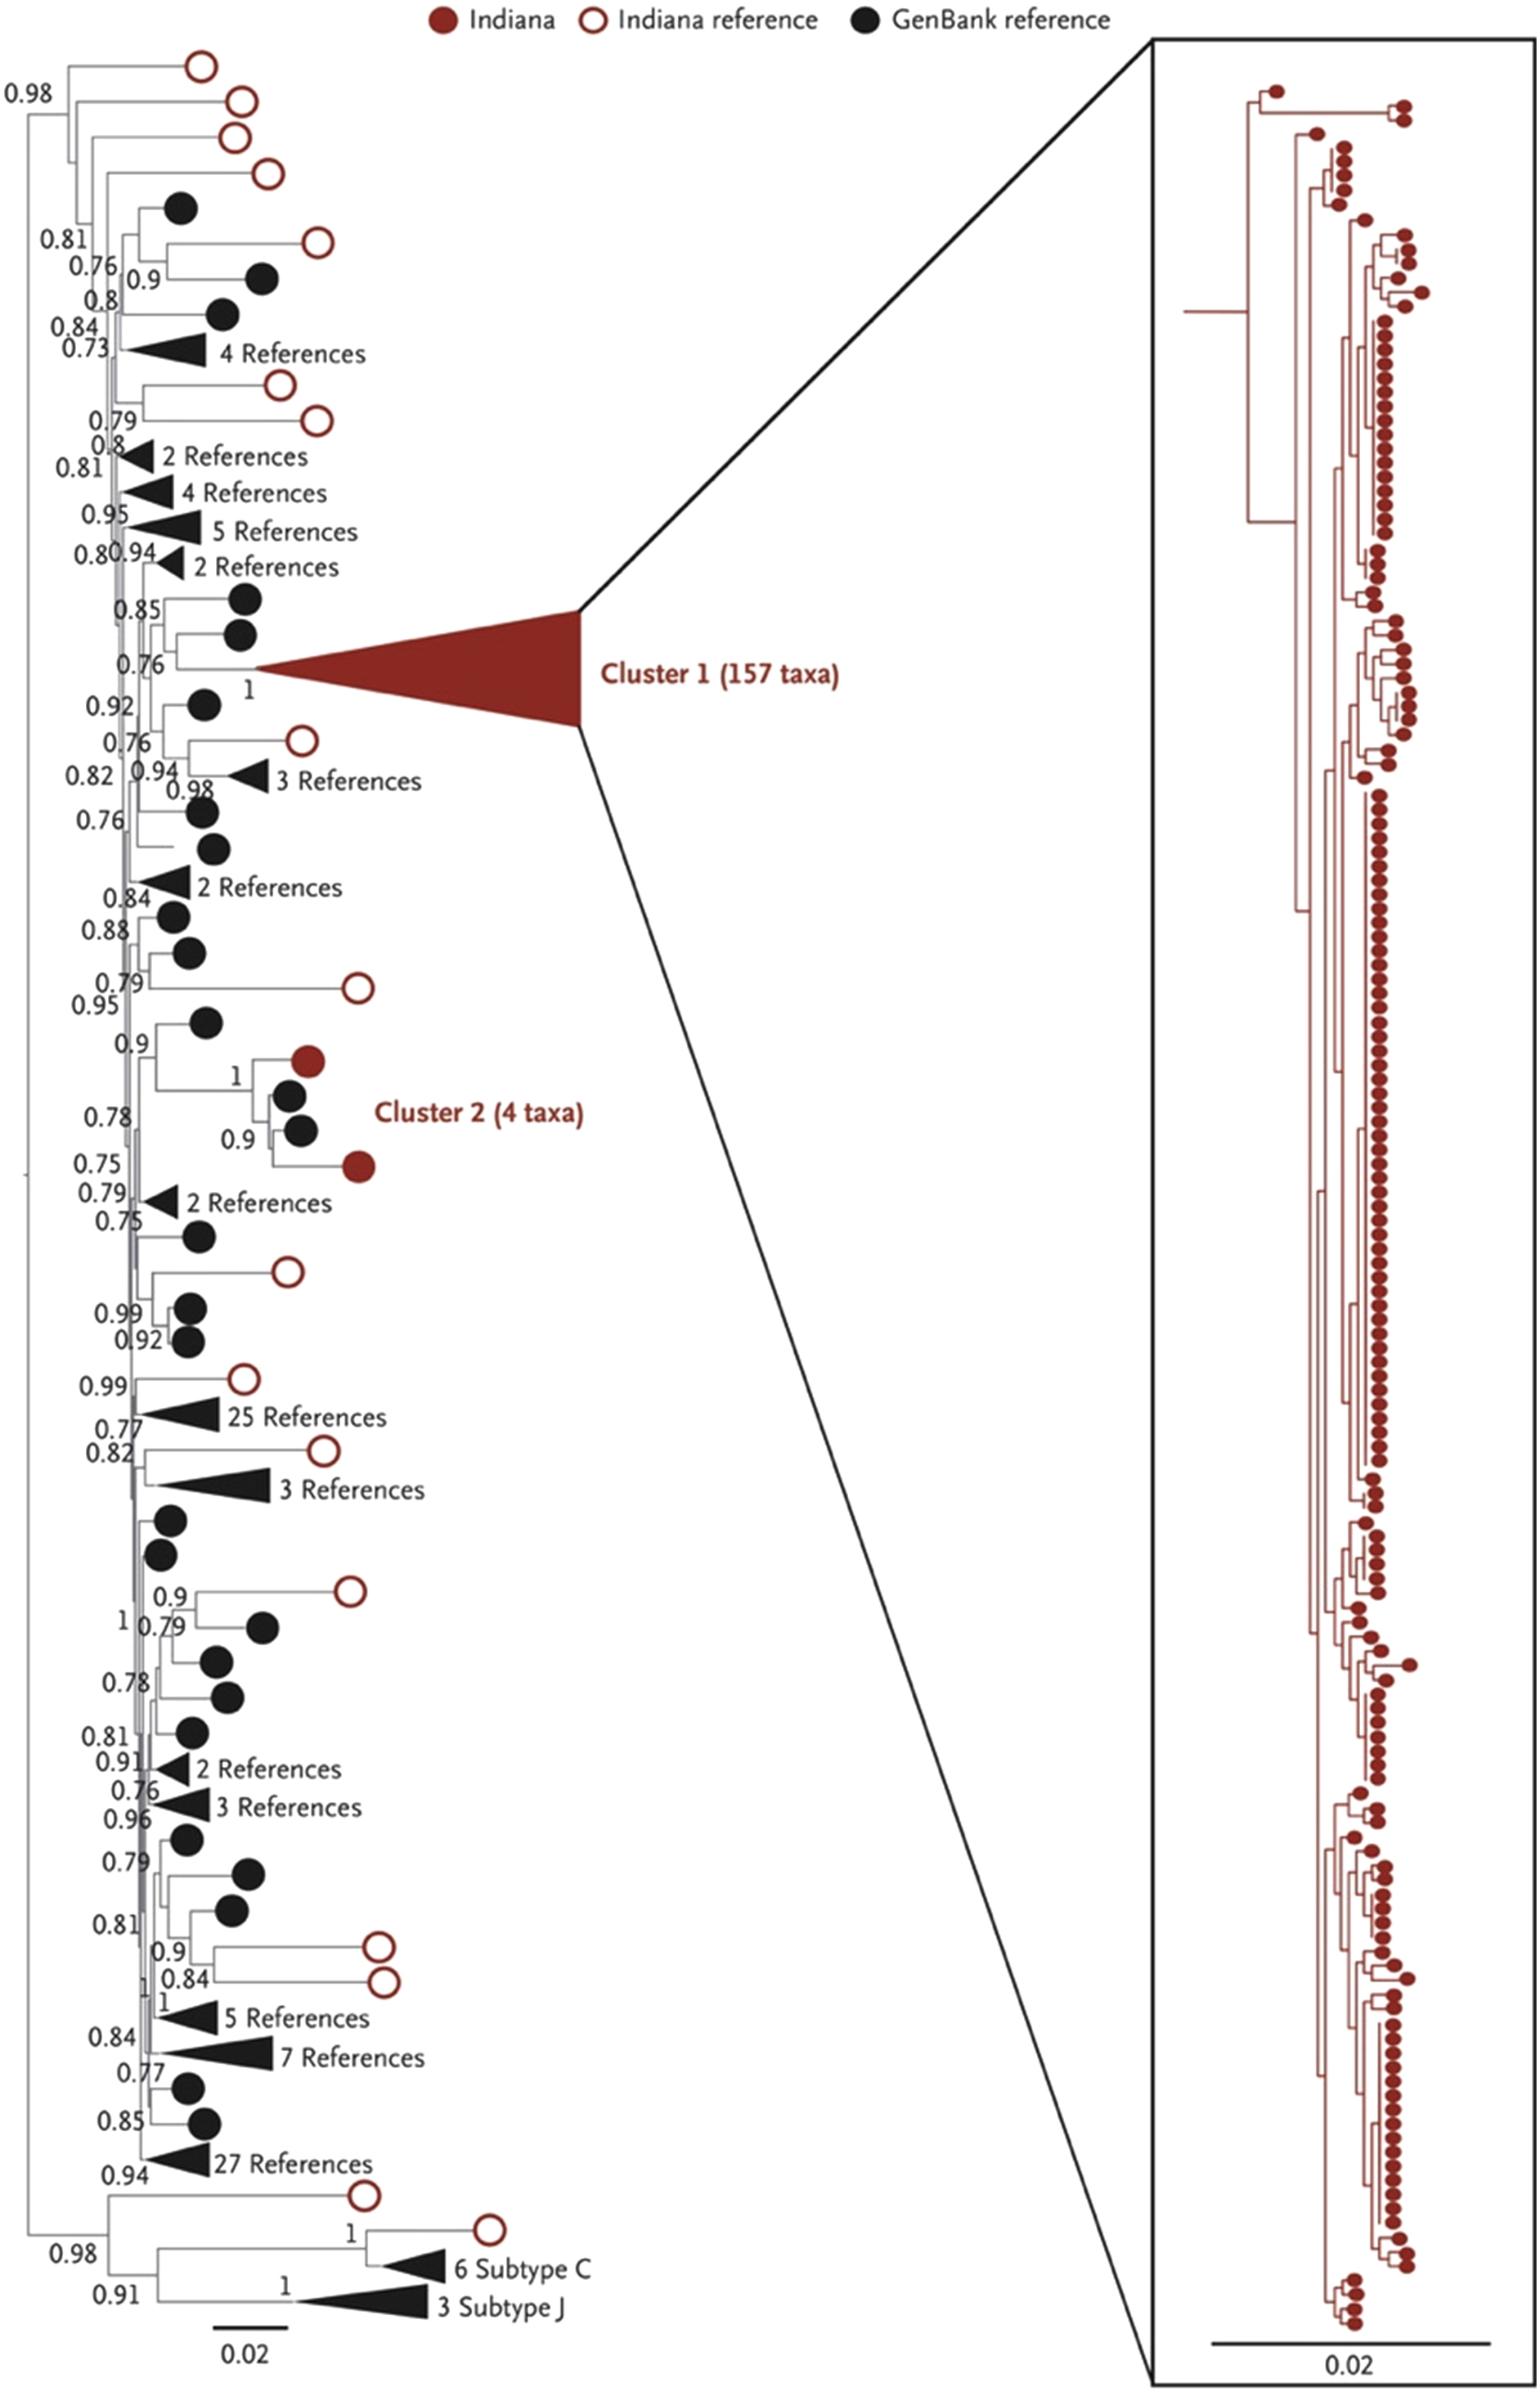
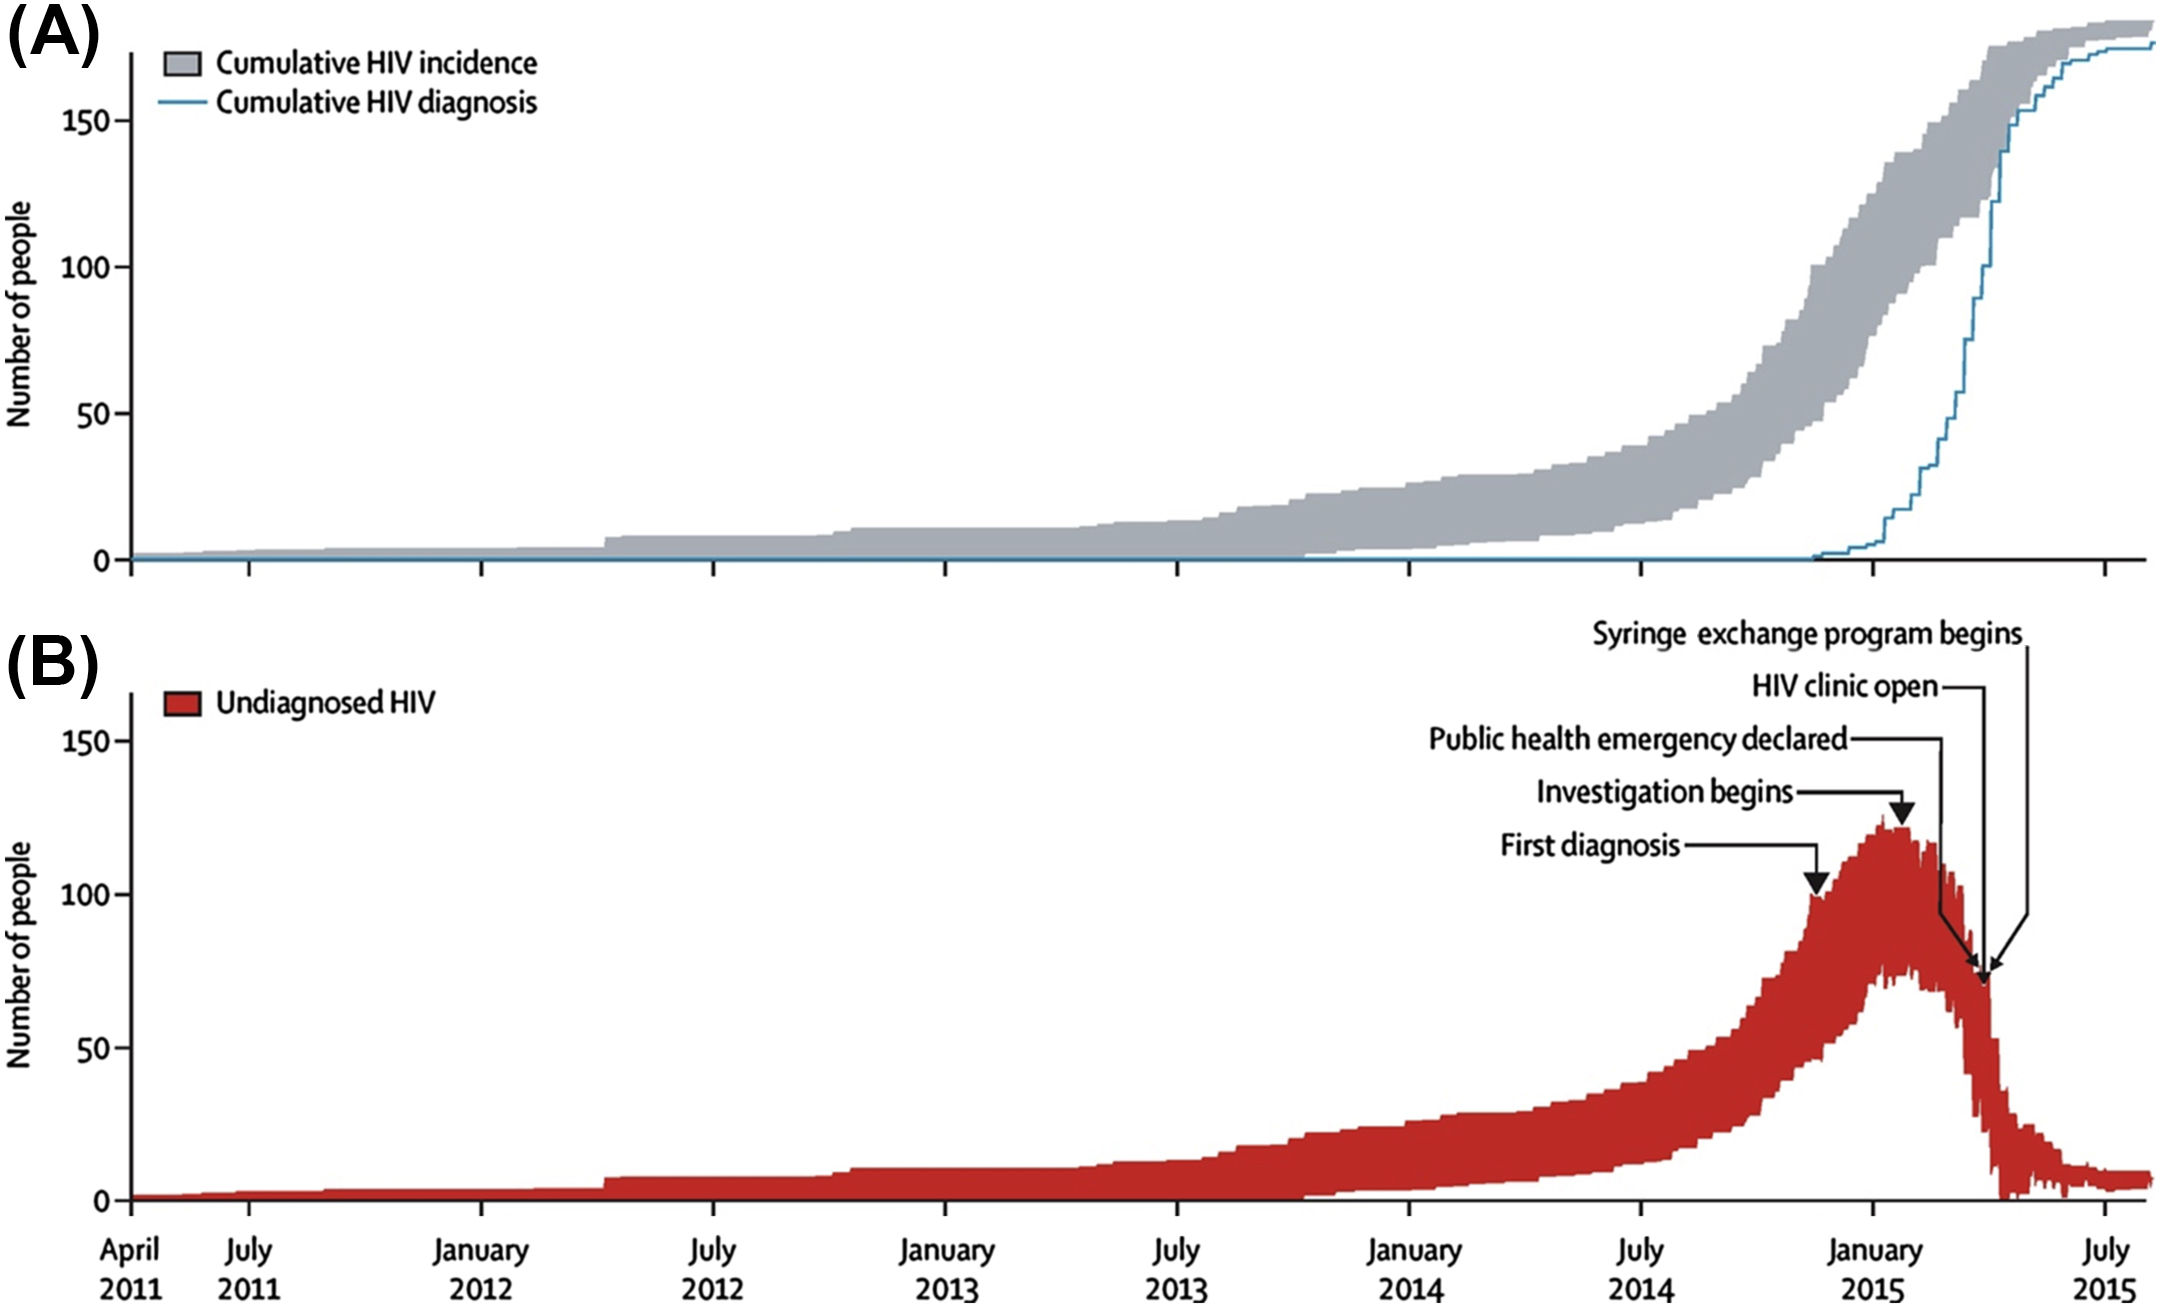
Subsequent phylogenetic analysis revealed a sequence homology of over 99.5%, confirming a single common source of the outbreak while laboratory and clinical evaluation of most newly diagnosed patients was consistent with infection within 2–6 months of diagnosis [ ]. Further phylodynamic analysis indicated an initial introduction into a tight network of PWID via high-risk sexual contact at some point in 2011 and rapid expansion in mid-2014, with most transmission events having occurred by early 2015 before the declaration of a public health emergency on March 26, 2015 [ ] ( Fig. 2.2 ).
The nature of the opioid itself and the associated injection practices contributed significantly to the rapid spread of HIV. In Austin, a sustained-release formulation of oxymorphone (Opana ER) was used. Oxymorphone is a semisynthetic μ-opioid agonist first approved in the United States in 1959. It was initially available only in injectable and rectal forms but was subsequently made available in both immediate- and extended-release oral formulations [ , ]. The injectable formulation has an onset of action within 5 min, has a half-life of 3–6 h, and is approximately 30-fold more potent than oral morphine [ , ]. The extended-release formulation utilized a novel proprietary drug matrix (TIMERx) that provided a different pharmacokinetic profile than either the injectable or the immediate-release oral formulation. This matrix consisted of a xanthan and locust bean gum–derived hydrophilic polymer that resulted in the gradual degradation of the matrix and release of the active medication [ ]. This formulation was marketed as “abuse deterrent” and was intended to prevent immediate release of all active drugs following crushing and insufflation [ ]. Owing to community perceptions of this medication being “safer” (i.e., a pharmaceutical product manufactured under sterile conditions without adulteration), it rapidly became the preferred agent for nonprescription use in this community [ ]. This required complex processing of the extended-release tablets to obtain oxymorphone for injection, consisting of “browning” or slow heating of the tablet, followed by solubilization with water and finally, injection. As the resulting solution was poorly soluble in water, the total volume required multiple “takes” (drawing up and injecting) per episode. Frequently, users described using two to three “flushes” to obtain all the drug present in a single quarter tablet. Furthermore, owing to the high cost of the drug, a single delayed-release tablet was shared among multiple—frequently between two and four—injection partners [ ], and given the high potency and short half-life of the injected oxymorphone, withdrawal symptoms were faster and more severe, requiring between three and seven injection episodes per day. This combination of multiple users sharing a single tablet, multiple injections required per episode, short high and rapid, intense withdrawal combined to provide an ideal situation that promoted frequent nonsterile injection practices associated with the transmission of hepatitis C virus (HCV) and HIV infections [ ]. HIV subsequently spread rapidly in this population and was further amplified among those who participated in transactional sexual activity (up to 25% of the HIV-infected women in this outbreak) [ , ]. This finding of high levels of transactional sexual activity and IDU has also occurred in other populations with high incident rates of HIV and HCV infection [ ]. This level of transactional sexual activity, combined with the frequent injections and close network of PWID mentioned earlier, further enhanced the spread of HIV infection in this community.
An outbreak similar to Scott County occurred in London, Ontario. This outbreak was strongly associated with the illicit injection of sustained-release hydromorphone, with the microcrystalline cellulose present in the sustained-release tablets serving to prolong the viability of HIV present [ ]. As in the Scott County experience, the sustained-release hydromorphone preparation was poorly soluble in aqueous solution, so the preparation for injection also required multiple steps, in this case including crushing, heating, suspending in water, and passing through a cotton filter to remove particulate matter, and owing to the high volume required for solubilization, multiple injections were frequently shared [ , ].
Burden of injection drug use throughout the United States and the world, and association of injection drug use with HIV and hepatitis C virus infections
An accurate assessment of the burden of IDU is difficult for many reasons, including social stigma, lack of access to healthcare, poor economic status, and potential legal challenges. Evaluation of this population is, however, increasingly important, given not only their need for medical care but also the potential for this group of people to function as a reservoir for transmission of infectious diseases to both IDU and non-IDU populations. It is estimated that 2.6% of the US population has ever injected drugs, with 0.3% having done so within the past 12 months [ ]. The current global prevalence of IDU is estimated at 15.6 million, with 17.8% infected with HIV, 52.3% infected with HCV, and 9% chronically infected with hepatitis B virus [ ].
Acute hepatitis C virus infection and injection drug use in areas at risk for HIV outbreaks
As acute HCV infection is one of the more common sequelae of nonsterile injections, it serves as a surrogate marker for both IDU and areas at high risk for HIV infection. The Scott County outbreak ultimately resulted from the introduction of HIV into a closely related, preexisting network of PWID with extensive circulation of HCV, with 1.7% of Scott County residents using injection drugs and 92% of the new HIV cases coinfected with HCV [ ]. This is consistent with findings from other high-risk rural counties, such as Cabell County, West Virginia, with 2.4% of the population reporting IDU and half of them reporting such use within the past 6 months [ ]. In prior studies the illicit use of prescription opioids has been identified as an independent risk factor for the acquisition of HCV, with the use conferring an absolute risk increase of 36% during a recent outbreak in New York state; notably, the risk of using prescription opioids was significantly higher than with the use of methamphetamine, cocaine, or heroin [ ]. Among prescription opioids associated with HCV infection, sustained-release oxymorphone was most commonly used, as was seen in Scott County [ ].
In the United States, rates of acute HCV infection had fallen through 2005, but beginning in 2006, acute HCV infection rates have dramatically increased predominantly among individuals aged 20–29 years, although significant increases in individuals aged 30–39 years have also been noted. It is estimated that 70% of incident HCV infection in the United States since 2006 is due to IDU [ , ] and that 43% of HCV infections between 2018 and 2030 will also be due to IDU, with the impact greater in moderate- to high-income countries (79%) than in low-income countries (38%) [ ].
In the United States, these increases have been most dramatic in predominantly non-urban areas in the eastern states with historically low rates of HIV infection, including Indiana, Kentucky, Tennessee, Virginia, and West Virginia. Following the Scott County outbreak, a Centers for Disease Control and Prevention (CDC) analysis was undertaken to determine whether other counties are at risk for future similar outbreaks. To date, 220 rural counties in 26 states have been identified as “high risk” for an HIV and/or HCV outbreak. Over 50% of these rural counties are in central Appalachia, including 28 of 55 counties (51%) in West Virginia, 54 of 120 counties (45%) in Kentucky, and 41 of 95 counties (43%) in Tennessee [ ].
The Scott County outbreak is a clear illustration of the changing demographics of HIV infection in PWID, centered in a rural town (the population of Austin is approximately 4200) with 10% unemployment, 19% living below the poverty threshold, and low levels of educational attainment with over 20% not finishing high school [ ]. Additional barriers in rural counties include significant distances between social service programs and those in need exacerbated by poor access to transportation, and limited infrastructure for HIV testing, diagnosis, and care.
Management of HIV outbreaks, methods for amelioration of existing outbreaks, and prevention of future outbreaks
The core of the initial management of outbreaks is community engagement, with access to treatment for opioid use disorder (including medication-assisted treatment [MAT] and syringe services programs [SSPs]). This is particularly challenging in rural settings, with significantly limited availability of SSPs and difficulty accessing the few that do exist, and poor coverage of MAT. At the time of the Austin outbreak, there was no available SSP in the entire state of Indiana and possession of syringes was a felony, so they were frequently reused. Governmental action to establish an SSP was taken in response to the outbreak, although it was delayed and uncoordinated, and impaired by conflicts with local law enforcement. These difficulties were ameliorated in part following changes in law as well as declaration of a public health emergency, although SSP implementation continued to face challenges from local law enforcement. Unfortunately, SSP implementation did not occur until the tail end of the outbreak, following the majority of the transmission events.
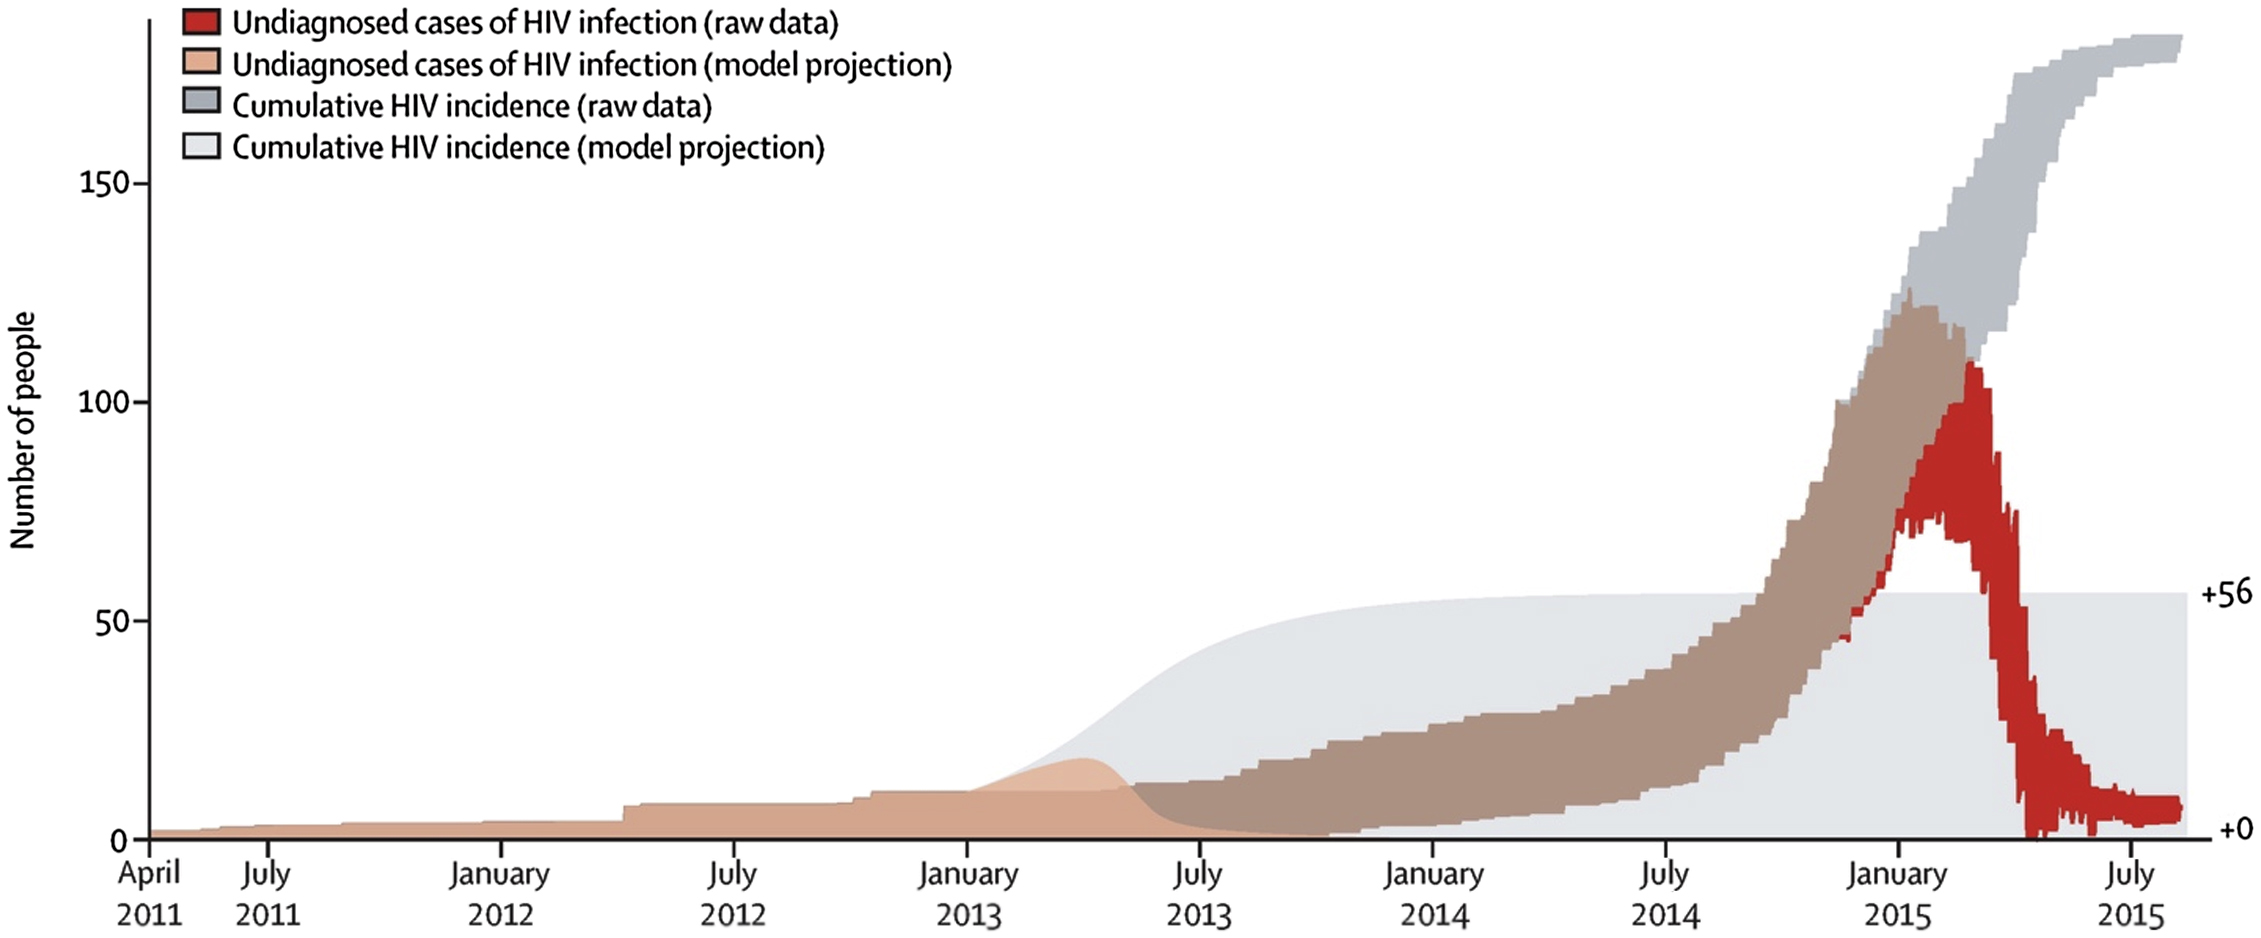
As it has been suggested that earlier implementation of SSP or the presence of a preexisting SSP would have prevented or ameliorated the outbreak, multiple modeling studies have been performed to evaluate the outcome at various earlier possible timepoints of SSP implementation. If the SSP were implemented in 2013, the outbreak would likely have been reduced to 56 cases or fewer, while if it had been implemented in 2011, it would have likely reduced the total number of cases to less than 10 [ ] ( Figs. 2.3 and 2.4 ).

Stay updated, free articles. Join our Telegram channel

Full access? Get Clinical Tree


