- 19.1 Introduction
- 19.2 Investigation of immunoglobulins
- 19.2.1 Quantitation of immunoglobulins
- 19.2.2 Qualitative investigation of immunoglobulins
- 19.2.1 Quantitation of immunoglobulins
- 19.3 Investigation of complement and immune complex disorders
- 19.3.1 Assays for individual components
- 19.3.2 Detection of complement breakdown products
- 19.3.3 C3 nephritic factor
- 19.3.4 Functional assays
- 19.3.5 Direct immunofluorescence for immune complexes in tissues
- 19.3.1 Assays for individual components
- 19.4 Antibodies to microbial antigens
- 19.5 Detection of autoantibodies
- 19.5.1 In serum
- 19.5.2 Biopsy material
- 19.5.1 In serum
- 19.6 Tests for allergy and hypersensitivity
- 19.6.1 Antigen-specific IgE antibodies
- 19.6.2 Basophil activation test
- 19.6.3 Serum tryptase
- 19.6.4 Total serum IgE
- 19.6.5 Precipitating antibodies
- 19.6.1 Antigen-specific IgE antibodies
- 19.7 Assessment of lymphocytes
- 19.7.1 Quantification of lymphocytes
- 19.7.2 Functional tests
- 19.7.1 Quantification of lymphocytes
- 19.8 Assessment of neutrophils and monocytes
- 19.8.1 Neutrophil and monocyte quantification
- 19.8.2 Functional tests
- 19.8.1 Neutrophil and monocyte quantification
- 19.9 Recombinant DNA technology in clinical immunology
- 19.9.1 DNA analysis
- 19.9.2 Diagnostic implications
- 19.9.3 Genomics and microarrays
- 19.9.1 DNA analysis
- 19.10 Histocompatibility testing
 Visit the companion website at www.immunologyclinic.com to download cases with additional figures on these topics.
19.1 Introduction
There are clinical immunology laboratories across the world that not only provide numerical and qualitative data but also expert clinical understanding for physicians and paediatricians for whom there is little training in laboratory techniques or interpretation. In order to provide a clinically relevant service, only those tests that are actually useful are included in the repertoire. However, requesters often ask for a test described in a recent paper or available in a research laboratory, so it is important to understand why particular tests are done as well as not done. Laboratory tests can be graded according to their value in the care of patients. Some tests are essential for diagnosis or monitoring, some are useful in sub-classifying disorders with varying complications or outcomes, and others are of current research interest, but may provide added diagnostic insight in future. Unfortunately, tests are useless if requested in inappropriate circumstances and this applies particularly to uncritical requests such as ‘autoantibody screens’. Nobody highlighted the problem better than the late Dr Richard Asher over 50 years ago (Box 19.1).
- I order this test because if it agrees with my opinion I will believe it, and if it does not I shall disbelieve it
- I do not understand this test and am uncertain of the normal figure, but it is the fashion to order it
- When my chief asks if you have done this or that test I like to say yes, so I order as many tests as I can to avoid being caught out
- I have no clear idea what I am looking for, but in ordering this test I feel in a vague way (like Mr Micawber) that something might turn up
- I order this test because I want to convince the patient there is nothing wrong, and I don’t think he will believe me without a test
Asher R (1954) Straight and crooked thinking in medicine. Br Med J ii, 460–2.
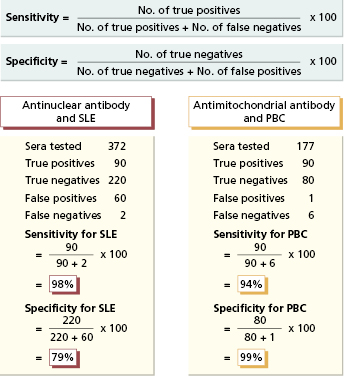
Laboratory tests differ in their sensitivity and specificity (Fig. 19.1). For optimal results, the cut-off point for any assay – the point above which results are considered positive – is set so that virtually no diseased patients are test-negative (false-negative results) and the fewest possible individuals without the disease are test-positive (false-positive results). The sensitivity of a test is defined as the proportion of diseased individuals in whom the test is positive. A negative result in a very sensitive test can be used to exclude the relevant disease (‘rule-out’). Test results should be negative not only in healthy people but also in individuals with diseases with similar clinical features but different natural histories. The specificity of a test is the proportion of individuals without a given disease in whom the test is negative. A positive test is then virtually restricted to the disease in question (‘rule-in’) and tests of high specificity, such as antimitochondrial antibody (AMA) (Fig. 19.1), can be used to confirm the clinical diagnosis.
Fig. 19.1 Sensitivity vs. specificity of assays illustrated by antinuclear antibody testing for systemic lupus erythematosus (SLE) and antimitochondrial antibody (AMA) testing for primary biliary cirrhosis (PBC).
Of the assays described in this chapter, some are quantitative and others are qualitative. Quantitative assays produce precise results. In general, such assays can be automated and international reference preparations are available to standardize results. Qualitative assays provide answers of normal/abnormal or positive/negative type. They can involve considerable technical expertise and interpretation of results can be subjective. Both types of assays are subject to internal quality control as all laboratories have to ensure the quality and accuracy of results or a result is useless for an individual patient. Quality assurance (QA) is achieved by participation in External Quality Assessment Schemes (EQASs), which may be organized on a regional, national or international basis. Without these assurances, any clinical laboratory might as well toss a coin to gain a result.
19.2 Investigation of immunoglobulins
19.2.1 Quantitation of immunoglobulins
Serum immunoglobulin measurements are essential in patients with repeated or severe infections and those with myeloma and some other lymphoproliferative disorders. They are sometimes useful in the differential diagnosis of hypergammaglobulinaemic states (Table 19.1).
Table 19.1 Examples* of major polyclonal elevations in immunoglobulin levels
| Immunoglobulin | Example |
|---|---|
| IgM | Primary biliary cirrhosis |
| IgA | Alcoholic liver disease |
| IgG | Primary Sjögren’s syndrome |
| HIV infection | |
| Systemic lupus erythematosus | |
| Mixed isotypes | Tuberculosis |
| Hepatic cirrhosis | |
| Chronic bacterial infections/occult abscesses |
*But not sufficiently specific to be of diagnostic value in individual patients.
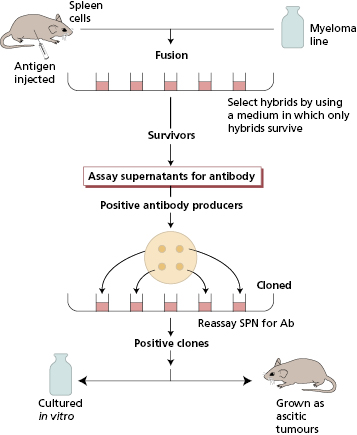
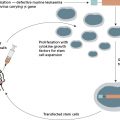
The classical techniques used for measurement involve immune-complex formation with antisera specific for the protein, in this case the human immunologlobulin isotype, to be measured. These antisera may be raised in animals by injection of the relevant antigen. Animals respond by making polyclonal antibodies, i.e. the resultant sera contain mixtures of antibodies from different B-cell clones and all the antibodies react with the relevant antigen but vary in the precise nature of their variable regions. In contrast, monoclonal antibodies are the product of a single cell and its progeny and are therefore identical throughout their variable and constant regions; they react only with one determinant (epitope) on a given antigen. Spleen cell suspensions from immunized mice contain numerous secreting B cells from different clones recognizing different epitopes. These B cells are fused with a non-secreting myeloma cell line to form hybrids that have the antibody-producing capacity of the parent B cell and the immortality of the malignant plasma cell. Hybrid cells are then selected and cloned (Fig. 19.2). Large-scale culture can provide considerable quantities of such antibodies, which are pure and precise in their reactivity. The choice of the type of antibody depends on the nature of the assay.
For protein measurements, human serum is mixed with the relevant antiserum for that protein. At low concentrations, the immune complexes remain in suspension as fine particles that can disperse a beam of light. Light dispersion can be measured using machines such as an ultracentrifugal analyser or nephelometer. So long as the amount of detecting antibody in the assay is in excess to the amount of antigen being added, for a constant antibody concentration, the amount of light scatter is proportional to the concentration of the antigen in the human serum being tested. If patient immunoglobulin levels are very high, the amount of immune complexes decreases with the addition of excessive amounts of antigen (‘hook-effect’). Therefore, readings may be spuriously low. With appropriately diluted patient samples, however the method is rapid and suitable for automation; precise results can be obtained in 1–2 h from venepuncture.
For some proteins, machine-compatible reagents may not be available. Under these circumstances, laboratories may use the single radial immunodiffusion (RID) technique originally described by Mancini. Both RID and centrifugal analysis can be used for measurement of many proteins in serum, amniotic fluid, cerebrospinal fluid, saliva and gastrointestinal juice. They include not only human immunoglobulins but also a range of other immune reactants, acute-phase proteins, transport proteins, coagulation proteins and ‘tumour markers’. Standard preparations are used, which have been calibrated against international WHO standards. Each hospital laboratory determines its own reference range for each protein and this will vary according to the method and antisera used and the ethnic origin of the group. Reference ranges of most proteins also vary with age, especially in children, and 95% of the ‘normal’ population will fall within that range.
19.2.2 Qualitative investigation of immunoglobulins
Serum
It is essential that sera sent for immunoglobulin quantification is screened by serum protein electrophoresis for the presence of paraproteins (monoclonal bands), since these abnormal immunoglobulins may react with the standard antisera in a different way due to variable epitopes and structural changes. The principle of the methodology is given here though most of these assays are now automated.
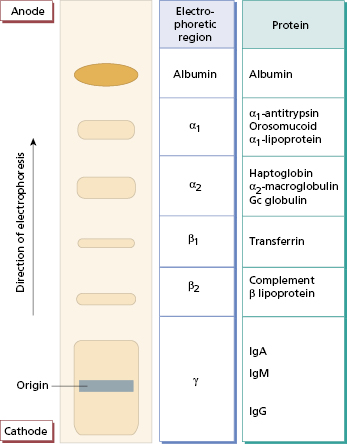
In protein electrophoresis, a wet membrane or gel is stretched across an electrophoresis tank, and filter-paper wicks provide a continuous buffer phase. Serum samples are applied to the surface on the cathodal side and an electric current is passed through the membrane or gel for about 45 min. It is then removed and the protein bands visualized with an appropriate dye (Fig. 19.3). A normal serum is always run with the test specimens for comparison and quality control. Since this is done by machine now, the electrophoretic strip can be visualized on the computer or printed out. Discrete monoclonal immunoglobulin (M) bands can appear anywhere along the strip and must be investigated further. False-positive bands, which are not due to immunoglobulin, may be caused by haemoglobin (in a haemolysed sample), fibrinogen (in plasma or an incompletely clotted specimen) or aggregated IgG (in a stored specimen). It is therefore important to send fresh clotted blood specimens for this test.
Fig. 19.3 Principle of serum protein electrophoresis. At the pH of routine electrophoresis (pH 8.6), serum proteins carry a net negative charge and migrate towards the anode. Some weakly charged proteins, such as immunoglobulins, are carried back towards the cathode by the flow of buffer.
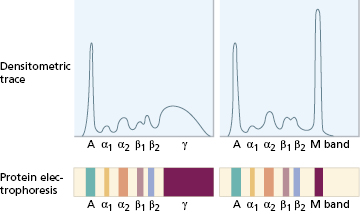
When an M band is found on electrophoresis, the nature of the band must be determined by immunofixation, also automated. Several samples of the patient’s serum are first electrophoresed on agar gel (Fig. 19.4). Specific antisera to IgG, IgA, IgM and κ and λ light chains are then applied to the electrophoresed samples, by soaking strips of cellulose acetate membrane in the individual antisera and laying these strips on the surface of the gel. Precipitation (i.e. immunofixation) of the M protein is achieved by incubating the gel and antisera. Unfixed (non-precipitated) protein is washed from the gel and the ‘fixed’ bands are stained and visualized. In the absence of a heavy-chain abnormality, an abnormal reaction with antisera specific for light chains alone suggests that the M band is due to free monoclonal light chains or, very rarely, an IgD or IgE paraprotein. An abnormal reaction with a heavy-chain antiserum alone is very unusual. Individual M bands can be quantified by densitometry – also automated; this measures the intensity of stain taken up by each band and produces a tracing corresponding to the electrophoretic strip (Fig. 19.5). The proportion attributable to the monoclonal protein is expressed as a percentage of the whole tracing and converted to absolute terms (g/l) by reference to the total serum protein concentration. Scanning densitometry is the most reliable method for measuring paraprotein concentration, particularly for serial monitoring or in samples containing large amounts of non-paraprotein immunoglobulins. Quantitation by comparison of the levels of free κ and λ light chains provides another, faster way to monitor changes in paraprotein levels for clinical management in lymphoproliferative diseases (Chapter 6).
Fig. 19.4 Typing an M band by immunofixation. In this schematic example (a), the M band found on electrophoresis (i) is identified as an IgA (type λ) as shown on the actual fixation gel (b).
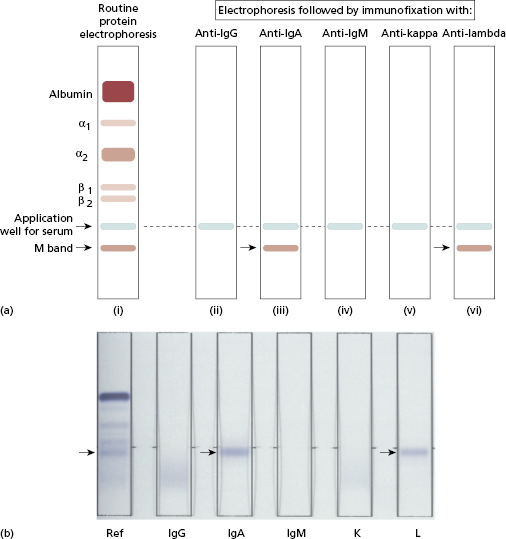
Fig. 19.5 Densitometric analysis of protein electrophoresis for quantification of an M band. A, Albumin. Normal trace on left.
Gross elevations of the immunoglobulin levels indicate the need to measure the relative serum viscosity (RSV); this is the time taken for a given volume of serum to pass through a narrow capillary tube, relative to water. RSV is normally 1.4–1.8. Symptoms of hyperviscosity (see Case 6.9) usually develop when the RSV value exceeds 4.0.
Provided the serum is fresh, a heavy deposit of protein at the origin in serum electrophoresis may indicate the presence of cryoglobulins. Cryoglobulins are immunoglobulins that form precipitates, gels or even crystals in the cold. The severity of the symptoms (see Case 11.7 and section 11.6.3) depends on the cryoprotein concentration and the temperature at which cryoprecipitation occurs (thermal range). If cryoglobulins are suspected clinically, a fresh specimen of blood must be taken directly into a warmed container (37°C) and delivered warm (37°C) to the laboratory; it is allowed to clot at 37°C and also separated at 37°C. Aliquots of separated serum are kept at 4°C for 24 h or longer. Centrifugation and washing of any resultant precipitate must be done at 4°C. The precipitate is redissolved by warming back to 37°C and then analysed for its constituent proteins by immunofixation at 37°C in order to determine the type of cryoglobulin (Chapter 11).
Urine
Analysis of urine is essential in suspected myeloma, any condition in which a serum M band has been found, hypogammaglobulinaemia of unknown cause and in amyloidosis.
Normal immunoglobulin synthesis is accompanied normally by production of excessive amounts of free polyclonal light chains (see section 6.6). These are excreted into the urine, where they can be detected in minute amounts in everyone if a really sensitive assay is used. Patients with renal damage excrete larger quantities of polyclonal free light chains in the urine.
Free monoclonal light chains (Bence Jones proteins) cannot be detected by routine measurement of total urinary protein or urine dipstick testing. The only reliable test for suspected ‘Bence-Jones proteinuria’ consists of three stages:
- concentration of urine;
- electrophoresis to demonstrate the presence of an M band; and
- immunofixation to confirm that the monoclonal band is composed of either monoclonal κ or λ free light chains. The excretion of a whole paraprotein by a damaged kidney may give a false-positive result, unless the free light-chain nature of the M band is confirmed or the serum paraprotein is run alongside for identification.
Cerebrospinal fluid
IgG and albumin concentrations in cerebrospinal fluid (CSF) can be measured. Since albumin is not synthesized in the brain, the relationship between IgG and albumin – the CSF IgG index – gives an indirect indication of how much CSF IgG has been synthesized by lymphocytes inside the brain (Fig. 19.6). The CSF IgG Index is given by dividing (IgG CSF/IgG serum) by (Alb CSF/Alb serum) and should be less than 0.72. The index therefore corrects for reductions in the albumin–IgG ratio associated with diseases that alter the permeability of the blood-brain barrier. In contrast to serum, the IgG in CSF is often of a restricted nature and forms oligoclonal bands, i.e. there are two or more discrete bands rather than a diffuse increase. Oligoclonal bands cannot be detected by routine electrophoresis of unconcentrated CSF and the degree of concentration needed (80-fold) to make bands visible induces artefacts. The most satisfactory method is isoelectric focusing and immunofixation with an enzyme-labelled antiserum to IgG (Fig. 19.7). This is an essential test in the investigation of demyelinating disorders such as multiple sclerosis (see Case 17.2); each set of bands is unique.
Fig. 19.6 Cerebrospinal fluid (CSF) IgG index. The y axis shows increasing values for the quotient of IgG in CSF: IgG in serum, and the x axis shows increasing values for the quotient of albumin in CSF: albumin in serum. The four areas signify: (1) normal; (2) local synthesis (normal barrier function); (3) local synthesis plus abnormal barrier function; (4) barrier function abnormal (not local synthesis).
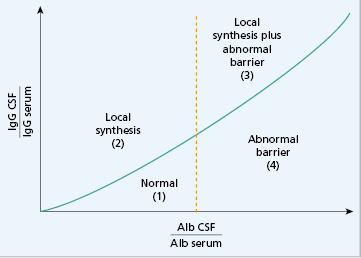
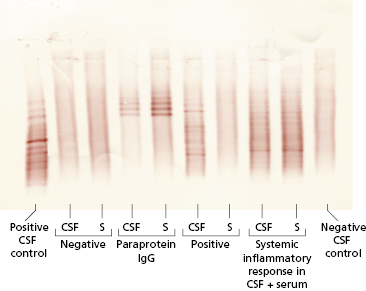
Fig. 19.7 Oligoclonal bands of IgG detected in cerebrospinal fluid (CSF). Isoelectric focusing separates proteins within a pH gradient according to their acidic or basic nature. The proteins are then transferred to a nitrocellulose membrane by blotting and the nitrocellulose immunofixed with an antiserum to IgG to show the IgG-specific bands. The pattern is interpreted by comparing paired samples of CSF and serum (S). A positive test is one where oligoclonal IgG bands are found in CSF but not in serum.
19.3 Investigation of complement and immune complex disorders
Assays for complement components in the serum are divided into those assays that recognize the antigenic nature of the individual complement components, and those which measure functional activity, such as cell lysis.
19.3.1 Assays for individual components
Immunochemical measurements (section 19.2) of C3 and C4 are the most useful assays. International reference preparations and reliable automated methods are widely available. Measurements of other components can be done but are rarely needed, except in patients with suspected genetic deficiencies and abnormal functional assays. C1 inhibitor must be measured if hereditary angioedema is suspected (see Case 11.5 and section 11.6.1).
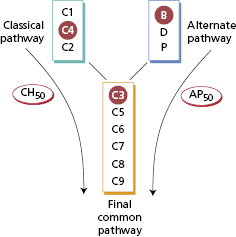
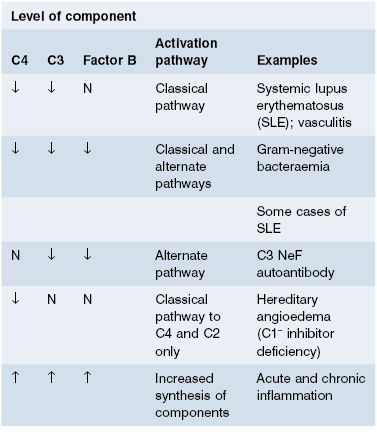
Low levels of complement components are more relevant clinically than high levels. As complement components are acute-phase reactants, rates of synthesis rise in any inflammatory condition. To understand complement changes in disease, it is useful to consider complement components in three groups (Fig. 19.8):
- early components of the classical pathway;
- early components of the alternate pathway; and
- late components common to both pathways.
Fig. 19.8 Complement components distributed into three groups (see text). Ringed components are those measured as representatives of the groups. Functional integrity of the classical and alternate pathways is measured by CH50 and AP50 assays (see text).
In practice (Table 19.2), low C4 and C3 but normal Factor B levels suggest that activation of the classical pathway alone has occurred; if C4, C3 and Factor B levels are low, the alternate pathway is probably also activated, either via the feedback loop (see Chapter 1) or by simultaneous activation. Normal C4 levels with low C3 and Factor B concentrations provide evidence of activation of the alternate pathway alone.
Serial measurements of C3 and C4 are useful in monitoring disease activity or treatment in patients with some forms of glomerulonephritis, systemic lupus erythematosus (SLE) and vasculitis. If low initially, they often return to normal in remission (see Chapters 9 and 10). Routine complement tests are of little value in other acute and chronic inflammatory diseases.
19.3.2 Detection of complement breakdown products
Even if complement levels are normal due to increased synthesis, measuring ‘breakdown’ or activation products of the pathway may recognize consumption. This may be helpful in unexpected acute shock, where a new material that has been used invasively is suspected to cause alternate pathway activation of C3. The electrophoretic mobility of native C3 and that of its cleavage products (e.g. C3c and C3dg) are different. Other activation products, such as C3a, C5a, C1r/C1s complex and C5b/9 complex, can also be measured for research purposes but are not used routinely.
19.3.3 C3 nephritic factor
C3 nephritic factor (C3 NeF) is an autoantibody to activated C3 that stabilizes the alternate pathway C3 convertase and allows further C3 breakdown (see Chapter 9). C3 NeF is suspected in renal patients in whom an unexplained low C3 level is found; these are usually patients with kidney disease, lipodystrophy or recurrent infections. It is detected by incubation of the patient’s serum with normal serum; this allows the C3 nephritic factor in patient’s serum to break down C3 in the normal serum.
19.3.4 Functional assays
Related posts:

Stay updated, free articles. Join our Telegram channel

Full access? Get Clinical Tree


