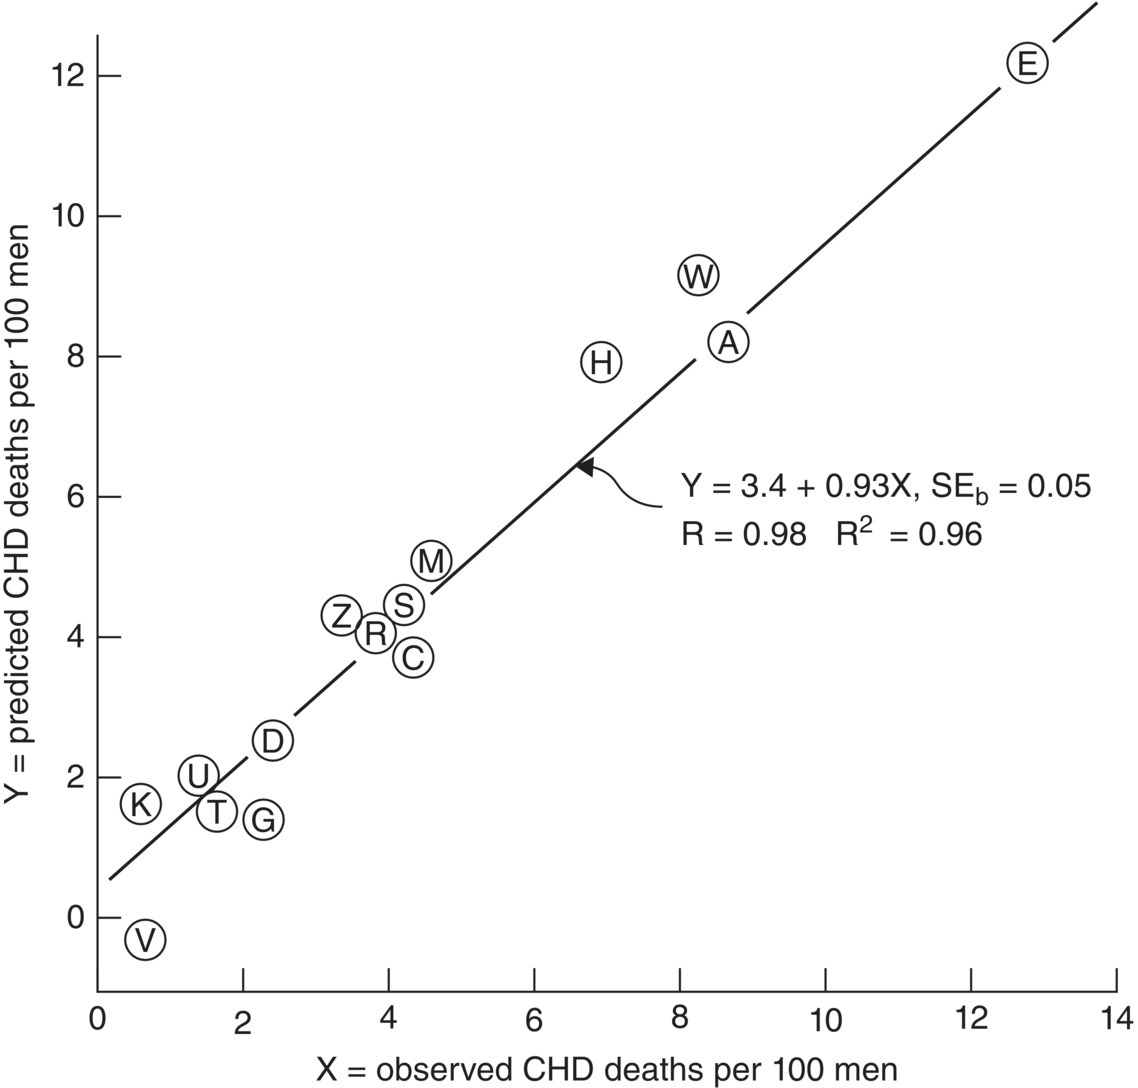
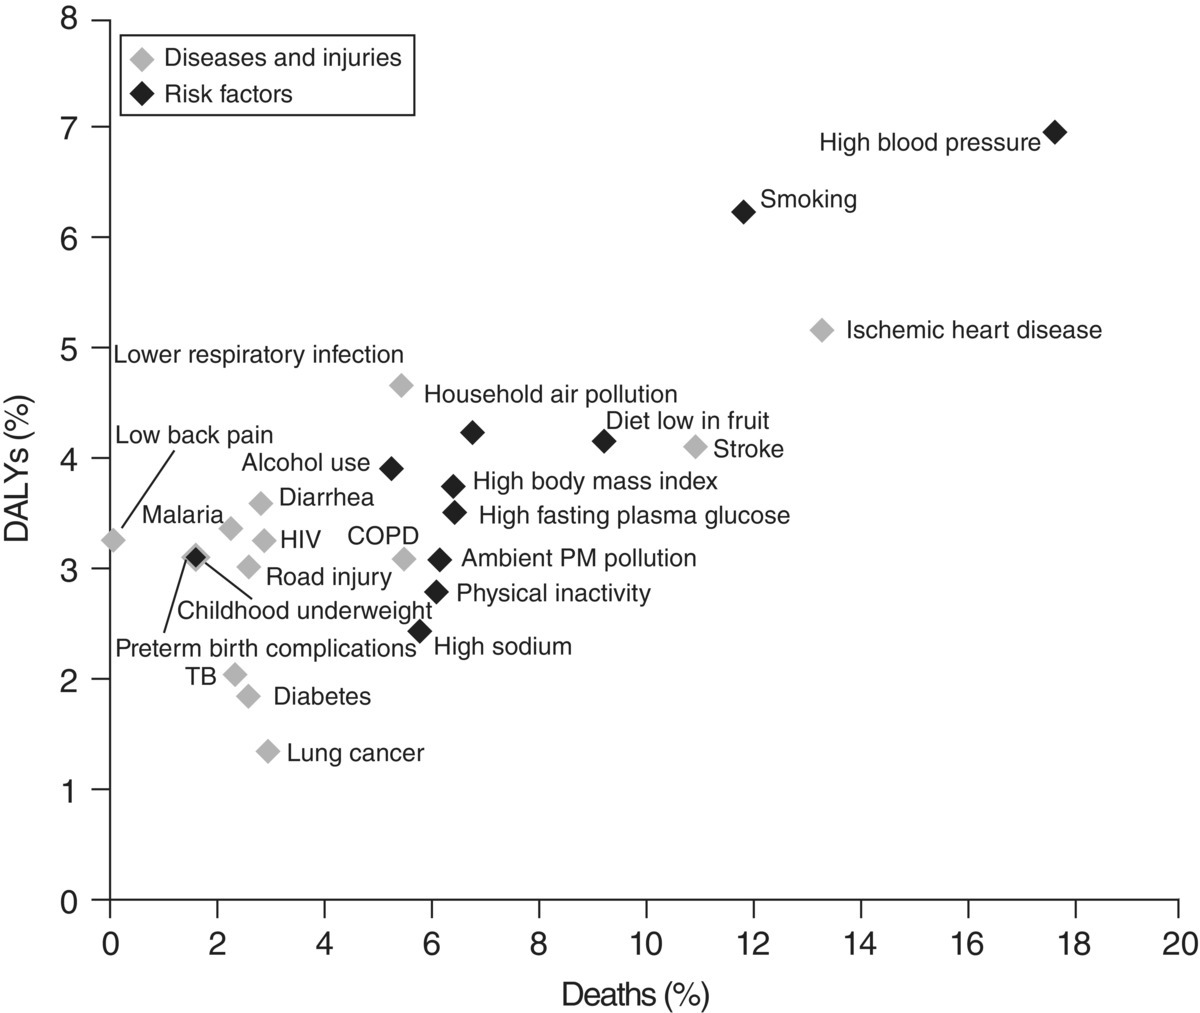
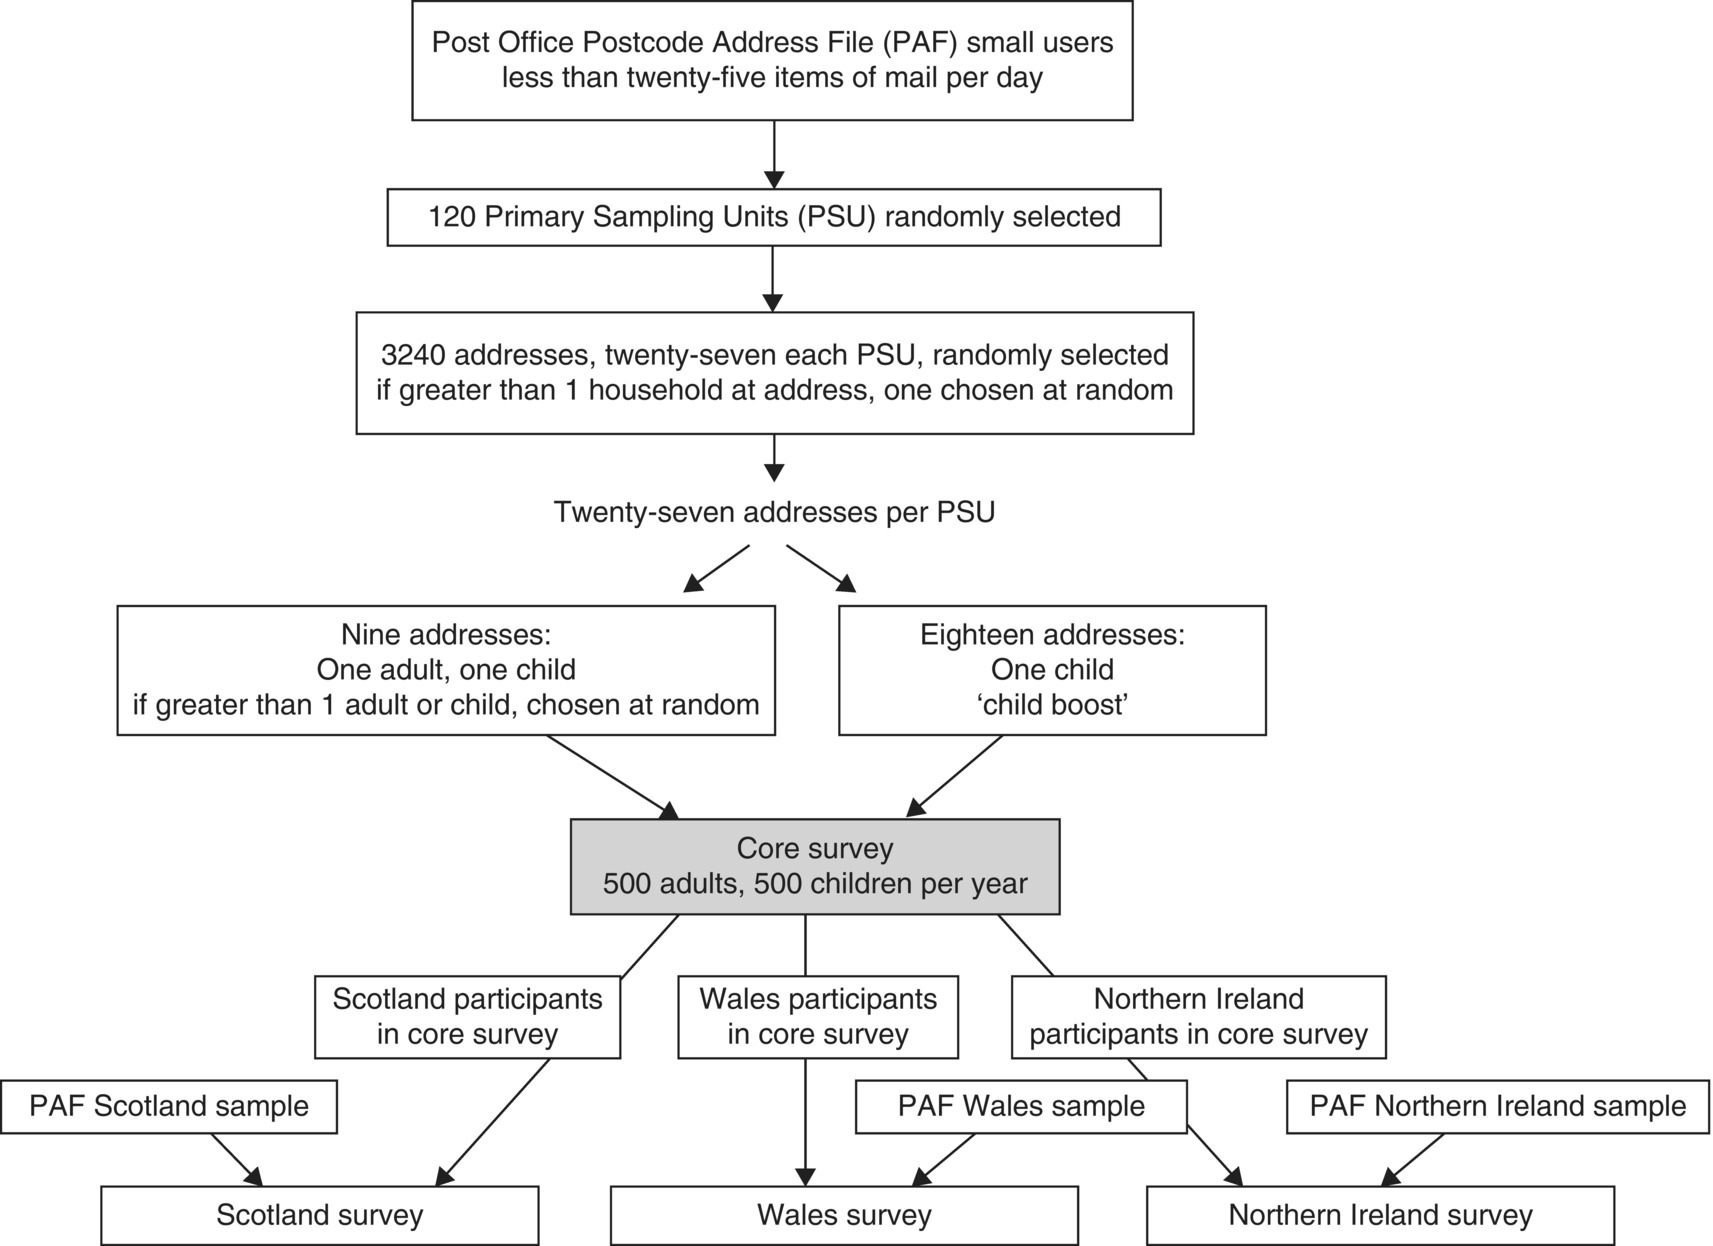
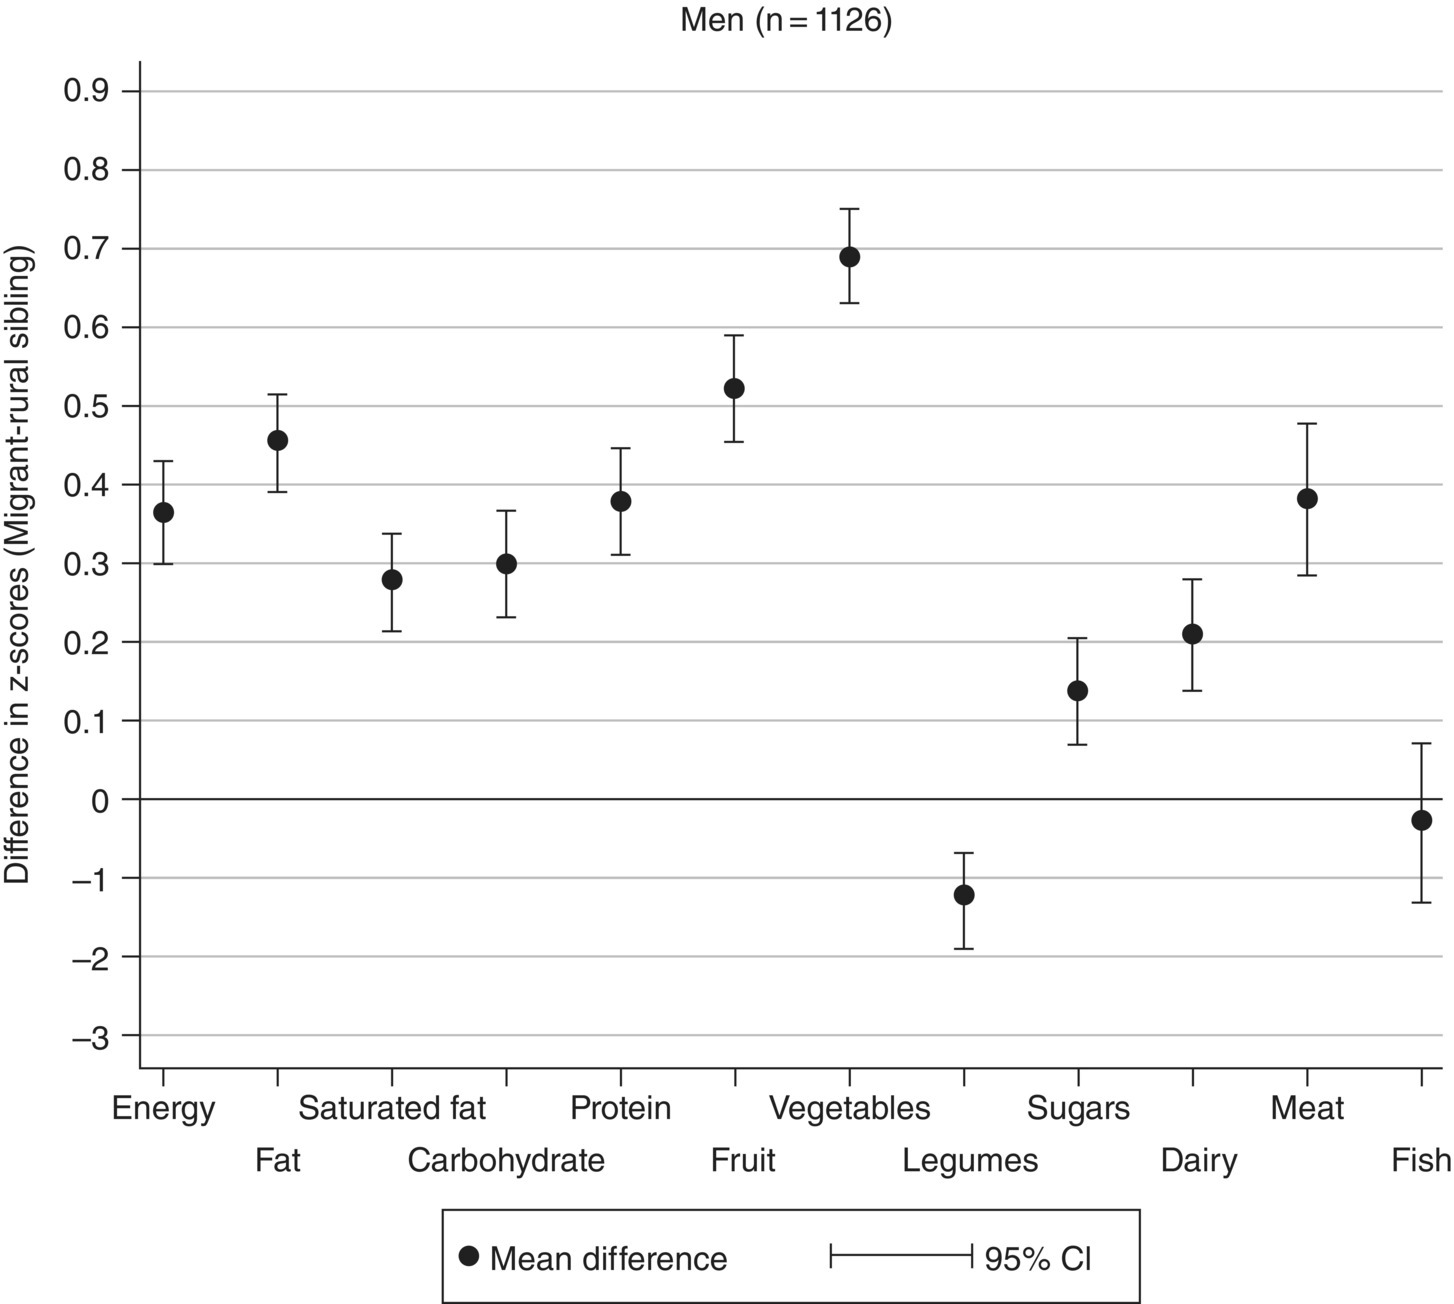
2 Janet Cade1 and Jayne Hutchinson2 1 University of Leeds 2 University of York This chapter will discuss population-based, observational studies. The methods used are based on epidemiological approaches; epidemiology is the study of diseases in populations. The key consideration in population-based studies is that the researcher has no control over the exposure of interest (e.g. diet). Study types include ecological, case-control and cohort studies. They are useful for generating hypotheses and exploring associations between diet and health outcomes. These study designs can help to build up evidence to support a suggested effect of a particular dietary factor on a certain disease, but they cannot categorically show cause-and-effect association, which is required for proof of a link between a dietary factor and a disease. Since these methods do not use randomisation to select participants, they are more prone to bias than are randomised controlled trials (RCTs). Bias is a systematic error resulting in an estimated association between exposure and outcome that deviates from the true association in a direction that depends on the nature of the systematic error. Selection bias can result in systematic differences between characteristics of participants in different exposure or outcome groups within a study, which can lead to confounding of the results. Non-response bias at the start of a study and non-random attrition (dropping out of participants) during a study are other forms of selection bias. Recall bias and social desirability reporting bias are forms of measurement bias; the systematic differences in recall and reporting between exposure or outcome groups who have dissimilar characteristics can lead to confounding of the results. Confounding variables can provide alternative explanations for an apparent association between a dietary exposure and a disease/health outcome in observational studies. Confounders are associated with both the exposure of interest (diet) and the outcome variable (disease), but are not on the causal pathway between exposure and outcome. Confounders can be dealt with in a number of ways depending on the study design: during the design of the study by matching or by restricting study members; or through data analysis by stratification (e.g. age standardisation), restriction or adjustment in regression models. Most analyses of disease risk control for age, since disease risk increases with age and age is often associated with dietary intake. Confounders are discussed further in Section 2.6. This chapter will consider ways to minimise problems. However, its overall aim is to provide an overview of different methods used in observational epidemiology. The focus of this type of study is on characterising population groups rather than on linking individuals’ exposures to health outcomes. Ecological studies of diet and health explore associations between population or group indicators of diet or nutritional status and population or group indices of health status. Two population-based measures are needed for this type of study, one for the exposure of interest (the diet) and the other for the health outcome (the disease). The individuals in the populations used to describe the dietary exposure may or may not be the same as those providing data for health outcomes. In nutritional epidemiology, ecological studies have predominantly been used to explore geographical or temporal relationships between diet and health: for example, exploring country differences in dietary intakes and health, or comparing changes in diet in populations over time. There are occasions when ecological studies may be the only feasible research method available to explore the association between diet and disease. This would occur when exposure data are not available at the individual level, such as for fluoride in drinking water. In the simplest study, two population-based measures are required, one for the exposure of interest and the other for the health outcome. Estimates of population dietary intake can be made from survey data collected for the purpose of the study in a population or from pre-existing dietary data, which will be less costly although it may not sufficiently reflect consumption. An important source of internationally available food data comes from the Food and Agriculture Organization (FAO) food balance sheets, available at http://faostat3.fao.org/faostat-gateway/go/to/home/E. These provide a comprehensive picture of the pattern of a country’s food supply for a particular time point. For each food item, they show the total quantity produced and imported and link this to utilisation, including export, amounts fed to livestock and used for seed, and losses during storage and transport. From this the amount of each food available for human consumption can be estimated. This type of data has been used to assess trends in dietary intakes; however, it may overestimate dietary intakes (Pomerleau, Lock and McKee 2003). These studies collect data on food availability at a household level. Participants record food purchases and other food coming into the home. This type of data is used to generate consumer price indices, which are used as measures of inflation. A household expenditure survey, now called the Living Costs and Food Survey, has been conducted annually in the UK since 1957, making it a useful tool for monitoring changes in family food behaviour over time. Nutrition and health population-based surveys were used to estimate mean fruit and vegetable intake for the Global Burden of Disease study (Lim et al. 2012). Ecological analysis has been undertaken using diet and health information collected from a range of European countries included in the European Prospective Investigation into Cancer (EPIC) cohort study. Measures of mortality or morbidity at a national level are usually available through government reports or World Health Organization (WHO) publications. National mortality data and Global Burden of Disease data can all be found here: http://www.who.int/healthinfo/statistics/en/ Ecological studies are generally the first step in exploring whether there is a differential distribution of disease among people with different risk profiles. For example, ecological comparisons showed that economically developed countries with a higher intake of dietary fat had much higher coronary heart disease (CHD) rates than countries with lower dietary fat consumption. This evidence was based on an early study analysing diets from groups of men in seven different countries (Keys et al. 1986); see Figure 2.1. These results have been challenged over the years because of difficulties in characterising the dietary intakes of the different country populations. Other types of study are needed to show causation. Figure 2.1 Observed 15-year death rates per 100 men compared with death rates from coronary heart disease (CHD) predicted from the multiple regression of the ratio of monounsaturated to saturated fatty acids in the diet, adjusting for age, body mass index, systolic blood pressure, serum cholesterol, and number of cigarettes smoked daily in the Seven Countries Study. Keys, A. et al. (1986) The diet and 15-year death rate in the Seven Countries Study, American Journal of Epidemiology, 124 (6), 903–915, by permission of Oxford University Press. Diet features very strongly as a risk factor for top adverse health outcomes in the recently published Global Burden of Disease Study 2010 (Lim et al. 2012); see Figure 2.2. This study used published and unpublished secondary sources of data to calculate the relationships between 67 different risk factors in 21 regions and linked them with deaths or disease burden for each region between 1990 and 2010. Out of the top 20 leading risk factors contributing to the burden of disease in 2010, 6 are dietary factors (diet low in fruit, nuts and seeds, whole grains, vegetables, seafood and omega-3 fatty acids, and high in sodium) and another 7 are directly linked to diet (high blood pressure, high body mass index, high fasting plasma glucose, childhood underweight, iron deficiency, suboptimal breastfeeding and high total cholesterol). An ecological approach was employed to link risk factors to disease outcomes, using data collected via different epidemiological methods. The data do not directly link individual exposures to risk factors with the diseases of interest. Limitations include variable quality of exposure data across countries and the possibility of residual confounding (see Section 2.6), meaning that some associations could be the result of other factors that have not been considered or taken into account in the analysis. Figure 2.2 The 10 leading diseases and injuries and 10 leading risk factors based on percentage of global deaths and disability-adjusted life years (DALYs), 2010. http://www.healthmetricsandevaluation.org/gbd/publications/policy-report/global-burden-disease-generating-evidence-guiding-policy. The most straightforward analysis would be the calculation of a correlation coefficient between the exposure of interest and the outcome. This is a measure of the strength and direction of the linear relationship between two different continuous variables, for example energy intake and body mass index. The correlation coefficient, denoted by ‘r’, can have values between +1 (a perfect positive linear relationship) and –1 (a perfect inverse linear relationship). A value of 0 indicates no linear relationship between the two variables. An ecological analysis of 21 wealthy countries (Pickett et al. 2005) found that income inequality was positively correlated with the percentage of obese men (r = 0.48, p = 0.03). The relationship was even stronger for obese women in these countries, with a positive correlation coefficient of 0.62 (p = 0.003). Further analysis of ecological studies could include multiple regression modelling to estimate the magnitude of associations, taking into account other factors of relevance that may otherwise confound the analysis. Confounding factors may include age and other lifestyle factors. Regression modelling can be undertaken using continuous variables as the dependent variable or outcome, such as height or weight. In this case linear regression modelling would be undertaken. When the outcome is categorical or dichotomous, such as the presence or absence of a disease, then logistic regression is appropriate. A study of routine data from South Australia used logistic regression analysis to assess factors that might affect food security, a dichotomised outcome (Foley et al. 2010). Food insecurity was highest in households with low levels of education or limited capacity to save money, and in Aboriginal households and those with three or more children. The ‘ecological fallacy’ is the major trap for the unsuspecting researcher. This occurs when relationships that are observed for groups are assumed to hold for individuals. For example, ecological analysis has shown that countries with more fat in the diet have higher rates of breast cancer, suggesting that women who eat fatty foods would be more likely to develop breast cancer. This assumption is only weakly supported by case-control and cohort data. Correlations found in ecological analyses may be due to confounding by other related factors that have not been controlled for, some of which may be difficult to measure at the population level. Age standardisation often needs to be undertaken, since countries may have very different age profiles. This process adjusts disease rates to a standard population, allowing comparisons to occur. When disease rates are age standardised, any differences in the rates over time or between geographical areas will not simply reflect variations in the age structure of the populations. This is important when looking at disease rates because some conditions, such as cancer, can predominantly affect the elderly. So if rates are not age standardised, a higher disease rate in one country may simply reflect the fact that it has a greater proportion of older people. Additionally, the quality of diagnostic data can differ widely between countries and over time. A cross-sectional survey is a type of observational or descriptive study. The information in this type of survey represents a snapshot about the population at one point in time and it is not possible to determine whether the exposure and the outcome are causally related. Cross-sectional surveys are also known as prevalence surveys, since they can be used to estimate the prevalence of disease in a population. The prevalence is the number of cases of a disease in the population at a particular point in time usually expressed as a rate. A cross-sectional analysis of data from older people in the Singapore Longitudinal Ageing Study found that higher measures of fasting homocysteine and low folate were negatively associated with measures of performance-oriented mobility and activities of daily living (Ng et al. 2012). Although these results are suggestive of a relationship in the direction of poorer nutrition to poorer physical function in older people, it is not possible to claim causality, primarily because temporal relationships between exposure and disease were not examined. It is equally plausible that older people with poorer physical functioning have a poorer diet and therefore a worse nutritional status. In order to prove cause-and-effect relationships a different type of study, a randomised controlled trial, would be needed. The major nutrition survey conducted in the UK is the National Diet and Nutrition Survey (NDNS). It is a rolling programme that began in 2008 and collects nationally representative dietary data from 1000 individuals per year aged 18 months and over from private households. The National Health and Nutrition Examination Survey (NHANES) is a major rolling programme of survey data collection in the USA that began in the early 1960s. About 5000 individuals are surveyed each year. The sample is selected to represent the US population of all ages. To produce reliable statistics, NHANES over-samples people 60 and older, African Americans, Asians and Hispanics. There are two major aspects of national nutrition surveys that are important with respect to data collection: cost and organisation. Data should be as nationally representative as possible and also be as accurate and complete as possible (Stephen et al. 2013). In the NDNS, national representation in terms of age, gender and region is achieved by randomly selecting postcodes and addresses from the UK population as a whole (Figure 2.3). The NDNS currently uses the four-day estimated diary to assess diet. This is a compromise between detail and respondent burden. Respondent burden is particularly important to consider in large-scale surveys of this kind. A high level of low-energy reporting has been found in a previous national survey of older British adults that used four-day weighed diaries, which was considered to be a result of the weighed intake method and reluctance to report consumption of unhealthy food. Figure 2.3 Sampling process to ensure national representation in the NDNS survey. Stephen, A.M., Mak, T.N., Fitt, E. et al. (2013) Innovations in national nutrition surveys, Proceedings of the Nutrition Society, 72 (1), 77–88. Reproduced with permission of Cambridge University Press. Three large cross-sectional data sets from the USA, including NHANES, were used to explore causes of changing energy intake in children from 1977 to 2010. Changes in the number of eating/drinking occasions per day and portion size per eating occasion were the major contributors to changes in total energy intake per day (Duffey and Popkin 2013). Demographic and Health Surveys (DHS) are nationally representative household surveys that provide data for a wide range of monitoring and impact evaluation indicators in the areas of population, health and nutrition. More than 300 surveys have been conducted in over 90 countries, and survey data and results can be found at http://www.measuredhs.com/. Among the nutrition topics included and reported is the prevalence of anaemia in children and women, as well as the percentage breast fed and anthropometric indicators. High response rates, national coverage, interviewer training and standardised data-collection procedures across countries as well as consistent content over time enable comparisons to be made across populations cross-sectionally and temporally (Corsi et al. 2012). Cross-sectional analyses of migrants, comparing populations migrating from rural to urban areas or migrating between countries, have been undertaken to explore the associations between genetic background and environmental exposures in relation to risk of disease. Rural–urban migrants experience rapid environmental changes associated with urbanisation, enabling epidemiological transitions to be examined. Changes seen in migrants over relatively short time periods may therefore provide insights into wider population health changes. The Indian Migration Study (Bowen et al. 2011) explored the impact of migration to urban areas on dietary patterns, comparing migrants with their rural siblings. Migrant and urban participants reported up to 80% higher fruit and vegetable intake than rural participants (p = 0.001) and up to 35% higher sugar intake (p = 0.001). Meat and dairy intake were higher in migrant and urban participants than in rural participants (p = 0.001); see Figure 2.4. Figure 2.4 Differences in food intake z-scores between migrant and rural siblings in India. Bowen, L. et al. (2011) Dietary intake and rural-urban migration in India: a cross-sectional study, PLoS One, 6 (6), e14822.
Study Design: Population-Based Studies
2.1 Introduction
2.2 Ecological studies
Methods
Indices of dietary intake
National food supply
Household budget surveys
Individual survey data
Indices of health outcomes
Routine measures of mortality and morbidity
A classic example
A recent example
Analysis of ecological data
Problems with ecological analyses
2.3 Cross-sectional studies
A recent example
Methods
Describing population characteristics
Prevalence surveys
Migrant studies
Stay updated, free articles. Join our Telegram channel

Full access? Get Clinical Tree


