Fig. 3.1
Sagittal T1-weighted (a) and T2-weighted images (b) through the cervical and upper thoracic spine. Normal marrow shows high signal on T1 imaging (red arrow) reflecting the presence of yellow fatty marrow. Note the presence of multiple foci of intermediate signal within the vertebral bodies (short arrows in a) representing metastatic disease. Also note the difference in conspicuity of the metastatic foci when compared with the T2 image (b)
Gadolinium enhancement is usually reserved for the assessment of primary spinal cord tumors and leptomeningeal tumor. The normal spinal cord demonstrates uniform intermediate or isointense T1 and hypointense T2 signal (Fig. 3.2). Normally, there is minimal, if any, pial enhancement on the surface of the cord (Fig. 3.2). Primary or secondary parenchymal cord tumor will enhance following contrast administration, and examples are shown in Fig. 3.3. Associated peritumoral edema and cord expansion may also be evident. Leptomeningeal disease will manifest as linear or nodular foci of enhancement along the surface of the cord. Severe leptomeningeal disease can give a classic “frosting-like” appearance along the cord surface and show marked nodularity in the cauda equina (Fig. 3.4).
Fig. 3.2
Sagittal T1 (a), T2 (b), and post-contrast T1 (c) images showing the normal appearance of the spinal cord. T1 imaging shows a uniform isointense signal of the cord. Minimal if any pial enhancement is seen. T2 imaging shows the cord to be of uniform hypointensity
Fig. 3.3
Sagittal T2 image (a) showing an expansile anaplastic astrocytoma involving the distal cord. Hyperintense signal extending into the conus is compatible with peritumoral edema. Sagittal gadolinium-enhanced T1 (b) and T2 images (c) of an ependymoma involving the cervical cord. This mass is quite complex with areas of cystic change with internal fluid–fluid levels. Also note the presence of dark signal “cap” along the inferior margin (b, c) of the lesion representing chronic blood product
Fig. 3.4
Leptomeningeal spinal metastases. Sagittal enhanced T1 images (a, b) showing pial “drop metastases” manifesting as enhancing foci studding the surface of the cord and cauda (a – lung carcinoma) and as larger more discrete enhancing nodules along the cauda equina (b – endolymphatic sac tumor). Sagittal T2 image (c) in a patient with breast carcinoma also shows nodularity along the cauda equina. Sagittal enhanced T1 image (d) shows very marked diffuse plaque-like enhancing tumor infiltrating the cauda equina (arrows) in a patient with sinonasal carcinoma
Gadolinium enhancement should be performed with fat saturation techniques which act to decrease the signal of native fat within the marrow spaces. This is of particular importance when evaluating for the presence of vertebral metastases. The use of gadolinium contrast without such suppression techniques will raise the signal of vertebral body metastases on T1-weighted sequences. Such lesions can potentially enhance to such a degree as to be isointense with non-suppressed bright marrow signal and thus be “masked” (Fig. 3.5). Some institutions will also employ methods to suppress marrow signal on T2-weighted acquisitions. This can be performed via use of a chemical fat saturation technique or via short inversion time inversion recovery (STIR) technique. These sequences have a high degree of sensitivity for the visualization of edema, inflammation, and tumor and will increase the conspicuity of vertebral lesions. We also routinely employ a coronal T1-weighted series through the sacrum. This gives a good overview of the sacral bone and the neuroforamina.
Fig. 3.5
Sagittal T1-weighted images without (a) and with gadolinium (b) enhancement. The metastasis within the S1 segment of the sacrum is seen as an area of intermediate signal and is easily visible (red arrow) on the unenhanced image. Following contrast, the tumor enhances and becomes nearly isointense with the native marrow signal and is more difficult to discern (yellow arrow)
Computed tomography (CT) still plays an important role in imaging the spine, primarily in evaluating bone. In particular, the nature of tumor being lytic, blastic, or mixed is based on CT and not MRI characteristics. Furthermore, for the spine surgeon planning to perform a reconstructive spine surgery with instrumentation, a spine CT is typically required to evaluate the bony quality above and below the affected levels in order to confidently determine the best levels at which to apply instrumentation. Lastly, for patients who have contraindications to MRI, a CT myelogram may be performed to adequately visualize the relationship between tumor, CSF, and the spinal cord/cauda equina. This procedure has become more frequently used with the advent of spine SBRT, as the precise delineation of the spinal cord and thecal sac helps to ensure safe practice.
3.5 Case-Based Discussion of Common Spinal Cord Tumors
IMST of all three glial lines can occur in the spinal cord. Table 3.1 details the more common IMST tumor types. A full description of all tumor types is beyond the scope of this chapter as the focus is on treatment planning. The following is a brief description of the more common types that a radiation oncologist should be aware of and difficult cases will be presented with treatment planning details. Although the focus is on IMST, additional spinal tumors will be presented to provide a comprehensive case discussion. In the discussion of radiotherapy planning that follows, GTV refers to the gross tumor volume as tumor evident on imaging (note this can also include the postoperative bed in selected circumstances), CTV refers to the clinical target volume which is a margin applied to encompass potential microscopic disease that should be included in the high-dose volume to achieve the intent of therapy and this margin respects anatomic boundaries to tumor invasion, and PTV refers to the planning target volume which is a geometric margin that is applied to account for uncertainties in delivery, planning, dose calculation, etc. A complete description of these definitions can be found in the ICRU 50 report (ICRU 1993). In addition, the approaches described with respect to dose selection and volume contouring are those currently in practice at the University of Toronto and subject to change. At this time there is a lack of data and consensus as to optimal margins, and the reader should be aware of the limitations in the literature.
Table 3.1
Summary of common primary intramedullary tumors
Primary intramedullary tumors | |
|---|---|
Neuroepithelial tumors | Other primary tumors |
Glial | Hemangioblastoma |
Pilocytic astrocytoma | Paraganglioma |
Astrocytoma, diffuse/anaplastic | Lipoma |
Glioblastoma | Lymphoma |
Oligodendroglioma | Vascular malformations |
Ependymoma | Arteriovenous malformation |
Mixed neuronal–glial | Capillary hemangioma |
Ganglioglioma | Cavernous hemangioma |
Nerve sheath tumors | |
Schwannoma | |
Neurofibroma | |
Malignant peripheral nerve sheath tumor | |
Synovial sarcoma | |
3.5.1 Ependymoma
Ependymomas are characterized by perivascular pseudorosettes and are the most common gliomas of the spinal cord. Classical ependymomas are considered either World Health Organization (WHO) grade II or WHO grade III (anaplastic) tumors, though the latter occur less frequently in the spinal cord. Unlike their astrocytic and oligodendroglial counterparts, ependymomas frequently have a pushing border and are more amenable to surgical resection (Chamberlain and Tredway 2011). Ependymoma is the most common glioma diagnosed in the setting of neurofibromatosis type 2, and the vast majority of these tumors occur in the spinal cord (Louis et al. 2007). Myxopapillary ependymomas (Fig. 3.6) generally occur in the region of the cauda equina and conus medullaris. These tumors are currently considered WHO grade I neoplasms, but recurrence is not uncommon, particularly in the pediatric population (Bagley et al. 2009). Classical ependymoma also have distinct gene expression profiles as compared to myxopapillary ependymoma (Barton et al. 2010). With respect to workup, MRI brain is recommended, and for anaplastic tumors, a 14-day postoperative lumbar puncture is recommended to rule out CSF spread.
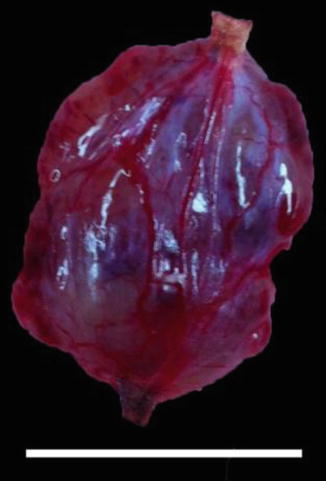
Fig. 3.6
Myxopapillary ependymoma demonstrating well-defined non-infiltrating border with associated nerve seen at the superior and inferior specimen margins. Scale bar = 1 cm
For WHO grade I/II spinal ependymomas without evidence of CSF dissemination, observation is an option following a gross-total resection (GTR). If a GTR is not achieved, or if the tumor is anaplastic, localized radiation is recommended to a dose of 54 Gy in 30 fractions. If CSF dissemination is evident, then craniospinal radiation is recommended to a dose of 36 Gy in 20 fractions (39.6 Gy in 22 fractions if macroscopic CSF disease spread) followed by a boost to the primary site and all disseminated gross disease to a total of 54 Gy (or 59.4 Gy if the tumor involves the brain).
3.5.1.1 MR Imaging Characteristics
Ependymomas arising within the spinal cord parenchyma are most likely of the cellular subtype. These lesions are usually well delineated and have hypointense T1 and hyperintense T2 signal. Tumors will typically show avid enhancement with gadolinium. Depending upon the size of the tumor, focal spinal cord expansion may be evident. Intra-tumoral cystic change can be present. Acute to subacute hemorrhage can also arise which will give rise to regions of high T1 and variable T2 signal. Chronic blood product in the form of hemosiderin will give rise to a characteristic low T1 and T2 signal “cap” or peripheral rim along the edge of the mass. Gradient echo or susceptibility weighted imaging will also highlight areas of hemorrhage as regions of very low signal. Surrounding high T2 signal edema will be seen surrounding the periphery of the lesion.
The myxopapillary subtype is characteristically located within the distal conus or cauda equina and manifests as a heterogeneously enhancing, often cystic and hemorrhagic mass. Expansion of the spinal canal and remodeling and scalloping of the posterior aspect of the adjacent vertebral bodies may be seen. These tumors show low T1 and bright T2 signal. Areas of high T1 signal may reflect the presence of hemorrhage or possibly mucin content. The presence of CSF dissemination will manifest as enhancing areas of thickening and/or nodularity along the surface of the spinal cord.
3.5.1.2 Radiotherapy Volume Delineation
GTV should encompass the T1 post-gadolinium abnormality, the postsurgical tumor bed, and the T2 FLAIR abnormality (not including non-enhancing syrinx). The CTV includes a margin of 1.5–2 cm superiorly and inferiorly and the entire canal radially along the length of the CTV. A margin of 0.3–0.5 cm is applied as PTV (this margin is based on the patient immobilized in a suitable device and daily cone-beam CT image guidance).
3.5.1.3 Case
Although most myxopapillary ependymomas can be completely resected and no further intervention with radiotherapy is required, in select cases up-front radiotherapy is delivered. We present a case of a 34-year-old woman who presented with progressive bilateral leg weakness and sensory findings (paresthesia) who ultimately progressed to develop a neurogenic bladder. The patient had an MRI spine with contrast and was found to have an extensive intramedullary mass. In Fig. 3.7, the T2 FLAIR and T1 post-gadolinium sagittal images are shown depicting an enhancing cystic and solid tumor extending cranially from T10 to S2 caudally, and axially the tumor involved the entire canal. The patient then underwent a subtotal resection and the pathology confirmed the diagnosis of myxopapillary ependymoma. As a complete resection was not possible, the patient was treated adjuvantly with radiotherapy. We prescribed 54 Gy in 30 fractions and delivered treatment using intensity modulated radiotherapy (IMRT) using a 12 coplanar beam technique. When the tumor is also inherently the organ at risk (OAR), our practice is to prescribe to a point maximum (in this case 54 Gy) and aim to achieve at least >95 % coverage of the CTV and >90 % of PTV. This practice ensures no hot spot in the treatment plan and hence within the OAR.
Fig. 3.7
An example of a myxopapillary ependymoma treated with 54 Gy in 30 fractions with IMRT. The pre-radiation T2 FLAIR and T1 post-gadolinium sagittal MR images are shown on Panels (a, b). The treatment planning volumes shown in Panel (c) with the CTV in red and PTV in blue (for clarity the GTV contour omitted), Panel (d) illustrates an axial image showing the CTV and PTV and below a representation of the isodose distribution, and Panel (e) illustrates the sagittal view of the treatment plan with representative isodose lines
The GTV was the T1 post-contrast enhancing disease and included the T2 FLAIR signal change, and a 1.5 cm margin beyond the GTV cranially and caudally was applied (respecting anatomic barriers) as CTV. However, in this case the inferior aspect of the CTV was extended to encompass the spinal canal to its inferior aspect which was ~S5 (red contour, Fig. 3.7). For more limited target lengths, a 0.3–0.5 cm PTV margin is applied; however, in this case due to the uncertainties at the extremes of the target with respect to patient motion and setup uncertainties, a 1 cm PTV was applied (blue contour, Fig. 3.7). Representative axial and sagittal images of the dose distribution are also shown, and the conformal nature of the higher isodose lines is apparent with the lower doses (e.g., the 2,500 cGy isodose line) spilling due to the nature of IMRT delivery.
3.5.1.4 Selected Evidence
The Cleveland Clinic group recently reported on 37 patients with spinal myxopapillary ependymoma (Chao et al. 2011). Of the 37 patients, 9 were treated with a planned up-front postoperative adjuvant radiation, 5 of which had a gross tumor resection (GTR), and 32 patients were observed postoperatively (20 of whom had a GTR). They observed a mean survival time of 12.2 years and a median time to recurrence of 7.7 years (16/37 had relapsed). The use of up-front radiation did not yield any significant differences in overall survival (OS) or relapse-free survival (RFS). Importantly, they observed that for those who relapsed and were treated with radiation at that time, the median RFS was significantly prolonged at 9.6 years as opposed to 1.1 years in those who did not receive radiation (p = 0.0093). The reader is cautioned to recognize that there are other data that have reported benefits with respect to RFS with up-front radiation and overall there is much controversy as to the optimal management with respect to the timing of radiation.
The Princess Margaret Hospital (Toronto, Canada) experience has been reported. The series consisted of 59 patients and all patients were treated with radiotherapy. Overall survival at 5 and 10 years was 83 and 75 %, respectively. They observed that grade correlated with survival with 5-year cause-specific survivals of 97 % vs. 75 % for well-differentiated tumors as compared to intermediate or poorly differentiated tumors. The median time to recurrence for the 11 local failures was 2 years (Waldron et al. 1993).
3.5.2 Astrocytoma
Astrocytomas of all WHO grades can occur in the spinal cord. Pilocytic astrocytomas are WHO grade I neoplasms with low proliferative activity featuring biphasic morphology and Rosenthal fiber formation. These typically occur in children and young adults and account for 12.5 % of spinal cord tumors in the pediatric population (Dolecek et al. 2012). Infiltrating astrocytomas of the CNS are graded on the basis of pleomorphism (diffuse astrocytoma – WHO grade II), mitotic activity (anaplastic astrocytoma – WHO grade III), and the presence of vascular proliferation and/or necrosis (glioblastoma – WHO grade IV). Similar to ependymoma, there is potential for complete resection of well-defined tumors such as pilocytic astrocytoma. For extensive tumors and/or more infiltrative tumors, subtotal resection or biopsy alone may be the only surgical result achievable, and these patients typically will require up-front radiation.
3.5.2.1 MR Imaging Characteristics
Spinal cord astrocytomas appear as expansile mass lesions most commonly located in the cervical or thoracic cord. They show low T1 and bright T2 signal. Hemorrhage and cystic change are less frequent compared with ependymoma. Tumor enhancement is variable and may range from no enhancement to fairly avid enhancement. Those lesions which do enhance are usually less avid when compared with ependymoma. Enhancement patterns can range from focal nodular, patchy, and diffuse, and astrocytomas are also usually more eccentrically located in the cord compared with ependymomas.
3.5.2.2 Radiotherapy Volume Delineation
For pilocytic astrocytoma, the GTV includes the residual enhancing disease and the surgical bed. A 0.5–1 cm margin cranially and caudally is applied as CTV that also encompasses the T2 FLAIR abnormality and radially the entire spinal canal along the CTV length. A 0.3–0.5 cm margin is applied for PTV. For higher-grade tumors, the GTV includes the residual enhancing disease, the surgical bed, and the T2 FLAIR abnormality. A CTV margin of 1 cm cranially and caudally is applied of grade II tumors and 1.5 cm for grade III and IV tumors and radially the entire spinal canal along the CTV length. A 0.5 cm margin is applied for PTV (this margin is based on the patient immobilized in a suitable device and cone-beam CT image guidance).
3.5.2.3 Pilocytic Astrocytoma Case
This 29-year-old female initially presented with neck pain and an episode of transient quadriparesis following a chiropractic neck manipulation. The preoperative and postoperative sagittal T1 post-gadolinium and T2 FLAIR MRI sequences are shown in Fig. 3.8 and illustrate an enhancing mass that was cystic and solid in nature. The mass extended from C1 to T1. Following a subtotal resection, the patient was treated adjuvantly with 54 Gy in 30 fractions using IMRT and a nine-beam coplanar beam arrangement. We prescribed 54 Gy to a point maximum within the PTV and aimed to achieve at least >95 % coverage of the CTV and >90 % of the PTV.
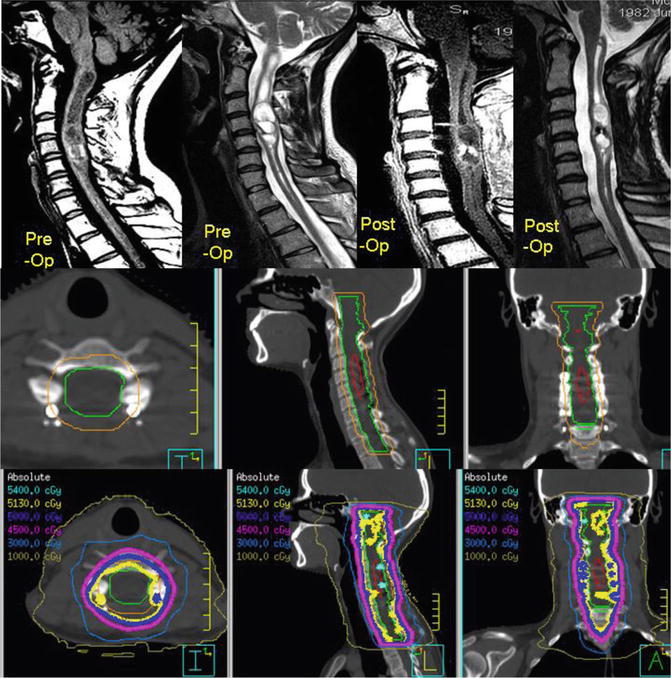
Fig. 3.8
A cervical pilocytic astrocytoma subtotally resected and treated with adjuvant radiation. The top row illustrates the preoperative and postoperative sagittal MR images. The middle panel illustrates the treatment planning volumes on the treatment planning CT with GTV in red, CTV in green, and PTV in orange and axial, sagittal, and coronal slices. The corresponding isodose distribution is shown in the bottom row, and this patient was treated with 54 Gy in 30 fractions
The GTV was contoured as the T1 post-gadolinium residual disease and surgical bed. The CTV encompassed the GTV, the T2 FLAIR abnormality, and a 1 cm margin beyond the T2 FLAIR abnormality cranially (which extends into the brainstem) and caudally (respecting anatomic barriers). Radially, the entire spinal canal was included and at the level of the brainstem, the entire brainstem is taken axially along the length of the CTV (respecting anatomic barriers). A 0.5 cm margin was then applied as PTV. The middle panel of Fig. 3.8 shows the contoured volumes with GTV in red, CTV in green, and PTV in orange. Representations of the dose distribution are also shown in the bottom panel of Fig. 3.8.
3.5.2.4 Selected Evidence
A recent study by Ishkanian et al. reviewed the Princess Margaret Hospital (Toronto, Canada) adult pilocytic astrocytoma experience (Ishkanian et al. 2011). The focus was on analyzing the role of up-front radiation as opposed to observation. In that series, 4 out of 30 tumors were located within the spinal cord. The study concluded that the timing of radiation did not impact OS. However, progression-free survival (PFS) was significantly extended with up-front radiation. At 10 years, the PFS rate was 17 % in the observation cohort as compared to 60 % in those radiated up front.
3.5.2.5 Low-Grade Glioma Case
This 45-year-old female presented with headache, blurred vision, and paresthesia over her left side. MRI was performed and shown in Fig. 3.9. Essentially a mass spanning the C2 vertebrae was observed clearly on T2 FLAIR imaging and faintly enhancing on T1 post-gadolinium. An associated cyst was also evident on the T2 FLAIR MRI extending to the level of the clivus. The patient underwent a cyst decompression and subtotal resection, and the postoperative T2 FLAIR imaging is shown in Fig. 3.9. The pathology confirmed a grade II diffuse low-grade astrocytoma. The patient was treated with 54 Gy in 30 fractions prescribed to a point maximum in the PTV. A five-beam coplanar IMRT technique was used, and the sagittal dose distribution is shown in Fig. 3.9. The GTV included the T2 FLAIR abnormality, T1 post-gadolinium abnormality, and surgical bed as shown as the red contour; the CTV consisted of a 1.5 cm cranial–caudal extension beyond the GTV and radially to encompass the entire canal (respecting anatomic barriers) and a margin of 0.5 cm applied as PTV. The DVH is also shown in Fig. 3.9.