Fig. 2.1
LGBTQUIA alphabet soup (adapted from St. Mary’s College Intercultural Lounge)
Describing the Population
According to the National Gay and Lesbian Task Force (2011), there are currently between 1.4 and 3.8 million LGBT Americans over the age of 65. By 2030, this number is expected to increase to between 3.6 and 7.2 million LGBT Americans, as the Baby Boom population, those born between 1946 and 1964, ages. Although there is no definitive measure to determine the percentage of LGBT individuals in the USA, national organizations such as the Human Rights Campaign and the National Gay and Lesbian Task Force use 3.5 % as a measure.
Certainly, numerous limitations impact the LGBT census, not the least of which are individuals who do not recognize and report their sexual orientation or gender identity. Further, there are those whom the LGBT umbrella does not cover, such as persons who identify as unisex, intersex, and asexual. In addition, the Human Rights Campaign believes that the data based on the 2010 US Census do not represent a comprehensive picture, as the Census only counts individuals from gay- and lesbian-identified households (Gendron et al. 2013). Much of the data on LGBT individuals are aggregated from national, urban studies, many of which do not include older adults; individuals from rural communities; and those who do not, or have not as yet, identified as LGBT. This representation is only one component, however, of those individuals who are considered to be older adults.
Understanding the Older Adult Population
The very description of an older adult calls into question at what age one becomes an older adult. Historians have long recognized that persons as young as age 40 could be characterized as old as late as the early 1900s; the Age Discrimination in Employment Act (1967) covered discrimination of employees aged 40 and over. What does seem to be clear is that most people think of themselves as being “younger than” another person rather than “older than.” This statement illustrates that being older is somewhat subjective as well as dependent on the population under examination. For example, the age at which a farmer is considered old is 50 (Amshoff and Reed 2005), which is also the age that HIV/AIDS researchers place research participants in the older adult category (Goodroad 2003). Despite numerous subgroups within the population , many of whom age differently, the age at which recipients qualified for full Social Security benefits was set at age 65 in 1935. In the 1960s, the US government again de facto established old age as being 65 years old or the age when most persons qualify for Older Americans Act, Medicare, and Medicaid dollars and services. These rough age delineations do little to encapsulate what it means to be an older adult who is not a member of the majority group of older adults (at this point, Caucasian), the face of which is rapidly changing (see, especially, Chaps. 6–10). The focus of this chapter is to consider older persons with a minority status, and in many cases, more than one.
In order to understand what it means to be a person in a minority status as well as a person in a sexual minority status, we characterize the older adult population and older adult LGBT population and then present a brief discussion of normal age-related changes that many, but not all persons experience. The population of older adults represents the most rapidly growing age group in the US. For example, in 1990, older adults composed 13 % of the total population . By 2020, that number is estimated to increase to 18 % and to 25 % in 2050 (McKinney and Young 1985). In 2012, persons aged 65+ numbered 43.1 million, for an increase of 21 % since 2002, a number is projected to grow to 79.7 million by 2040. Moreover, the 85+ population, the most rapidly growing age cohort, is projected to increase from 5.9 million in 2012 to 14.1 million in 2040. Consequently, approximately one in every seven persons in the USA is an older adult: people aged 65+ represented 12.4 % of the population in the year 2000, a percentage projected to increase to 19 % by 2030 (West et al. 2014).
Persons who reach age 65 are projected to have an average life expectancy of an additional 19.2 years (20.4 years for females and 17.8 years for males). Because of their ability to live to longer, older women outnumber older men (24.3 to 18.8 million). Another reflection of that phenomenon is that in 2013, 36 % of older women were widows (Administration on Aging 2010). Also, older men are married far more frequently than are older women (i.e., 71 % of men vs. 45 % of women). About 28 % (12.1 million) of older persons live alone (8.4 million women and 3.7 million men); 45 % of women age 75+ live alone. In 2012, approximately 518,000 grandparents aged 65 or older assumed primary responsibility for their grandchildren who were living with them. In 2012, the median income of older persons was $27,612 for males and $16,040 for females, approximately 9.1 % of those persons were living below the poverty level (Administration on Aging 2010).
Within the older adult population are older adults who are LGBT. Mentioned in Chap. 1 and throughout this book, no accurate percentages of LGBT people in the US exist; however, most researchers estimate that approximately 3–7 % of the aging population are LGBT , most of whom identify as lesbians and gay men. Thus, between one and 3.5 million older lesbians and gay men, this number is expected to double by 2030 (Jackson et al. 2009). Individuals who are aging, those who are heterosexual and those who are LGBT, can expect to experience some age-related changes, typically starting around the fourth decade.
Age-Related Changes that May Affect Older Adults
Cognitive Changes. Changes in our understanding of the aging brain are among the most exciting in all of aging science. Though many adults worry about becoming more forgetful and worry that it is the first sign of Alzheimer’s Disease (AD), according to NIH Medline Plus (2007), scientists now know that people can remain both alert and able as they age, although it may take them longer to process their memories. The cognitive functions that aging affects most are attention and memory, which are not simultaneously affected—some aspects are relatively unaffected, while others may decline precipitously. Though the results of studies of psychometric testing of persons of older ages seem to paint a picture of overall cognitive decline, enormous variability exists across aging individuals. Many older people out-perform young people, at least on some cognitive tasks, and others of the same age do at least as well as their younger counterparts (Glisky 2007).
Internal Age-Related Changes. Internal changes occur as adults age. Although many changes occur gradually across an individual’s lifetime, the rate is dependent on heredity as well as environment (Rowe and Kahn 1998). Many changes are inter-related; however, the body has a remarkable variety of compensatory abilities that adjust to insults experienced over time. Stressed in previous sections, high variability exists as to when these age-related changes present.
Heart. Age-related changes in heart muscle cells help explain alterations in the heart as a whole. As the heart ages, it thickens, becomes less elastic, and may become enlarged. An older heart is less able to relax completely between beats, and its pumping chambers stiffen. Because the heart is unable to pump as vigorously as it once did, it is less able to supply adequate blood and oxygen to muscles during exercise (Young 2002).
Lungs. Age-related changes to the pulmonary system are associated with structural changes leading to a decline in function. The reduction in the diameter of small airways and their tendency for closing early contributes to air trapping and ventilation problems. With age, the lungs stiffen, making it harder for them expand and contract. The chest wall becomes more rigid, and the diaphragm and other muscles of respiration become weaker. A decreased cough reflex and a reduction in the number of cilia that sweep mucous up and out of the lungs results in increased likelihood of infection (Medline Plus 2010).
External Physical Changes
Generally accepted physical changes that occur as persons age include a reduction in physical height, usually more pronounced in women than in men (Currey et al. 1996), a decline in total body weight due to a loss of lean body mass, a decrease in bone strength, wrinkling and dryer skin (often exacerbated by exposure to UV rays), and changes in hair color. As with the above, physical changes that older adults experience are subject to great variability. One of the most significant factors thought to slow such changes is physical activity, which is now recommended for in all ages, and in sharp contrast to the prevailing wisdom of the early 1900s, when elder adults were encouraged to rest frequently and preserve their (remaining) strength (Buchner 1997; Roig et al. 2010). Below, we discuss a few examples of common age-related sensory changes.
Sensory Changes. Starting roughly around the fourth decade, eyesight weakens; around the sixth decade, cataracts and macular degeneration may develop for some individuals. Hearing may also decline with age. Mentioned earlier, variability exists within the population of older adults.
Eyesight. Around age 40, most individuals encounter weakened eyesight, and some experience cataracts and glaucoma. Certain adults may be less able to see objects at close distances or read fine print than in earlier years. For most, reading glasses or contact lens address the problem. Other adults are less able to see objects at far distances, and eyeglasses or contact lenses are helpful. Some individuals develop cataracts, which affects nearly 22 million Americans age 40 and older; by age 80, more than half of all Americans have cataracts (National Eye Institute 2008). Corrective surgery is now one of the most common surgeries done in the US. Annual eye examinations can help older adults protect themselves from developing severe eye problems that may occur for some, but not all older adults. Preventive measures (e.g., proper nutrition, wearing sunglasses, and physical activity) can help mollify eye problems that some older adults experience.
Hearing. About one-third of Americans between the ages of 65 and 74 have age-related hearing problems, and about half of adults aged 85 and older have hearing loss (National Institute on Deafness and Other Communication Disorders 2010). Another common problem that some older adults encounter is ringing, roaring, or other noises inside the ears. This problem, known as tinnitus, may be diminished when certain medicines or other health problems (e.g., allergies or atherosclerosis) are addressed.
The central message about age-related changes is that variability exists among older adults. Some adults experience age-related changes so small as to be barely noticeable. Others, however, experience such difficulties that their health and quality of life are greatly diminished. Although some age-related changes do occur over time, there are many opportunities and strategies to mitigate their affects.
Aging and Minority Status
Along with the general trends for America’s aging population and the age-related changes described earlier, many minority populations are living to older ages. In this section, we characterize the population of older adults living in a minority status. Below, we focus on older African-Americans, Hispanics, and Asians.
African-American Elders
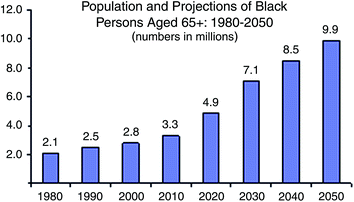
In 2008, the African-American older population was 3.2 million in 2008 and is projected to grow to over 9.9 million by 2050, when African American elders will compose 11 % of the older population. In 2008, 50 % of black elderly people lived in eight states: New York (9.1 %), Florida (7.1 %), California (6.5 %), Texas (6.4 %), Georgia (6.1 %), North Carolina (5.5 %), Illinois (5.4 %), and Virginia (4.4 %). In 2008, over 60 % of the black population aged 65 and older had completed high school, as compared with 1970, when only 9 % did so. Also in 2008, over 12 % of black older persons had a bachelor’s degree or higher. In 2008, 54 % of older Black men lived with their spouses, 11 % lived with other relatives, 4 % lived with non-relatives, and 30 % lived alone (Fig. 2.2).


Fig. 2.2
Population and projections for black elders. Source Administration for Community Living (2010). A statistical profile of black older Americans aged 65+. Retrieved from http://www.aoa.acl.gov/Aging_Statistics/minority_aging/Facts-on-Black-Elderly-plain_format.aspx
For older black women, 25 % lived with their spouses, 32 % lived with other relatives, 2 % lived with non-relatives, and 42 % lived alone. Households containing families headed by black persons aged 65+ reported a median income in 2008 of $35,025. The comparable figure for all older households was $44,188. The median personal income for black men was $19,161 and $12,499 for black women. Comparable figures for all elderly were $25,503 for men and $14,559 for women. The poverty rate in 2008 for black elders (65 and older) was 20 %, or more than twice the rate for all older adults (9.7 %). In 2007, black males had an average life expectancy at age 65 of an additional 15.3 years (to 80.3 years) and black women had a life expectancy of 18.7 additional years (to 83.7 years). These figures are 1.3 years less than the figures for all elderly men and 1.1 years less than the figure for all elderly women. (Administration for Community Living 2010) (see Chap. 7 for a discussion of African-American and LGBT elders).
Hispanic Elders
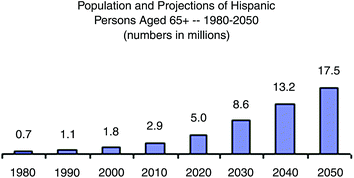
Making up 6.6 % of older adult, the Hispanic older population numbered 2.5 million in 2007 and is projected to grow to over 17 million by 2050, when they will compose 19.8 % of the older population. By 2019, Hispanic adults aged 65 and older will be the largest racial/ethnic minority in this age group. In 2007, 70 % of Hispanic persons aged 65 and over resided in four states: California (27 %), Texas (19 %), Florida (16 %), and New York (9 %). In 2007, about 42 percent of the Hispanic population aged 65 and older had finished high school, compared with 76 % of the total older population (Administration for Community Living 2010) (Fig. 2.3).


Fig. 2.3
Population and projections for Hispanic elders. Source Administration for Community Living (2010). A statistical profile of Hispanic older Americans aged 65+. Retrieved from http://www.aoa.acl.gov/Aging_Statistics/minority_aging/Facts-on-Hispanic-Elderly.aspx
In 2007, 65 % of Hispanic older men lived with their spouses, 17 % lived with other relatives, 3 % lived with non-relatives, and 15 % lived alone. For older Hispanic older women, 39 % lived with their spouses, 33 % lived with other relatives, 2 % lived with non-relatives, and 26 % lived alone. The percent of Hispanic elderly men and women living alone is lower than that of the general population. Also, the percent of Hispanic older persons living with other relatives is nearly twice that of the total older population (Administration for Community Living 2010).
Households containing families headed by Hispanic persons 65+ reported a median income in 2007 of $31,544 (as compared to $43,654 for non-Hispanic Whites). Among such Hispanic households, 16 % had an income of less than $15,000 (compared to 5.4 % for non-Hispanic Whites family households) and 45 % had incomes of $35,000 or more (compared to 62 % for non-Hispanic Whites). The poverty rate in 2007 for Hispanic older persons (65 and older) was 17.1 %. This was more than twice the percent for non-Hispanic Whites (7.4 %) (Administration for Community Living 2010) (see Chap. 10 for a discussion of Hispanic and LGBT elders).
Asian Elders
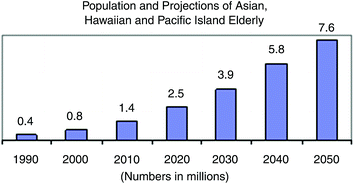
Older members of the older adult population who identified as Asian, Hawaiian, and Pacific Islander numbered over 1.3 million in 2008 (3.4 % of the older population) and is projected to grow to over 7.6 million by 2050, at that time accounting for 8.6 % of the older population. In 2008, almost 60 % of Asian, Hawaiian, and Pacific Island elders lived in just three states: California (40.5 %), Hawaii (9.6 %), and New York (9.2 %). In 2008, 74 % of the older Asian population aged 65 and older had finished high school. Also in 2008, almost 32 % of Asian older persons had a bachelor’s degree or higher. The percent of high school graduates among older Asians is almost as high as the percent among all older persons (77 %). However, the percent of older Asians in 2008 who had a bachelor’s degree or higher (32 %) was over 50 % higher than for the overall older population. Furthermore, the percent of male Asians who had a bachelor’s degree or higher (40 %) is almost 50 % higher than for the overall older population (27 %) (Administration for Community Living 2010) (Fig. 2.4).


Fig. 2.4


Population and projections for Asian, Hawaiian, and Pacific Island elders. Source Administration for Community Living (2010). A statistical profile of Asian older Americans aged 65+. Retrieved from http://www.aoa.acl.gov/Aging_Statistics/minority_aging/Facts-on-API-Elderly2008-plain_format.aspx
Stay updated, free articles. Join our Telegram channel

Full access? Get Clinical Tree


