Highlights
- •
Significant correlation between HbA1c and prostate cancer mortality not incidence.
- •
26% and 21% increase in the risk of CSM and ACM for each 1% increase in HbA1c.
- •
Integrating glycemic control is meaningful in prostate cancer risk assessment.
Abstract
Objectives
To evaluate the correlation between serum glycosylated hemoglobin (HbA1c) levels and the risk of prostate cancer incidence and mortality, providing a comprehensive analysis to inform preventative and clinical strategies.
Methods
A systematic review and meta-analysis was conducted including studies based on their documentation of prostate cancer incidence and mortality related to HbA1c levels, with a minimum of 3 risk-related data levels. The Newcastle-Ottawa Quality Assessment Scale (NOQAS) was used for quality assessment and risk of bias evaluation. We employed generalized least squares (GLS) to assess the linear trend within individual studies and combined these estimates using a random effects model. Additionally, we utilized a restricted cubic spline (RCS) model to investigate potential nonlinear trends.
Results
A total of 13 studies were included in the quantitative synthesis ultimately. The quantitative analysis did not find a significant association between HbA1c levels and prostate cancer incidence. However, a significant positive correlation was revealed between HbA1c levels and both cancer-specific mortality (CSM) and all-cause mortality (ACM), with a 1% increase in HbA1c levels associated with a 26% increase in CSM and a 21% increase in ACM.
Conclusion
The HbA1c level is significantly associated with increased prostate cancer mortality. The results highlight the importance of considering blood sugar control in the comprehensive risk assessment for prostate cancer, particularly among the nondiabetic population.
1
Introduction
As of today, prostate cancer remains the second most common malignancy among men on a global scale. It is estimated that there were 1.4 million new cases and 375,000 fatalities worldwide in 2020 [ ]. Despite the fact that the implementation of prostate-specific antigen (PSA) screening in certain regions has elevated the detection rate of prostate cancer, leading to earlier diagnoses for many patients, the mortality rates associated with prostate cancer seem to exhibit little variance on a global scale [ ]. In some areas, such as China, there is even a gradual increase in the mortality rate [ ].
Although the roles of genetic factors and germline mutations in the development and progression of prostate cancer, especially the more aggressive forms, have been well documented, a diverse set of exogenous or environmental factors also significantly influence the onset and progression of the disease [ ]. These environmental factors have garnered increased attention from biologists, epidemiologists, and clinicians due to their potential for targeted preventive interventions. The spectrum of potential exogenous factors includes dietary patterns, metabolic syndrome, obesity, diabetes and metformin, cholesterol and statins [ ]. Our previous meta-analysis has elucidated the positive impact of statin therapy on extending the biochemical recurrence-free survival in prostate cancer patients, notably those with high-risk conditions [ ]. The emphasis on these factors is propelled by the opportunity to apply preventive measures that could effectively reduce the risk and slow the progression of prostate cancer.
Within various risk factors, the association between diabetes and prostate cancer is notably intricate and controversial. Systematic reviews have revealed an inverse correlation between diabetes and prostate cancer, suggesting that diabetes is associated with decreased risk of prostate cancer [ ]. Paradoxically, diabetes seems to be associated with increased mortality among prostate cancer patients [ ]. Furthermore, diabetes is deeply entwined with other risk factors such as obesity and metabolic syndrome, which are established contributors to the incidence and mortality of prostate cancer [ , ]. Actually, the impact of diabetes on individuals and tumors represents a chronic and ongoing process. Glycated hemoglobin (HbA1c) serves as a biomarker for glycemic dysregulation and stands out as a more comprehensive indicator of a patient’s glycemic status, capturing the average blood sugar levels over a period of 2 to 3 months, as opposed to blood glucose, which provides a snapshot of only the short-term metabolic state [ ]. HbA1c would further receive attention by its potential relevance to prostate cancer risk, even in individuals without a formal diabetes diagnosis. However, the relationship between varying levels of HbA1c and the incidence and mortality of prostate cancer remains to be thoroughly deciphered.
In our study, we have undertaken a systematic review and meta-analysis to assess the association between HbA1c and the incidence and mortality of prostate cancer. We would employ regression modeling to dissect the dose-response relationship between HbA1c levels and the incidence and mortality of prostate cancer. Unveiling potential correlations between glycemic metabolism and prostate cancer is not only important for preventative strategies and therapeutic interventions but also for redefining the risk assessment paradigm for prostate cancer in the nondiabetic demographic. This endeavor holds promise for broadening our understanding and potentially transforming clinical approaches to prostate cancer management.
2
Materials and methods
2.1
Search strategy and study selection
We conducted our systematic review adhering to the guidelines of the Preferred Reporting Items for Systematic Reviews and Meta-Analyses (PRISMA) and registered our project with the PROSPERO system, bearing the registration number CRD42024522828 [ ]. Our search for studies linking prostate cancer incidence and mortality with HbA1c levels spanned across the MEDLINE, EMBASE, and Cochrane Central Search Library databases, encompassing records from their inception up to May 1, 2024. For inclusion in the quantitative meta-analysis, studies should document the incidence and mortality of prostate cancer associated with HbA1c levels and provides a minimum of 3 distinct levels of risk-related data to ensure combined analysis.
Our search strategy leveraged a comprehensive set of Medical Subject Headings (MeSH) terms: (“hemoglobin a1c” OR “hba1c” OR “glycated hemoglobin” OR “glycosylated hemoglobin” OR “a1c” OR “haemoglobin a1c” OR “glycated haemoglobin” OR “glycosylated haemoglobin” OR “glycohemoglobin a” OR “glycohaemoglobin a”) AND (“prostate cancer” OR “prostate tumor” OR “prostate tumour” OR “prostate neoplasm” OR “prostate neoplasia”). Besides, these terms were employed as free-text search keywords and phrases. Our review included articles in languages other than English, excluding case reports, conference proceedings, and review articles. In instances where data were incomplete, we made efforts to reach out to the corresponding authors for additional information. The literature search was carried out independently by multiple researchers, with the final decisions on the inclusion or exclusion of studies being made by senior researchers Chuanyu Sun and Qingfeng Hu.
2.2
Quality assessment and data extraction
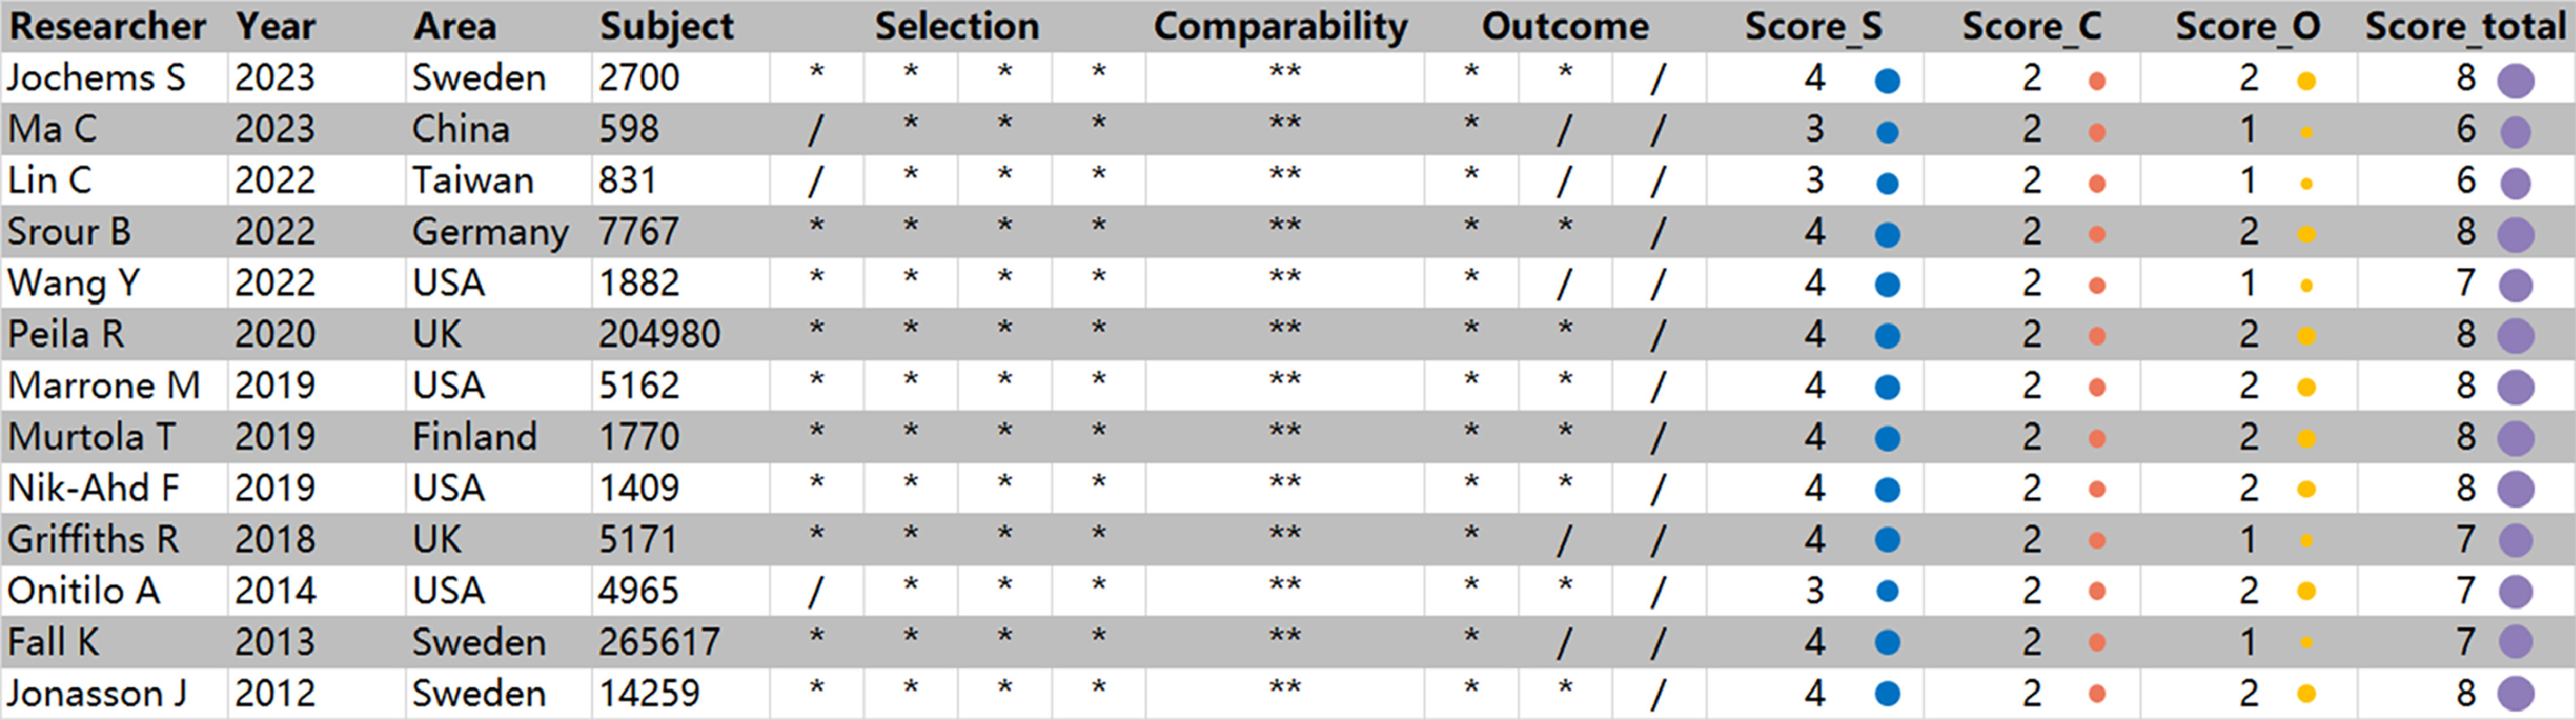
We utilized the Newcastle-Ottawa Quality Assessment Scale (NOQAS) to assess the risk of bias and methodological quality of the cohort studies included in our review meticulously [ ]. This comprehensive scale encompasses 8 criteria, with a scoring system that ranges from 0 to 9, categorized into 3 pivotal dimensions: selection, comparability, and outcome. Notably, the comparability criterion could be awarded up to 2 points, while each of the other criteria could receive a maximum of 1 point.
In the process of data extraction for each study, we selected the adjusted model with the most extensive variable adjustment to optimize the utilization of available information and mitigate the impact of confounding factors. We were cognizant that this approach, while beneficial, may introduce additional heterogeneity among studies during data synthesis, given the variability in the factors adjusted across different studies.
For the quantitative synthesis of our research, we extracted HbA1c dose levels alongside the associated incidence of prostate cancer, cancer-specific mortality (CSM), and all-cause mortality (ACM). This extraction included a comprehensive set of data points: the number of observations, the count of cases, the duration of follow-up, and the accumulation of person-years at each HbA1c stratum. For studies that reported only the number of observations alongside risk estimates and their corresponding confidence intervals (CI), we calculated the missing case numbers to ensure their inclusion in our quantitative analysis.
In determining the exposure dose, we prioritized the dosage levels explicitly stated in the literature. When faced with a range of HbA1c levels, we selected the midpoint of this range as the representative exposure dose. For open-ended intervals, such as HbA1c levels exceeding 8%, we adhered to the guidance provided by Berlin and colleagues, adopting the calculated boundary value of 8% × 1.2 = 9.6% as the threshold for exposure dosage [ ].
To address the variance in reporting standards between the International Federation of Clinical Chemistry and Laboratory Medicine (IFCC) and the National Glycohemoglobin Standardization Program (NGSP), we employed a standardized conversion formula: NGSP (%) = (0.0915 × IFCC [mmol/mol]) + 2.15 (%). This formula facilitated the harmonization of HbA1c values into a uniform percentage format for consistency across studies.
2.3
Data synthesis and statistical analysis
All statistical analyses were performed using STATA 17.0 software. We evaluated the incidence and mortality of prostate cancer over the observational period. Following Orsini’s methodology, we calculated the number of cases and person-years for prostate cancer at each HbA1c level and compiled these data into contingency tables [ , ]. The risk ratios were converted to their natural logarithms for analysis.
For each HbA1c level, adjustments were made by subtracting the reference level specific to each study, ensuring an intercept-free regression model that implies a direct linear relationship through the origin. We employed a 2-step generalized least squares (GLS) approach to assess the linear trend within individual studies and combined these estimates using a random effects model. The significance threshold was set at 0.05.
Additionally, we utilized a restricted cubic spline (RCS) model with knots at the 10th, 50th, and 90th percentiles to investigate potential nonlinear trends. The model tested the null hypothesis that the coefficient associated with the second spline equaled zero at a significance level of 0.05. A P- value from the chi-square test for goodness of fit below the threshold of 0.1 indicated an inadequate model fit, suggesting significant heterogeneity among the data.
3
Results
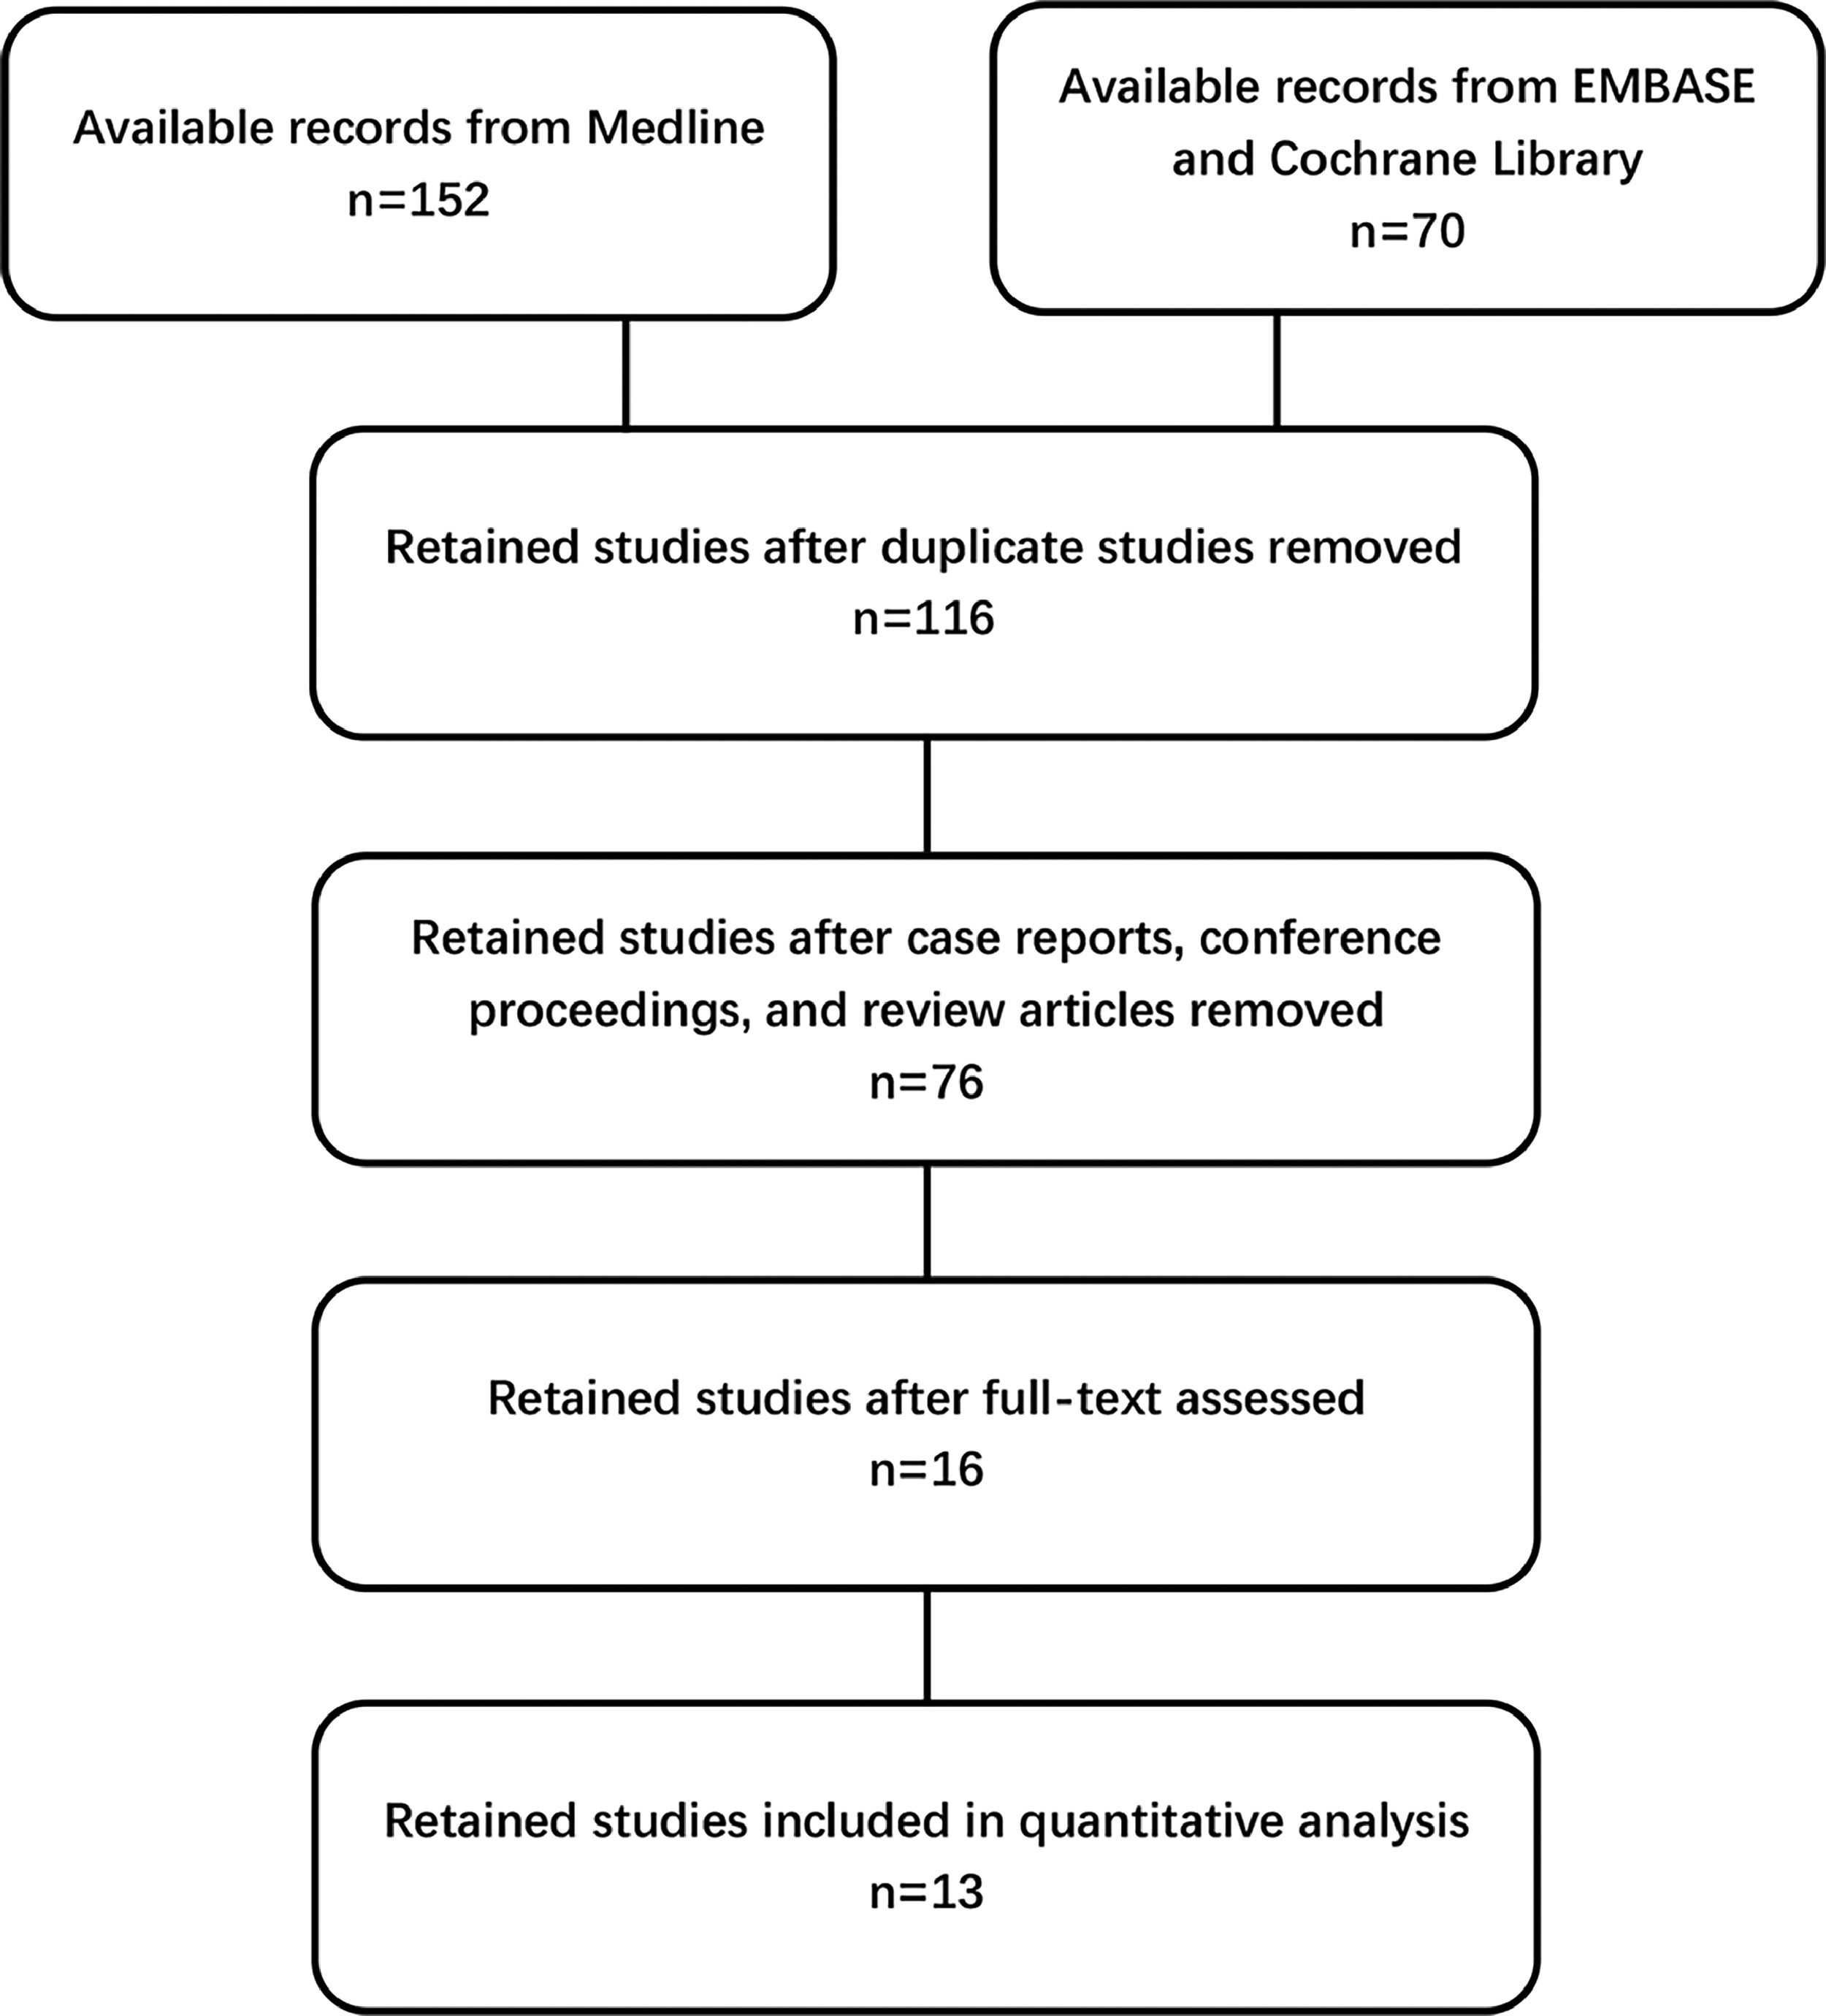
The screening methodology of our systematic review was outlined in a flowchart ( Fig. 1 ). Initially, our search yielded 116 studies, in which we de-duplicated, focusing on the correlation between prostate cancer incidence and mortality with HbA1c levels. Further refinement through the exclusion of case reports, conference notes, and review articles narrowed our pool to a curated selection of 76 studies. A thorough evaluation of both abstracts and full texts identified 16 studies that met the stringent criteria for meta-analysis inclusion. Among these, we discerningly selected studies that provided the most recent and comprehensive data, despite the overlap in datasets. Ultimately, our final quantitative synthesis included 13 carefully chosen studies, with 9 studies, 4 studies and 6 studies respectively reporting on the incidence of prostate cancer, CSM and ACM related to HbA1c [ ]. Additionally, we evaluated the methodological quality and potential risk of bias for each cohort study using the NOQAS scale ( Fig. 2 ). The results consistently showed scores ranging from 6 to 8 across all cohorts. These studies drew their subjects from extensive epidemiological surveys or renowned regional medical centers, ensuring a high level of representativeness. The study designs accounted for a variety of significant confounding factors, and the use of definitive laboratory assessments and comprehensive record linkages bolstered the objectivity and precision of the outcomes. A notable limitation, however, was the relatively high rate of follow-up loss and the fact that some studies had follow-up periods of less than 5 years. Considering the typically extended course of most prostate cancer patients, this duration might not be sufficient to observe a full spectrum of outcome events.
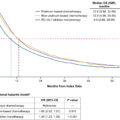
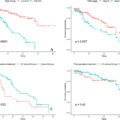
In our quantitative analysis of prostate cancer incidence, 2 cohorts revealed a correlation between elevated HbA1c level and increased risk of prostate cancer, while 3 cohorts reported the opposite trend, suggesting that elevated HbA1c level was related to reduced incidence of the disease. Moreover, 4 cohorts observed no significant association between HbA1c levels and prostate cancer incidence ( Table 1 ). Subsequent analysis employing the random-effects model to assess the dose-response relationship disclosed no significant association between HbA1c levels and prostate cancer incidence for both linear ( P = 0.441) and nonlinear models ( P = 0.604) ( Fig. 3 ). Regarding the mortality analysis of prostate cancer, 2 cohorts demonstrated a positive correlation between elevated HbA1c level and increased CSM, whereas 2 other cohorts reported no such association ( Table 2 ). Subsequent analysis employing the random-effects model uncovered a significant linear relationship between HbA1c levels and CSM (relative risk, RR=1.26, 95% confidence interval, CI = 1.140–1.394), signifying a 26% increase in the risk of prostate cancer CSM for each 1% increase in HbA1c ( Fig. 4 A). In parallel, 4 cohorts demonstrated a positive correlation between elevated HbA1c level and increased ACM, while 2 other cohorts reported no such association ( Table 3 ). Subsequent analysis uncovered a significant linear relationship between HbA1c levels and ACM (RR = 1.207, 95% CI = 1.108–1.315), signifying a 21% increase in the risk of prostate cancer ACM for each 1% increase in HbA1c ( Fig. 4 B). However, attempts to identify nonlinear associations using the RCS model were unsuccessful for both CSM and ACM ( P = 0.646 and P = 0.980).
| Researcher | Year | Subjects | Case | RR | 95% CI | P -value | Goodness of fit ( P -value) |
|---|---|---|---|---|---|---|---|
| Jochems S. | 2023 | 2,700 | 586 | 0.921 | 0.833–1.019 | 0.112 | 0.425 |
| Srour B. | 2022 | 1,847 | 585 | 0.951 | 0.870–1.038 | 0.259 | <0.001 |
| Wang Y. | 2022 | 1,882 | 703 | 1.005 | 0.933–1.082 | 0.898 | 0.079 |
| Peila R. | 2020 | 204,980 | 5784 | 1.053 | 1.016–1.092 | 0.005 | <0.001 |
| Marrone M. | 2019 | 4,753 | 671 | 1.190 | 1.086–1.303 | <0.001 | 0.298 |
| Griffiths R. | 2018 | 5,171 | 1131 | 1.006 | 0.964–1.050 | 0.777 | <0.001 |
| Onitilo A. | 2014 | 4,956 | 237 | 0.815 | 0.714–0.931 | 0.003 | 0.190 |
| Fall K. | 2013 | 265,617 | 44,322 | 0.947 | 0.932–0.962 | <0.001 | 0.030 |
| Jonasson J. | 2012 | 2,5476 | 740 | 0.930 | 0.887–0.974 | 0.002 | 0.701 |
| Meta-analysis in GLS | Linear model | 0.982 | 0.937–1.029 | 0.441 | <0.001 | ||
| Nonlinear model | 0.604 | <0.001 | |||||
Related posts:
 Optimal imaging techniques across the spectrum of testicular cancer
 Defining the genetic profile of prostate cancer
 Real-world survival and economic burden among patients with locally advanced or metastatic urothelial carcinoma in the United States
 The value of a postoperative nomogram based on the primary tumor score for overall survival of patients with renal cell carcinoma and inferior vena cava tumor thrombus
 Germline genetic testing for prostate cancer: Ordering trends in the era of expanded hereditary cancer screening recommendations
 Navigating the gray zone: Machine learning can differentiate malignancy in PI-RADS 3 lesions
Stay updated, free articles. Join our Telegram channel

Full access? Get Clinical Tree


