Fig. 35.1
Cumulative incidence of second neoplasms with death as a competing risk (Armstrong et al. 2009)
Fig. 35.2
Etiologic factors involved in multiple cancer development (Travis et al. 2012)
Outcomes of patients treated for a SMN after a childhood CNS tumor are almost universally dismal (Carret et al. 2006; Neglia et al. 2006; Paulino et al. 2008; Taylor et al. 2009; Walter et al. 1998). Patients have often been treated with the maximum amount of tolerable therapy for their primary disease and have few treatment options available. Therefore, it is important to take any steps possible to mitigate the risk of SMNs during primary therapy for a CNS tumor while preserving chance of cure and to perform active long-term surveillance in survivors of childhood CNS tumors.
With therapies rapidly changing and our genetic understanding of secondary cancers still in its infancy, it can be difficult to predict risk in children undergoing treatment for CNS tumors. Nevertheless, as multimodality therapy becomes more common, and our ability to support children through more intensive treatment regimens improves, survival rates will continue to increase, and SNs will become an increasingly important clinical entity.
35.2 Genetic and Familial Factors Influencing the Risk of Second Neoplasms
Just as with primary tumors of the CNS, the etiology of SNs in children is multifactorial. While cancer therapies do play a role (see below), it is becoming increasingly apparent that genetic factors contribute as well (Kony et al. 1997; Korones et al. 2003; Kuenzle et al. 1994; Little et al. 1998; Salminen et al. 1999). Salminen and colleagues examined the Finnish Cancer Registry from 1953 and 1994 and found that patients diagnosed with primary CNS tumors were at a higher risk for SNs when treated with surgery alone. Patients treated without radiotherapy had a standard incidence rate (SIR) of 2.0, suggesting that host factors including genetic predisposition may contribute to SMN formation (Salminen et al. 1999). Cardous-Ubbink and colleagues demonstrated an even higher risk of secondary malignancy among a child only cohort treated with surgery alone in Amsterdam (SIR 13) (Cardous-Ubbink et al. 2007). Children with CNS tumors may be especially at risk. Little and colleagues examined a cohort of 4400 patients treated for childhood cancer and found first CNS tumor was found to predict for second tumor of the CNS compared to other locations of first primary (Little et al. 1998). When examining patients with any genetic syndrome they found a RR of 8.28 for development of SN of the CNS. This association was not found to be statistically significant when removing patients diagnosed with neurofibromatosis 1 (NF1), likely because of the large number of participants with this diagnosis in this study (Little et al. 1998).
There are several well-described familial tumor syndromes that predispose children to a higher risk of CNS tumors (Table 35.1) (Pan and Prados 2003). Children with familial syndromes are included in large SN analyses from the Childhood Cancer Survivorship Study (CCSS), the British Childhood Cancer Survivor Study (BCCSS), and the Surveillance, Epidemiology, and End Results (SEER) database. Children diagnosed with a primary CNS neoplasm are not routinely screened unless clinically indicated, making the true incidence of SN difficult to determine. Children with these familial syndromes can make up as much as 20% of participants in some series (Tsui et al. 2015; Kony et al. 1997), and rates may be higher when all genetic causes are considered (Broniscer et al. 2004). Various case series have associated the occurrence of SMNs with specific genetic syndromes in children with primary brain tumors (Garwicz et al. 2000; Kingston et al. 1987; Little et al. 1998; Meadows et al. 1985; Stavrou et al. 2001; Torres et al. 1997).
Table 35.1
Familial tumor syndromes of the CNS
Syndrome | Characteristic CNS lesion | Characteristic skin lesion | Opthalmologic feature | Chromosome | Gene | Protein |
|---|---|---|---|---|---|---|
NF-1 | Optic pathway glioma, brainstem glioma | Café-au-lait spots, axillary freckling | Lisch nodule | 17q11 | NF1 | Neurofibromin |
NF-2 | Bilateral acoustic neuroma, multiple meningiomas | NF-2 plaque, subcutaneous schwannomas | 22q12 | NF2 | Merlin | |
Retinoblastoma | Pineoblastoma | Leukokoria | 13q14 | Rb1 | Rb1 | |
Von-Hippel-Lindau | Hemangioblastoma of the cerebellum/spine | Retinal angioma | 3p25 | VHL | VHL | |
Tuberous Sclerosis | Subependymal giant cell astrocytoma, subependymal nodule, cortical tuber | Ash-leaf spots, adenoma sebceum, Shagreen patch Ungal fibroma | Retinal astrocytoma | 9q34, 16p13.3 | TSC1, TSC2 | Hamartin, Tuberin |
Stuge-Weber | Leptomeningeal angiomatosis, cortical calcifications, hemispheric atrophy | Port-Wine nevus | Choroidal hemangioma, glaucoma | |||
Turcot | Glioblastoma, brain tumor polyposis type 1 and 2, medulloblastoma | 5q21 | APC | |||
Gorlin (nevoid basal cell carcinoma) | Medulloblastoma | Basal cell carcinoma | 9q22.3 | PTCH | ||
L’hermitte-Duclos/Cowden | Dysplastic gangliocytoma of the cerebellum | Facial trichilemmoma | 10q23.3 | PTEN | ||
Li-Fraumeni | Malignant gliomas, PNET | 17q (between exon 5 and 9) | P53 |
The association between NF1 and SN is well known (Garwicz et al. 2000; Kingston et al. 1987; Little et al. 1998; Meadows et al. 1985; Sharif et al. 2006; Friedman and Birch 1997). Children with NF1 have both an increased risk for brain tumor development and possibly an increased susceptibility to treatments such as radiotherapy (Sharif et al. 2006). Especially at risk are patients who have developed an optic pathway glioma (OPG). One cohort of patients with OPG had a 20% rate of second tumors when treated without radiotherapy, and 50% rate for patients treated with radiotherapy (Sharif et al. 2006). Other studies have estimated the risk to be between 11 and 52% (Korones et al. 2003; Kuenzle et al. 1994). Nevoid basal cell carcinoma syndrome (NBCCS) has also been described as being found in higher than expected incidences in patients diagnosed with SMNs after treatment of a primary CNS tumor (Albrecht et al. 1994; Kingston et al. 1987; Stavrou et al. 2001).
There is an increased genetic risk of SN development for some patients independent of familial cancer syndromes. Kony and colleagues performed a case-control study of 25 patients diagnosed with SMNs out of 649 children treated at a single institution. Patients with family members who had early onset of cancer had an odds ratio (OR) for subsequent SMN development of 4.7 (Kony et al. 1997). A genetic susceptibility to treatment may contribute to this elevated risk. Flint-Richter and colleagues examined 525 families and discovered that patients who developed a meningioma after cranial radiation for tinea capitis had a higher rate of first-degree family members with meningioma (11%) compared to those who did not develop a meningioma after radiation therapy for tinea capitis (1%) suggesting a genetic predisposition (Flint-Richter and Sadetzki 2007).
Further evidence is supplied from the CCSS. Friedman and colleagues examined siblings of patients enrolled in the CCSS diagnosed with a primary CNS neoplasm and noted a trend for a higher SIR of cancer diagnosis. This rate was higher for siblings (SIR of 2.4) and offspring (SIR of 15.0) of CCSS study participants who were diagnosed with a SN themselves (Friedman et al. 2005). This association is not observed in parents, children, or siblings of patients diagnosed with childhood cancer who did not develop a SN when accounting for known cancer hereditary syndromes (Olsen et al. 1995, 2009; Sankila et al. 1998; Winther et al. 2001; Friedman et al. 2005). Apart from rare hereditary cancer syndromes, pediatric cancer itself does not seem to be a marker of increased risk in families; however, it does seem that some children who develop a SN may have an unknown genetic predisposition. Our knowledge of familial cancer syndromes is not complete, and there are certain patient families that are likely at an increased risk for cancer that is not yet attributable to a named syndrome.
35.3 The Effects of Cancer Therapies on Neoplasm Development in the Central Nervous System
Today, children diagnosed with a primary malignancy of the CNS will receive a wide variety of cancer treatments, each with its own profile of adverse events and risk for long-term complications. Increasingly, many children are being treated with bimodality or trimodality therapy; this has contributed to the truly historic gains made in survival after treatment.
Radiotherapy is the most common cancer therapy implicated in increasing the risk of SNs. However, some systemic treatment regimens used for primary CNS cancer can increase the rate of SMNs, either alone or in combination with radiotherapy (Duffner et al. 1998; Relling et al. 1999; Walter et al. 1998). In addition to the increased risk seen with intravenous chemotherapy, intrathecal methotrexate has been shown to increase the rate of SMNs in the CNS in survivors of childhood cancer independent of the effects of other risk factors (Taylor et al. 2010).
35.3.1 Increased Risk in Healthy Individuals
Fractionated radiotherapy has been shown to induce malignant brain tumors in non-human primates at a high rate after 35 Gy delivered over 2 weeks (Lonser et al. 2002). Data in humans are limited, however, examining patients treated with therapeutic radiation for noncancerous diseases of the head and neck as well as survivors of the atomic bomb yield some insights. Even though the carcinogenic effects of ionizing radiation to induce non-CNS tumors has been recognized for some time, the potential for SNs of the CNS was recognized much later.
Our understanding of neoplasm development after exposure to total body ionizing radiation therapy comes mainly from survivors of the atomic bomb detonations in Japan. Although an increased risk of developing any cancer is seen (Peterson et al. 2006), specifically identifying the risk of CNS tumors, is difficult given the small number of cases. Still, an association has been shown between radiation exposure and non-brain nervous system tumors in atomic bomb survivors (Thompson et al. 1994). In addition to atomic bomb exposure, therapeutic radiation exposure for various benign conditions, including ankylosing spondylitis, tonsillitis, and tinea capitis, in childhood has been associated with increased incidence of CNS tumors (Darby et al. 1987; Shore et al. 2003; Shore-Freedman et al. 1983).
In one of the largest reported experiences, approximately 20,000 Israeli adults and children were treated with therapeutic radiotherapy to the head for tinea capitis between 1948 and 1960. Shortly after treatment, researchers began following this cohort to better understand ionizing radiation’s effects on otherwise healthy brains and meninges. After 40 years of follow-up, Sadetzki and colleagues reported the outcomes of over 10,000 of these children matched with sibling and population controls and found an increased risk of SN with exposure to therapeutic radiotherapy (Sadetzki et al. 2005). This elevated risk was found to be dependent on the dose received, as well as age at delivery. An excessive relative risk (RR) of 4.63/Gy and 1.98/Gy were reported for benign and malignant CNS tumors, respectively. This translated to an excess absolute risk (EAR) of 0.48/Gy and 0.34/Gy per 10,000 person years. Younger children were at increased risk. The risk of developing a malignant brain tumor was 3.56/Gy for children 4 and younger and only 0.47/Gy for children over the age of 10 at the time of radiation exposure.
35.3.2 Increased Risk in Individuals with Non-CNS Neoplasms
An increased incidence of SNs of the CNS has been observed in children with leukemia who receive prophylactic cranial irradiation to mitigate the high risk of CNS leukemia relapse (Bhatia et al. 2002; Hijiya et al. 2007; Jenkinson and Hawkins 1999; Loning et al. 2000; Neglia et al. 1991; Nygaard et al. 1991; Perkins et al. 2013). Various individual institution and large database outcomes are shown in Table 35.2. Taken together, the data strongly demonstrate that even in children without primary CNS cancer, cranial irradiation appears to increase the risk of SNs in the brain.
Table 35.2
Selected series describing secondary malignancy risk after childhood leukemia
Author | Institution | N | Years | Cranial XRT | Interval since treatment | Standardized incidence ratio for CNS tumors | Cumulative risk of any second malignancy | Predictive factors |
|---|---|---|---|---|---|---|---|---|
Neglia | Children’s Cancer Study Group | 9720 | 1972–1988 | NR | 0.3–13.2 | 21.7a | 2.5% at 15 years | XRT, age ≤ 5 |
Nygaard | Nordic | 981 | 1958–1985 | 58.4% | 7.5–16.5 | 26.7 (5.5–78.1)b | 2.9% at 20 years (8.1% with XRT) | XRT |
Jenkinson | National Registry of Childhood Tumors (UK) | 3961 | 1962–1987 | 87% | NR | 23 (11–43)c | 0.5% at 10 yearsc | XRT |
Loning | German Childhood Cancer Registry | 5006 | 1979–1995 | 77.2% | 1–15 | 18.6 (9.8–29.4) | 3.3% at 15 years (1.0% for CNS) | XRT, age ≤ 7 |
Bhatia | Children’s Cancer Group | 8831 | 1983–1995 | 38% | 1.1–15.8 | 10.1 (5.9–16.2) | 1.18% at 10 years (0.82% for CNS) | Males, XRT, relapse |
Hijiya | St. Jude | 2169 | 1962–1998 | NR | 1.7–31.7 | 31.8 (19.7–47.6) | 10.85% at 30 years (1.17% at 15 years for CNS excluding meningioma) | No SS |
Children diagnosed with primary CNS tumors will likely need surveillance following successful therapy. It is important to remember that diagnostic scans using ionizing radiation, such as CT scans, have been shown to independently increase the risk of SMN for children without cancer. Increased risk of leukemia and CNS tumors were primarily observed, with the risk rising with increased cumulative childhood dose and younger age at exposure (Mathews et al. 2013; Pearce et al. 2012).
35.3.3 Increased Risk in Individuals with CNS Neoplasms
35.3.3.1 Radiotherapy
External beam radiotherapy was one of the first identified risk factors for SN development, but interpretation is difficult. The accepted dose prescriptions and treatment volumes vary widely for different primary CNS tumors. Dose level, targets, and technology used to shape distribution can vary from institution to institution, by clinical trial randomization, and by era the child was treated for the first malignancy. These issues complicate the elucidation of the role of radiotherapy dose and volume in population-based series of patients treated over extended periods of time or between institutions that used different approaches.
Armstrong and colleagues found that the use of radiotherapy for the primary CNS tumor to be predictive of secondary neoplasm risk in their examination of a cohort of children in the CCSS treated for CNS primaries (Armstrong et al. 2009). When the authors further analyzed patients by dose of radiation received, they found that at 25 years after diagnosis, children who received 50 Gy or more had a 7.1% (95% CI 4.5–9.6%) cumulative incidence of CNS-SNs compared to 1.0% (95% CI 0–2.3) for no radiation exposure (p < 0.001). Those who received less than 50 Gy radiation had an intermediate cumulative incidence of 5.2% (95% CI 2.1–8.3). This correlation with a high radiation dose was also shown by others and suggests a dose response (Chojnacka et al. 2014; Vinchon et al. 2011). There is emerging evidence in pediatric cancers that while radiation therapy increases the risk of SN, the contribution of radiation therapy is not seen until after 5 years (Svahn-Tapper et al. 2006). It is not known if this delayed risk is seen in specifically in patients with primary CNS tumors.
These data showing a potential dose response for secondary malignancy risk in children with primary CNS tumors is consistent with the findings of Neglia and colleagues who demonstrated a dose response in children diagnosed with primary cancer from any site that subsequently developed a CNS secondary neoplasm (Fig. 35.3). They demonstrated a linear relationship for excessive RR and calculated a slope of 0.33 per Gy for secondary gliomas and 1.06 per Gy for secondary meningiomas (Neglia et al. 2006). A slope of 0.69 per Gy was calculated for all secondary CNS tumors. Radiation therapy dose was also found to be predictive of second neoplasms of the CNS in the BCCSS as well (Taylor et al. 2010). Taylor and colleagues demonstrated an elevated RR of 5.1 per Gy for secondary meningiomas and 0.08 per Gy for glioma/PNETs. Both age at exposure and genetic susceptibility influence these risks (Taylor et al. 2010).
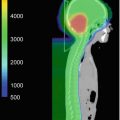
Fig. 35.3
Relative risk of subsequent gliomas and meningioma within the Childhood Cancer Survivor Study cohort by radiation dose (Neglia et al. 2006)
35.3.3.2 Cytotoxic Chemotherapy
More children are receiving cytotoxic chemotherapy for cancer treatment than ever before. Chemotherapy such as alkylating agents and topoisomerases are commonly thought to have the potential to promote SMNs in children. Other antimetabolite therapies have been implicated as well (Relling et al. 1999; Klein et al. 2003). Examining the influence of chemotherapy is difficult in large registries of patients given the often-limited information available; still, some information can be gleamed from these databases. In an analysis of the US SEER cancer registry, the most important risk factor for developing a SMN in 5-year survivors of childhood primary CNS cancer was the era in which the primary cancer was diagnosed and treated (Peterson et al. 2006). Compared to patients treated before 1979, patients treated after 1985 had a 6.7 fold increase in risk. Even after controlling for the use of radiotherapy, treatment era was the most important factor. This trend has been observed in other studies as well; with some studies report that chemotherapy alone or in conjunction with radiotherapy increases risk of SN (Maule et al. 2008; de Vathaire et al. 1999; Guerin et al. 2007). Noting that high dose chemotherapy was first used for the treatment of brain tumors in children in the late 1980s, the authors question if chemotherapy is increasing the rates of secondary malignancies either as a sole agent, or more likely, in combination with radiotherapy (Peterson et al. 2006).
Multi-institutional clinical trials and single institutional series can examine chemotherapies effect on SMNs among more homogenous treatment populations or with more detailed records than can be done with population-based studies. Duffer and colleagues reported the results of a Pediatric Oncology Group (POG-8633) study in which children younger than 3 years of age with malignant brain tumors received prolonged postoperative chemotherapy with delayed radiotherapy (Duffner et al. 1998). Participants received vincristine, cyclophosphamide, cisplatinum, and etoposide for 12 or 24 months depending on age. For children treated when younger than 2 years, the authors report a 18.9% cumulative risk of SN at 8 years. This very high rate of SN, especially SMN, is partially a result of the young age at which the children were treated and the amount of chemotherapy they received over the study period (Duffner et al. 1998). This variation in susceptibility to the secondary neoplastic potential of radiation therapy may be related to the increased proliferation of tissues in younger children or the comparatively high number of undifferentiated stem cells. Additionally, young children’s tissues are exposed to growth hormones at a higher level and for greater amounts of time, possibly leading to increased cancer propagation (Tubiana 2009).
Series of older children have demonstrated high rates of SN formation as well, albeit not as high as that seen in the POG Study. In the Children’s Oncology Group (COG) A9961 trial, children with average risk medulloblastoma were treated with craniospinal irradiation and chemotherapy. Patients had a cumulative incidence of second neoplasms of 4.2% at 10 years (Packer et al. 2013). Similarly, patients treated as part of the German HIT ‘91 trial for medulloblastoma were found to have an overall rate of second malignancies of 4.3%(von Hoff et al. 2009). While all patients received cranial spinal irradiation, patients treated on the more aggressive sandwich arm developed more second malignancies than patients treated with maintenance chemotherapy (6.3% vs. 2.6%).
Given the increasing reports of high rates of SMNs in the literature, Tsui and colleagues examined 2779 patients treated at St. Jude Children’s Research Hospital for a primary CNS tumor from 1985 to 2012 (Tsui et al. 2015). While they noted a cumulative incidence of second neoplasms for patients with medulloblastoma or PNET treated with multimodality therapy of 12.0% at 20 years, they did not see any difference in those patients treated when they compared the patients to a similar group of patients who received radiotherapy alone. There was, however, a statistically significant difference favoring more SNs in the multimodality arm when examining the cumulative incidence at 10 years (Tsui et al. 2015). This suggests that the addition of chemotherapy may change the temporal pattern of SN development, but not the ultimate number, which has been suggested by other series (You et al. 2013). When examining all patients with primary CNS tumors, no difference was seen on multivariate analysis between patients treated with chemoradiation or radiation alone (Tsui et al. 2015).
It is possible, therefore, that chemotherapy influences the development of SNs by potentiating the influence of radiotherapy. Garwicz and colleagues performed a nested case-control study of children treated for cancer in five Nordic countries (Garwicz et al. 2000). While the risk of a SMN was not increased by chemotherapy alone, the interaction of chemotherapy with radiation therapy was found to be statistically significant at all radiation dose levels. While this was demonstrated in a population that comprise all childhood cancer diagnoses (with 20% primary CNS), we do not yet have enough data to fully extrapolate this finding to children with primary CNS cancer given that there have been conflicting findings reported in the literature. For example, Broniscer and colleagues reported on the St. Jude Children’s Research Hospital Experience and did not find an increased risk of second malignancies among patient with primary CNS cancer who received chemotherapy or a combination of chemotherapy and radiotherapy (Broniscer et al. 2004).
35.3.4 Other Risk Factors
Other factors could contribute to the development of second cancers. Inskip and Curtus demonstrated that children with PNET tumors had higher rates of SMNs compared to other CNS histologies using the US SEER database (Inskip and Curtis 2007). Children diagnosed with a primary astrocytoma had a SIR of 13 (95% CI 5.4–25) for development of a SN compared to a SIR of 45 (95% CI 19–88) for PNET (Inskip and Curtis 2007). Confirming earlier reports (Chojnacka et al. 2014; Duffner et al. 1998; Broniscer et al. 2004), Tsui and colleagues demonstrated that younger children, especially those younger than 5 years of age were at a higher risk for SNs, but no differences were seen for sex or race (Tsui et al. 2015). This finding in children less than 5 years of age agrees with the dose response established for secondary gliomas by Negila discussed previously (Neglia et al. 2006). In a cohort of patient who received cranial radiation for CNS tumors, Vichon and colleagues demonstrated a higher cumulative incidence in boys when compared to girls (Vinchon et al. 2011). Care must be taken in interpreting this finding given the heterogeneous study populations and often-conflicting results.
35.4 Second Neoplasms Following Childhood Central Nervous System Tumors
35.4.1 Incidence of Second Neoplasms in Survivors of Childhood Central Nervous System Tumors
It has been known for some time that children treated for primary CNS malignancies are at risk for SNs (Mann et al. 1953). While many of the first reported cases were from single institutions with limited ability to determine true incidence after treatment (Kantar et al. 2004; Makidono et al. 2009; Soffer et al. 1989; Strojan et al. 2000; Amirjamshidi and Abbassioun 2000), investigators are now using large multi-institutional and multinational series to examine the question (Cardous-Ubbink et al. 2007; Friedman et al. 2010; Inskip and Curtis 2007; Jazbec et al. 2004; Jenkinson et al. 2004; MacArthur et al. 2007; Olsen et al. 2009; Reulen et al. 2011; Meadows et al. 1985; Rosso et al. 1994). These larger series allow for identifications of more subtle risk factors.
Table 35.3 shows results from selected recent publications examining the rates of second malignancies in population studies of children diagnosed with a primary CNS cancer (Jenkinson et al. 2004; Cardous-Ubbink et al. 2007; Inskip and Curtis 2007; MacArthur et al. 2007; Olsen et al. 2009; Reulen et al. 2011; Armstrong et al. 2009; Hammal et al. 2005). Standard incidence rates of any SN following treatment for a childhood CNS tumor have been reported as 1.6–17.4 compared to the general population. In addition to differences in practice patterns and treatment, these rates vary widely based on length of follow-up, inclusion of benign tumors, and surveillance methods used.
Table 35.3
Selected large population studies examining the rates of secondary neoplasms in survivors of a primary childhood CNS tumor
Study | Year published | Years enrolled | Number of patients with primary CNS tumors | % of patients who received cranial RT | Observed # of SN | Standardized incidence ratio | Excess absolute riska |
|---|---|---|---|---|---|---|---|
British Childhood Cancer Survivor Study (UK) | 2011 | 1940–1991 | 4111 | NR | 338 | 2.7 (2.4–3.2) | 12.2 |
Childhood Cancer Survivors Study | 2009 | 1970–1986 | 1877 | 77 | 151 | 4.1 (3.2–5.2) | NR |
Nordicb | 2009 | 1943–2005 | 10,970 | NR | 78 | 1.6 (1.3–2.0) | NR |
US SEER | 2007 | 1973–2002 | 4806 | 55.5 | 69 | 6.3 (4.9–8.0) | 15.3 |
British Columbia | 2007 | 1970–1995 | 438 | NR | 9 | 5.1 (2.7–9.6) | 16.9 |
Dutch | 2007 | 1966–1996 | 109 | NR | 9 | 17.4 (6.98–35.8) | 53.6 |
Northern Region Young Persons Malignant Disease Registry (UK) | 2005 | 1968–1999 | 745 | NR | 14 | 6.1 (3.3–10.2) | NR |
National Register of Childhood Tumors (UK) | 2004 | 1962–1968 | 4009 | NR | 55 | 4.7 (3.66–6.2) | 10 |
France and UK | 1999 | Before 1985 | 722 | 84 | 15 | 5 (3–9)c | 14 |
The majority of data for survivors of primary CNS cancer comes from subgroups of large cohort population studies of all childhood cancers. Relatively few published reports have focused only on children diagnosed with a primary CNS tumor outside of single institution or cooperative group-based studies (Peterson et al. 2006; Maule et al. 2008; Armstrong et al. 2009). One such large group is the CCSS. This cohort was constructed to evaluate health outcomes in 5-year survivors of various childhood cancers including primary CNS tumors. Patients were treated at one of several institutions in the United States or Canada and were treated between 1970 and 1986. Over 14,000 participants were enrolled (Friedman et al. 2010).
Armstrong and colleagues examined a 1877 patient cohort of children with primary CNS cancer included in the larger CCSS cohort (Armstrong et al. 2009). Astrocytoma and glial tumors were the most common primary cancer histologies. Most patients were treated with surgery followed by radiotherapy alone (41.6%) or chemotherapy and radiotherapy (27.0%), although some patients underwent surgery alone (26.0%). For patients receiving radiation therapy, 51.8% received a dose of 50 Gy or more and 36.8% received spinal radiation therapy. The authors determined that the cumulative incidence of all SNs was 10.7% (95% CI 8.8–12.6%) at 25 years from diagnosis (Armstrong et al. 2009). When non-melanoma skin cancer and meningiomas were excluded, the cumulative incidence was 4.5% (3.3–5.7%). Rates of specific SN are shown in Table 35.4. In comparison to other CCSS participants, those with primary CNS cancers had a higher rate of secondary CNS tumors and a lower rate of breast cancer. Since radiotherapy has been shown to increase the risk of secondary CNS tumors in survivors of any childhood cancer (Neglia et al. 2006), this is likely a result of higher rates of CNS directed radiotherapy in children with CNS primary compared to those diagnosed with cancers involving other sites.
Table 35.4
Selected single institution and multi-institutional studies examining the rates of secondary neoplasms in survivors of a primary childhood CNS tumor
Institution | Year published | Years enrolled | Primary cancer | Number of patients | % of patients who received cranial RT | Cumulative incidence | Latency time | Risk factors |
|---|---|---|---|---|---|---|---|---|
St. Jude | 2015 | 1985–2012 | Any CNS | 2779 | 75.6 | 3.0% (4.6–7.7) at 10 years | 7.7 years | XRT |
COG A9961 | 2013 | 1996–2000 | Medulloblastoma | 421 | 100 | 4.2% (1.9–6.5%) at 10 years | 5.8 years | NR |
Lillie FR | 2011 | 1970–2010 | Any CNS | 552 | 100 | 8.9% at 10 years | 13.1 years | Males, XRT dose, |
HIT ‘91
Related posts:Stay updated, free articles. Join our Telegram channel
Full access? Get Clinical Tree
 Get Clinical Tree app for offline access

|