Fig. 12.1
Myxofibrosarcoma, G2. Intermediate grade myxofibrosarcoma showing mildly atypical, hyperchromatic tumor cells in a myxoid stroma and a characteristic vascular pattern with curvilinear, thin-walled blood vessels
12.3.2 Imaging of STS
Soft tissue sarcomas presenting as a mass of a certain size can be visualized on CT, which is particularly helpful to detect calcifications and secondary changes of adjacent bony elements. However, the preferred diagnostic tool is magnetic resonance imaging (MRI) which allows depiction of several tissue components on the basis of intrinsic signal characteristics. For example, high signal intensity on T1- and T2-weighted images and signal loss on fat-suppressed images indicate fatty tissue; intermediate signal intensity on T1-weighted and high signal intensity on T2-weighted images is seen with cystic, necrotic, or myxoid tumor components, whereas low signal intensity on images with T2 contrast is compatible with the presence of calcifications, collagen, or hemosiderin deposits. In most cases, the application of contrast medium is indicated in order to further characterize the tumor with respect to its vascularization, homogeneity, and extent of necrosis. Furthermore, the margins of the lesion can be visualized, ranging from well demarcated to infiltrative. Benign lesions may be encapsulated, but even high-grade sarcomas might be surrounded by a relatively well-defined zone of compressed normal tissue, which is referred to as the pseudocapsule. On the other hand, locally aggressive lesions such as desmoid-type fibromatosis may exhibit diffusely infiltrating margins. Thus, the growth pattern, as displayed by MRI, does not necessarily correlate with the malignancy of a soft tissue tumor, but is crucial for the radiation oncologist with regard to target volume delineation. MRI visualizes tumor localization (subcutaneous, intramuscular, intermuscular, etc.), fascial involvement, transcompartmental spread, as well as infiltration of adjacent tissues such as bone. There may be clear evidence of involvement of major vessels or nerves if they are entirely encased by the tumor or noninvolvement if these structures are clearly separated from the tumor by a layer of normal tissue. If the tumor abuts major vessels or nerves, the infiltration probability can be estimated from the degree of circumferential contact.
Peritumoral edema represents a common MR finding in soft tissue sarcomas, which is visualized as an ill-defined area of high signal intensity on fat-suppressed, T2-weighted, and STIR images as well as on contrast-enhanced T1-weighted images with fat suppression. In STS of the extremities, peritumoral edema can be quite extensive longitudinally and might even exceed the length of the solid tumor. It should be regarded as potentially contaminated by tumor cells, although compression of venous and/or lymphatic vessels may contribute to formation of edema distal to the mass as well.
The value of positron emission tomography with glucose-labelled tracers (e.g., FDG-PET-CT) is limited for the delineation of the primary tumor. A threshold-based approach in 17 patients produced large standard deviations between the gross tumor volume (GTV) based on PET-CT in comparison with contrast-enhanced MRI for all SUV (standardized uptake value) thresholds (Karam et al. 2009). Nevertheless, FDG-PET-CT could be of help in defining the clinically relevant portion of peritumoral edema in sarcomas producing a substantial FDG uptake in the primary tumor. In a study of 7 superficial sarcomas (6 “MFHs”), SUVs were correlated with histopathological findings at regular intervals of 1 cm up to 5 cm away from the primary tumor defined by contrast-enhanced MRI. Mean SUVmax was 2.2 (range 0.3–3.8) at 1 cm, 1.1 (0.85–1.47) at 2 cm, and 0.83 (0.65–1.15) at 3 cm from the tumor margin. Mapping of the resected tissue revealed absence of tumor cells in areas where SUVmax was below 1.0 (Yokouchi et al. 2011).
12.3.3 Target Volume Delineation in STS
Generally, visualization of the tumor with MRI is the basis for target volume definition in STS. Thus, the use of a contouring software that allows for import of MRI sequences and registration with the planning CT is strongly recommended. For visualization of the primary tumor, a contrast-enhanced T1-weighted sequence with fat suppression is appropriate, supplemented by a T2-weighted sequence for fatty components, if indicated. For visualization of the peritumoral edema, fat-suppressed T2-weighted images are most suitable, covering the whole extent of soft tissue edema longitudinally.
12.3.3.1 Target Volume Delineation in Extremity Soft Tissue Sarcoma (ESTS)
ESTS, Target Volume Delineation for Preoperative Radiotherapy
Ideally, diagnostic MRI is performed in the same position as radiation treatment, allowing for exact registration with the planning CT and delineation of the primary tumor and perifocal edema. The GTV encompasses the visible primary tumor. The inclusion of edema is a matter of controversy. There is a consensus that it should in any case be included into the CTV which generally covers the whole volume of potential microscopic tumor involvement, but one could argue that visible changes in the MRI signals reflect a macroscopic tumor involvement and the edema should be regarded as GTV.
Historically, in extremity soft tissue sarcoma (ESTS), radiation treatment fields were chosen that encompassed the visible tumor with a 2 cm margin in anterior-posterior and lateral directions and a 5 cm or wider margin longitudinally up to a dose of approximately 50 Gy (Mundt et al. 1995; Wylie et al. 1999). This had to be translated into the ICRU concept with definitions of CTV and PTV margins (ICRU reports 50, 83).
According to a meeting of radiation oncologists involved in STS Radiation Therapy Oncology Group (RTOG) studies, their view of CTV definition for preoperative radiotherapy of intermediate-to-high-grade sarcoma (tumor size ≥5 cm) followed the RTOG 0630 protocol, expanding the GTV with a radial margin of 1.5 cm and a longitudinal margin of 3 cm, shortened at the end of a compartment. Inclusion of suspicious edema defined on MRI T2 images beyond the margins mentioned above was left to the clinical judgement of the radiation oncologist. It could be excluded from the CTV in case the risk of tumor cell occurrence seemed to be low or the irradiation caused excessive toxicity (Wang et al. 2011).
In a later consensus meeting of experts in radiation oncology from Canadian, American, and European sarcoma centers, for high-grade tumors, a CTV definition was advocated expanding the GTV in all radial directions by 1.5 cm and longitudinally by 4 cm (Haas et al. 2012). The edema was not included in the GTV but in the CTV, expanding the CTV beyond the geometrical margins wherever edema was visible. Uninvolved fascia and bones were regarded as being effective barriers to tumor spread. Thus, restricting the CTV to their surfaces and to the skin was found to be sufficient (Hong et al. 2004). The longitudinal margin of 4 cm was supported by a histopathological study in 15 patients, which reported changes in T2-weighted MRI signal in a distance up to 0–7 cm, contrast enhancement in 0–5 cm, and tumor cells up to 4 cm away from the main tumor mass, as was confirmed in the corresponding surgical specimens (White et al. 2005). For definition of the PTV, an institutional margin for positioning uncertainty should be applied around the CTV, which may be 1 cm or more for variable sites like the thigh or reduced to 0.5 cm in case of reproducible mask fixation of the target and/or daily image guidance with visualization of the soft tissue (Haas et al. 2012; Dickie et al. 2010).
After analysis of 60 recurrences (7.8 %) in a cohort of 768 STS patients treated with pre- or postoperative radiotherapy between 1990 and 2006, PTV encompassing the GTV with longitudinal margins of 5 cm and 1–2 cm axially appeared sufficient, as 49 relapses were in-field, 2 were marginal, and only 9 were out-of-field (1.1 % overall) (Dickie et al. 2012).
Bearing in mind the success rates of adjuvant brachytherapy in ESTS with margins of not more than 1.5–3 cm and the more precise imaging and dose application techniques available today, the margin width for CTV and PTV definitions is under discussion. At the MGH, Boston, good results in preoperative radiotherapy of ESTS were achieved with a margin of 1–1.5 cm radially and 3.5 cm longitudinally to the GTV for the definition of the CTV and another 0.5–0.7 cm expansion for the PTV. After a median follow-up of 41 months, 5 local recurrences occurred in 56 patients (5-year actuarial local control rate of 88.5 %), of which three were located in the CTV and two within and beyond the CTV (Kim et al. 2010).
To reduce margins between CTV and PTV, immobilization aids have been proven to be effective (Dickie et al. 2009). If daily image guidance with cone beam or MV-CT is performed, a 0.5 cm CTV expansion for the PTV is permitted (O’Sullivan et al. 2013).
In preoperative radiotherapy of extremity STS, wound complication is an issue of note. The OAR is the skin and subcutaneous tissue around the tumor that receives a relevant radiation dose and is involved in the wound healing process after tumor resection. In a phase III randomized trial on extremity STS, the arm with preoperative radiotherapy to a total dose of 50 Gy followed by surgery was associated with a 35 % wound complication rate, whereas in the other arm with surgery upfront followed by postoperative radiotherapy to a total dose of 66 Gy, a 17 % wound complication rate was observed (O’Sullivan et al. 2002).
In a phase II study on preoperative IMRT (50 Gy) and IGRT for lower extremity STS, the CTV was defined as the GTV plus a radial margin of 1.5 cm and a longitudinal margin of 4 cm. The PTV encompassed the CTV plus a 0.5 cm margin in all directions. A high radiation dose to planned excision sites and tissue qualifying for surgical skin flaps was carefully avoided. A 30.5 % incidence of wound complications was found in 59 evaluable patients. This was numerically lower than the risk of 43 % for lower limb STS derived from the preoperative arm of the randomized trial cited above, but did not reach statistical significance (O’Sullivan et al. 2013). Image-guided IMRT reduced the need for tissue transfer and was associated with low chronic morbidity.
Another phase II study of preoperative image-guided IMRT to a total dose of 50 Gy for ESTS stages II–III, aiming for a reduction of wound complication rate (primary endpoint), was initiated in 2011 at the Technical University of Munich (PREMISS: Preoperative Radiotherapy for Sarcomas of the Extremities with Intensity-Modulation, Image-guidance and Small Safety margins, NCT01552239), (National Cancer Institute 2013). In the PREMISS protocol, the GTV encompasses the tumor and the peritumoral edema, with a 1 cm expansion in axial and a 2.5 cm expansion in longitudinal directions for the CTV and another 0.5 cm margin for the PTV. An example is given in Fig. 12.2.
Fig. 12.2
Myxoid liposarcoma (cT2b cN0 cM0 G2) of the right lateral gastrocnemius muscle in a 41-year-old man. (a) Axial contrast-enhanced T1-weighted image with fat suppression, tumor size 10.5 cm × 7.2 cm. (b) Coronal STIR image, solid lesion of 14.3 cm in length, marked distal soft tissue edema following a fascial plane (arrow). (c–d) Target volume definition for preoperative radiotherapy to a total dose of 50 Gy, visualized on a coronal STIR image and a coronal reconstruction of the planning CT: solid primary tumor, yellow; GTV, orange (including edema); CTV, pink (GTV plus 1 cm margin in axial and 2.5 cm margin in longitudinal directions in soft tissue); and PTV, red (CTV plus 0.5 cm margin, including GTV plus 1 cm margin, regardless of bone or air). (e) Four weeks after radiotherapy, axial contrast-enhanced T1-weighted image with fat suppression: tumor size 8 cm × 5.3 cm, decreased contrast enhancement of tumor tissue, increased proportions of myxoid changes, and necrosis. (f) Coronal STIR image 4 weeks after RT, solid tumor 12.6 cm in length (“no change” according to RECIST version 1.1), regression of soft tissue edema. After limb-preserving tumor resection, all resection margins were found free of tumor (R0 resection), and the percentage of vital tumor cells quantified to be approximately 5 %
In order to quantify the sparing of organs at risk, namely, the bone and the soft tissue outside the PTV (BoneexPTV, SoftTissueexPTV), these structures are contoured from each 3 cm proximal to the first and distal to the last CT slice containing the PTV. Intensity-modulated treatment planning aims for keeping the percentage of “BoneexPTV” encompassed by the 40 Gy isodose (V40Gy) below 50 %. Likewise, the V30Gy of the “SoftTissueexPTV” is kept below 50 %.
ESTS, Target Volume Delineation for Postoperative Radiotherapy
In soft tissue sarcoma of the extremity with no prior radiation treatment, postoperative radiotherapy is usually indicated with the exception of low-grade tumors after R0 resection and atypical lipomatous tumors (ALT) after marginal resection. Generally, the dose administered to the tumor site (PTVboost) may vary between 60 and 70 Gy, according to histological subtype, grade, and resection margin. For a larger volume including all surgically manipulated tissue (PTVlarge), the prescribed dose is often between 45 and 56 Gy. Careful review of surgical and pathological reports as well as postoperative MRI will help to identify areas in need of irradiation and facilitate the choice of boost dose.
With IMRT, simultaneous integrated boost techniques became available, leading to concepts of slightly enhanced single doses (≤2.2 Gy) for the PTVboost and/or slightly reduced single doses (≥1.7 Gy) for the PTVlarge compared to conventional fractionation. An example is given in Fig. 12.3.
Fig. 12.3
Epitheloid myxofibrosarcoma of the right knee in a 73-year-old woman. (a) Axial contrast-enhanced T1-weighted and (b) sagittal T2-weighted images with fat suppression showing pretibial tumor with extensions to the medial femoral condyle and to the tibial tuberosity. (c–d) Postoperative situation (pT2b cN0 cM0 G2, ≥R1) after tumor resection in another facility, displayed on axial and sagittal T1-weighted fat-suppressed images: contrast enhancement of the resection cavity, residual tumor cannot be excluded, in particular medial to the patella and at the tibial tuberosity. The patient refused amputation, radical local tumor resection would result in a loss of function in the knee joint, therefore postoperative/definitive radiotherapy was offered. (e) Axial and (f) sagittal planning CT reconstruction, target volume definition for simultaneous integrated boost technique: tumor contact and resection cavity (GTVcontact/postop), yellow; PTVSIB2, light orange (GTV plus 0.5 cm axial margin and 1.5 cm proximodistal margin, with 0.2 cm skin sparing) to a total dose of 70.4 Gy in 32 fractions of 2.2 Gy; PTVSIB1, orange (postoperative edemal changes plus 1 cm axial margin and 2 cm longitudinal margin) to a total dose of 64 Gy in fractions of 2.0 Gy; CTVlarge, not shown (postoperative edemal changes plus 1.5 cm axial margin and 4.5 cm longitudinal margin, in soft tissue); and PTVlarge, red (CTVlarge plus 0.5 cm margin) to a total dose of 57.6 Gy in fractions of 1.8 Gy. (g) Axial and (h) sagittal view of the dose distribution (tomotherapy planning)
At the time of planning CT, all surgical scars and drainage sites should be marked with radiopaque linings. As there is no “GTV” after macroscopical complete tumor resection, any attempt should be made to coregistrate the planning CT with pre- and postoperative MRI in order to reconstruct the GTV contact planes (GTVcontact) in the postoperative anatomy. The comparison of preoperative and postoperative MRI helps to differentiate between perifocal edema arising from the tumor and postoperative edematous changes. The resection site might exhibit slight contrast enhancement, and scarring might be visible through soft tissue deformation.
The clinical target volume for the boost dose (i.e., CTVboost) encompasses the GTVcontact plus a margin of 1.5 cm, the initially suspicious perifocal edema, and the resection cavity with a 0.5–1.5 cm margin. According to institutional protocols and reproducibility of patient positioning, the PTVboost expands the CTVboost with a margin of 0.5–1 cm.
The clinical target volume for the lower dose (CTVlarge) encompasses the GTVcontact with a more generous margin of 4 cm in longitudinal and 1.5 cm in radial directions, restricted to anatomic borders respected by the tumor, and all surgically manipulated tissue including scars and drainage sites with a 0.5–1 cm margin. Again, another 0.5–1 cm margin is applied to generate the PTVlarge.
12.3.3.2 Target Volume Delineation in Retroperitoneal Soft Tissue Sarcoma (RPS)
In retroperitoneal soft tissue sarcomas (RPS) institutional series with intraoperative radiotherapy, proton or carbon ion therapy have produced promising results (Sindelar et al. 1993; Petersen et al. 2002; Pawlik et al. 2006; Serizawa et al. 2009; Yoon et al. 2010; Pezner et al. 2011), though the data from epidemiological studies is conflicting (Sampath et al. 2010; Tseng et al. 2011). The current concept of preoperative radiotherapy is especially helpful in retroperitoneal STS, as the tumor displaces the surrounding bowel, the normal tissues with tumor contact are in place for target volume definition, and the limited total dose of 50 Gy is feasible in the abdomen (Pawlik et al. 2006). In 2012, a multicenter phase III randomized controlled trial has been initiated to elucidate the effect of preoperative radiotherapy (50.4 Gy) on abdominal recurrence-free survival (STRASS: Surgery With or Without Radiation Therapy in Treating Patients With Previously Untreated Nonmetastatic Retroperitoneal Soft Tissue Sarcoma, EORTC-protocol 22092, NCT01344018) (EORTC 2013). A consensus meeting on target volume definition for RPS outside study protocols is in preparation.
Generally, in the retroperitoneal space, liposarcoma is the predominant histology, followed by leiomyosarcoma, accounting for 50 and 26 % of RPS, respectively, according to a SEER database with 1,365 patients undergoing resection of RPS in the years 1988–2005 (Nathan et al. 2009). Whereas for atypical lipomatous tumors of the limbs (ALT), even in case of microscopic incomplete resection, the indication for postoperative radiation therapy is rarely given, and the estimated risk of dedifferentiation is below 2 %; for retroperitoneal ALT, it might exceed 20 %. In ALT of the retroperitoneum, spermatic cord or mediastinum tumor-free resection margins are rarely achieved and may ultimately lead to death in the following 10–20 years in >80 % of patients due to repeated, locally uncontrolled recurrences or dedifferentiation with development of metastases. For dedifferentiated liposarcoma at first presentation, a local recurrence rate of 40 % after 5 years is reported for all sites, but for a retroperitoneal site, nearly all tumors eventually recur if patients are followed up for 10 years or longer. Factors relevant for survival in RPS are the histological subtype, the histological grade, and the tumor invasion of adjacent structures, whereas tumor size has no impact on overall survival (Nathan et al. 2009).
For target volume delineation in retroperitoneal sarcoma, a contrast-enhanced computed tomography is needed which can be complemented with registration of MRI. 4D-CT helps to quantify the organ movement due to breathing. The extent of dedifferentiation may vary grossly within a tumor. In case of low-grade liposarcoma, it may be extremely difficult to determine the GTV as there is often no “capsule” between ALT and normal fatty tissue, and tissue densities/signal intensities may not differ. The displacement of bowel is indicative of the presence of a tumor mass as well as a “blurred” aspect of the fatty tissue, which may result from streaks of collagen or an inflammatory component of the tumor.
Perifocal edema is less common in RPS in comparison with ESTS and, if present, should at least be included in the CTV. Institutional protocols for the GTV-to-CTV margin may vary in the order of 0.5–2 cm, according to the adjacent tissue. We suggest a general margin of 1.5 cm in all directions around the primary tumor plus perifocal edema. In the direction of anatomic barriers, e.g., uninvolved liver, we reduce the margin to the extent of breathing movement as visible in a 4D-CT. There should be clear communication with the surgeon if the ipsilateral kidney is to be removed later, in which case a compromise in the target volume delineation for ipsilateral kidney sparing is not indicated, and sparing of the contralateral kidney is mandatory. With image-guided IMRT, we apply a margin of 0.5 cm around the CTV to derive the PTV. The dose (i.e., 50.4 Gy) is prescribed to the median, aiming for a target dose coverage of 95 % of the nominal dose in at least 95 % of the target volume (D95% ≥ 47.8 Gy). The intersection of the PTV and small or large bowel is derived from the contoured structures and subjected to a dose of 47.8–50.4 Gy in the optimization process, with steep dose gradients in the bowel outside the PTV. In the spinal cord, we allow for a dose maximum of 50.4 Gy. For other organs like the stomach, duodenum, liver, pancreas, spleen, and lungs, the planning optimization is generally aiming for organ sparing outside the PTV, but without limitation of the dose maximum in the intersection zone between the PTV and organs at risk. An example is given in Fig. 12.4.
Fig. 12.4
Fourth recurrence of a retroperitoneal liposarcoma (rcT2b N0 M0 ≥ G1) within 8 years in a 74-year-old man having undergone several tumor resections, including right nephrectomy and adrenalectomy, cholecystectomy, right hemicolectomy, and partial resections of involved diaphragm, small bowel, and sigma. (a) Axial contrast-enhanced T1-weighted image with fat suppression, showing a bimorphic tumor: a non-lipomatous component in the midline closely related to duodenum and pancreas, displaying high signal intensity due to contrast enhancement (bright yellow structure) and a lipomatous (well-differentiated) component (light yellow structure) with low signal intensity due to suppression of fat signal, extending from the right liver lobe to the iliac crest. (b) Axial T2-weighted image: hypointense signal intensity of the non-lipomatous portion and isointensity to fat of the well-differentiated portion. (c) Target volume definition for preoperative radiotherapy to a total dose of 50 Gy in 25 fractions of 2 Gy: GTVs, yellow and PTV, red, including the non-lipomatous portion of the recurrence plus 1.5 cm margins and the well-differentiated portion with 1.0 cm margins for CTV (not shown), plus a 0.5 cm margin for positioning uncertainty. In the direction of the sole kidney, the margins were locally restricted to a sum of 1.5 cm. Vena cava inferior – blue (for alignment purposes of MRI and CT). The hypodense subcapsular liver lesion is a residual known to be caused by trauma. (d) Axial and (e) coronal view of the dose distribution, optimized for dose sparing of the kidney (tomotherapy planning). (f) Dose volume histograms (from right to left): GTV, yellow; PTV, red; bowel, green; bowel outside PTV (subvolume of bowel), darker green; liver, beige; and sole kidney, light green. Six weeks later, a macroscopic complete resection of the non-lipomatous portion of the recurrence including partial duodenectomy and bowel resections was achieved as well as a debulking of the well-differentiated tumor recurrence. The most recent follow-up 1.5 years after combined treatment showed a stable situation with remnants of well-differentiated tumor
In a pilot study of 18 patients with retroperitoneal liposarcoma, the CTV was restricted to the posterior abdominal wall from where the tumor derived. After a total dose of 50 Gy in fractions of 2 Gy, acute toxicity was tolerable and all tumors could be resected. With a median follow-up of 27 months, 2 local recurrences developed (Bossi et al. 2007). In another pilot study on 16 patients with RPS, a total dose of 45 Gy in 25 fractions was applied to the entire tumor plus 1–1.5 cm margins and a simultaneous dose escalation to a total dose of 57.5 Gy (in fractions of 2.3 Gy) to the volume predicted as being at high risk for a tumor-positive surgical margin (contoured in consultation with the operating surgeon). Acute morbidity was manageable, and 14 patients underwent macroscopic complete tumor resection. Two recurrences were seen after a median follow-up of 28 months (Tzeng et al. 2006). A retrospective analysis of the recurrence pattern in 33 patients treated with preoperative RT for RPS (GTV plus 1–1.5 cm margin for CTV and another 0.5 cm for PTV) and 32.9 months of median follow-up identified only 4 patients with a local recurrence within the treatment field that theoretically might have been prevented with local dose escalation. Another 12 patients developed a failure outside the PTV or at regional, distant, or a combination of sites. The authors concluded that the approach of dose escalation might be limited, and strategies for appropriate patient selection were needed (McBride et al. 2013). However, 10 of 33 patients in this series additionally had a postoperative I-125 brachytherapy implant at the tumor resection site with a median dose of 77.5 Gy. Thus, it remains unclear how many further local recurrences might have already been prevented by this boost technique.
12.3.3.3 Target Volume Delineation in STS of Other Sites
Soft tissue sarcoma can occur at any site of the body and at all ages. In adults, the limbs (see Sect. 12.3.3.1) and the retroperitoneal space (see Sect. 12.3.3.2) are the most frequent sites of STS, but up to 10 % of tumors may arise each in the head and neck region and the trunk/pelvis. Target volume definition follows the same principles as described for extremity STS. Nevertheless, the growth directions of the tumors might be more complex and have to be considered individually. The margins for definition of the CTV may be shortened in a way just to encompass the surface of uninvolved anatomic barriers like bones or to exclude critical radiosensitive structures. If a combination of surgery and radiotherapy is indicated in STS of the head and neck, the advantages of preoperative radiation therapy (lower doses, smaller treatment volumes, etc.) are particularly valuable. In case of radical tumor resection probably resulting in large defects requiring plastic surgery, again preoperative radiotherapy may be preferred in order to omit irradiation of the transferred flap tissue.
If a radical tumor resection is not feasible because of the tumor site or extent (e.g., large STS of the tongue, extensive angiosarcoma of the face/scalp, etc.), definitive radiation therapy is considered. An example is given in Fig. 12.5. Total doses of 70 Gy or more may be applied, e.g., with shrinking fields, a simultaneous integrated boost technique, or with brachytherapy. For CTV definition of the boost, margins of 2 cm around the GTV are often not feasible and thus substantially reduced, depending on histology, site, organs at risk, and irradiation technique.
Fig. 12.5
Rapidly growing right midfacial angiosarcoma (cT2b cN1 cMx G3) in a 90-year-old woman. (a) Coronal and (b) axial STIR image displaying an infraorbital tumor affecting the right lower eyelid and anterior buccal tissue (submandibular lymph node metastasis not shown). (c) Axial contrast-enhanced T1-weighted image showing premaxillary tumor tissue with hypointense signal. (d) Target volume delineation for definitive (palliative) radiotherapy, visualized on a coronal STIR image and (e) in the coronal planning CT reconstruction: GTV, yellow (including high-risk buccal tissue); PTVSIB, orange (GTV of primary tumor (and affected lymph node, not shown) plus 1 cm margin, shortened in the direction of the eye bulb); and PTVlarge, red (GTV plus 3 cm margin, shortened in the direction of the oral cavity (and submandibular nodal region, not shown)). (f) Coronal view of the dose distribution (tomotherapy planning). In fact, 25 of 30 planned fractions of 2.0 Gy to the PTVSIB and of 1.8 Gy to the PTVlarge of this plan were actually delivered. For the remaining 5 fractions, both target volumes were cranially restricted to just include the lower eyelid in order to spare orbital structures. (g) Coronal and (h) axial STIR images and (i) axial contrast-enhanced T1-weighted image, 6 weeks after radiotherapy, showing nearly complete remission of tumor
12.3.3.4 Target Volume Delineation in Pediatric STS
In children, STS represents the fifth most common tumor group with an incidence of 1/100,000 per year. The most frequent STS histology is rhabdomyosarcoma (RMS), accounting for approximately half of all STS in children. All pediatric sarcoma patients should be treated within prospective interdisciplinary protocols (like the Intergroup Rhabdomyosarcoma Studies (IRS), studies from the Children’s Oncology Group in North America, SIOP-MMT studies in Europe, Italian Cooperative Group RMS studies, German Cooperative CWS protocols, etc.) that also guide target volume definitions. In comparison with recommendations for radiotherapy of STS in adults, a reduction of margins and doses seems to be feasible in children (Curtis et al. 2009; Krasin et al. 2010; Wolden et al. 2005; Eaton et al. 2013). Techniques to reduce the integral dose to the body like brachytherapy and particle therapy are of particular value in this age group (Blank et al. 2010; Combs et al. 2012; Cotter et al. 2011; Childs et al. 2012; Laskar et al. 2007; Lee et al. 2005; Timmermann et al. 2007; Viani et al. 2008).
In the Children’s Oncology Group D9602 study for low-risk RMS, a cumulative incidence of local/regional failure not higher than 15 % after 5 years was reported. The study included 342 eligible patients, of which 172 received radiotherapy to stage-adapted total doses of 36 Gy, 41.4 Gy, or 50.4 Gy as part of their multimodal treatment. The gross tumor was defined as the pretherapeutic extent of tumor, excluding the intra-abdominal or intrathoracic portion that had initially displaced organs but then had vanished under chemotherapy or debulking surgery, letting the organs return to their normal anatomic position. The CTVlarge was defined as the GTV plus 1.5 cm and included the entire lymph node chain in case of lymph node involvement. The CTVboost beyond a dose of 36 Gy to the primary site was defined as the GTV plus 0.5 cm. Generally, the PTV was defined as the CTV plus an institution-specific margin, which was 0.5 cm in most patients (Breneman et al. 2012).
In the COG 9803 study, for intermediate-risk RMS, again a combined margin of 2 cm around the GTV was used to derive the PTV. The cumulative 5-year failure rate of locoregional control was similar for patients receiving 3D-conformal radiotherapy (3D-CRT) or IMRT with 18 and 15 %, respectively. IMRT improved the target dose coverage compared with 3D-CRT, which according to the authors might become a relevant issue when lowering radiation doses or margins in future studies (Lin et al. 2012). An example of an extensive, irregularly shaped primary tumor not feasible for 3D-CRT but for IMRT is given in Fig. 12.6.
Fig. 12.6
Stage IV alveolar rhabdomyosarcoma cT2b cN1 cM1 (LYM, PLE, OSS) G3 in a 16-year-old boy. The main tumor mass is located in the posterior mediastinum and midline upper abdomen (axial width 11 cm) with infiltration of the diaphragm, the neuroforamen Th11/12, several lymph node metastases at the mediastinum, the paraaortal and truncal region, and the internal mammarian chain, diffuse pleural involvement on the left side with numerous nodular tumor deposits and pleural effusion, peritoneal tumor nodules contacting the spleen, and left iliac bone metastasis. (a) Pretherapeutic FDG-PET, coronal view, showing elevated glucose uptake of primary tumor and metastatic sites. (b) Target volume delineation for definitive radiotherapy of all tumor sites after good response to four cycles of chemotherapy according to CWS-guidance protocol (complete remission), coronal planning CT reconstruction: GTV1, yellow (thoracoabdominal tissue contacting the initial tumor/metastases or residual lesions); GTV2, yellow (extent of initial tumor in the left iliac bone); PTV1SIB50Gy, orange (GTV1 plus 0.5 cm margin); PTV2SIB50Gy, pink (GTV in left iliac bone plus 0.5 cm margin) to a total dose of 50 Gy in 25 fractions of 2.0 Gy; PTV2large 41.4Gy, purple (GTV2 in left iliac bone plus 1 cm margin) to a total dose of 41.25 Gy in fractions of 1.65 Gy; and PTV1large36Gy, red (GTV1 plus 0.5 cm margin without lung tissue for CTV1, plus another 0.5 cm margin for positioning uncertainty, including on the left side the whole parietal pleura, diaphragm, and peritoneal surfaces of high risk plus 1 cm margin, restricted to 0.5 cm into the left kidney) to a total dose of 36 Gy in fractions of 1.44 Gy). (c) Coronal view of the dose distribution (tomotherapy planning), including pleural irradiation on the left side. Irradiation time per fraction was 17.5 min. (d) Dose volume histograms for target volumes displayed in “overlap mode,” showing exclusively those parts of target volumes not included in others of higher planning priority (right to left): PTV2SIB50Gy, pink; PTV1SIB50Gy, orange; PTV2large 41.4Gy, purple; and PTV1large36Gy, red. (e) Dose volume histograms displayed in “standard mode” for PTV2SIB50Gy, pink, and PTV1SIB50Gy, orange, and the following OARs (right to left on the level of median dose): spinal cord, brown (maximal dose (Dmax) 50 Gy); left ventricle of heart, red (mean heart dose (Dmean) 26 Gy, volume receiving 40 Gy (V40Gy) 9 %); left lung, green (V20Gy 62 %, V30Gy 40 %, Dmean 26 Gy); liver, violet (V30Gy 22 %); left kidney, darker green (V18Gy 45 %); whole lung, pale blue (Dmean 15.6 Gy); right lung, blue (Dmean 6.3 Gy); and right kidney, dark blue (V18Gy 8 %). The radiation therapy was delivered simultaneously to the 5th and 6th cycle of chemotherapy (dosage of substances reduced to 67 %) in a split-course manner with a planned break of 2 weeks after the 13th fraction and transplantation of autologous stem cells after both cycles. After additional high-dose chemotherapy and allogeneic transplantation, the patient is disease free and in good performance status. Late effects of radiation therapy do not exceed grade I° according to RTOG/EORTC (last follow-up so far 2.4 years after diagnosis)
Special attention is given to STS of parameningeal location. In consecutive IRS protocols, target volume definition for parameningeal STS with high risk for meningeal extension changed considerably over time, with inclusion of whole-brain radiation therapy (WBRT) in 1978 (IRS-II), elimination of WBRT for a subgroup of patients in 1987 (IRS-III), and for all patients in 1991 (IRS-IV). The margin around the primary tumor at the skull base was changed from 2 cm in IRS-II to 5 cm in IRS-III and resumed to 2 cm in IRS-IV. In many circumstances, to spare critical surrounding structures, the 2 cm margin had to be smaller to minimize risks of toxicity. The cumulative 5-year failure rate for all 595 eligible parameningeal RMS patients (including 38 % RMS with intracranial extension) was 17 %. No significant differences in the incidence of local failure by protocol era from IRS-II to IRS-IV were detected. Thus, WBRT and larger margins could safely be omitted (Michalski et al. 2004).
In a small series of 17 parameningeal STS patients, including 9 tumors with intracranial extension, radiotherapy to a median prescribed dose of 50.4 Gy (relative biological effectiveness (RBE)) was delivered with protons. The CTV was individually drawn and a margin of 0.75–1 cm added to account for setup uncertainty and penumbra lateral to the beam direction. After a median follow-up of 5 years for survivors, the crude local failure rate was 18 % (3 of 17) and thus comparable to the studies cited above. Rates of late effects from proton radiotherapy compared favorably to reports from photon-treated cohorts (Childs et al. 2012).
In an institutional series of 55 RMS patients including 18 parameningeal tumors, treated between 2000 and 2010, a PTV cone-done boost was applied in 28 patients (51 %) with a median relative reduction in PTV volume of 56 %. The PTVlarge was based on the pretherapeutic gross tumor (GTVinitial) with a 0.5–1.5 cm margin to derive the CTV and an additional margin of 0.5–1.0 cm to account for setup uncertainty and target motion. For patients who received a cone-down boost after delivery of 36–41.4 Gy, a PTVboost was created based on residual gross tumor after induction chemotherapy (GTVpostCTx) with the margins applied accordingly. In total, 5 local failures were observed, all occurring within the high-dose target volumes. Thus, the receipt of a response-based boost in conjunction with delayed RT had no discernible impact on local control in most patients, but allowed for considerable sparing of normal tissue. However, in the subset of patients with parameningeal RMS and intracranial extension, a high rate of leptomeningeal recurrences was observed after application of a cone-down boost, which prompted the authors to advise for wider margin RT for this subgroup (Eaton et al. 2013).
12.3.3.5 Target Volume Delineation in Metastatic Sites of STS
There is some evidence that treating metastatic sites of RMS with curative doses of radiotherapy might be beneficial. In a group of 13 children, including 8 RMS patients and 5 with Ewing sarcoma, radiotherapy to total doses above 40 Gy in each metastatic site led to an actuarial local control rate of 92 % after 5 years. Overall survival was 35 % at 5 years (Liu et al. 2011).
In our practice, metastatic sites of RMS (and Ewing sarcoma) in children are treated with a simultaneous integrated boost (SIB) technique (see Fig. 12.6 and also Fig. 12.14 in Sect. 12.6). The PTVlarge is defined as the visible GTV including edema plus a 0.5 cm margin for the CTVlarge and another 0.5 cm margin for positioning inaccuracies. In vertebral metastasis, the whole affected vertebra is included in the CTVlarge; in a long bone, its full thickness at the affected level; and in lymph node metastasis, the affected nodal region. For the PTVlarge, a total dose of 45 Gy in fractions of 1.8 Gy is prescribed. A simultaneous integrated boost (SIB) to a total dose of 50 Gy in fractions of 2.0 Gy is applied to a PTVboost, encompassing the GTV plus a 0.5 cm margin.
Metastatic sites of soft tissue sarcoma in adults might be treated by radiosurgery or hypofractionated stereotactic radiotherapy, applying the established concepts of treatment for intracranial, pulmonal, hepatic, or osseous metastases. Review of 21 sarcoma patients treated with radiosurgery to a marginal dose of 16 Gy in 60 cerebral lesions resulted in a local control rate of 88 %. The median survival after diagnosis of intracranial metastasis was 16 months (Flannery et al. 2010). In a series of 52 patients with multimodality treatment of their lung metastases of STS, including 15 patients and 74 lesions treated with extracranial stereotactic radiotherapy between 1990 and 2006 (preferred concept of 50 Gy total dose in 5 fractions), actuarial local control at 5 years was 82 %. Median overall survival was 2.1 years for patients receiving stereotactic radiotherapy and 0.6 years for those who never received it (p = 0.002) (Dhakal et al. 2012). After stereotactic radiotherapy to spinal metastases in 58 patients with 65 lesions, isolated local failure of the unirradiated adjacent vertebral bodies occurred in 3 % (Klish et al. 2011). Thus, restricting the PTV to the affected vertebral level seems to be safe.
In bone metastases of STS amenable to stereotactic radiotherapy, we adopted the concept of 5 fractions of 6 Gy to the PTVlarge (definition as stated above for metastatic sites in children) with a simultaneous integrated boost (SIB) of 8 Gy per fraction to the GTV plus a 0.5 cm margin (PTVboost).
For larger STS metastasis of any site not suitable for stereotactic radiotherapy, a hypofractionated concept aiming at local control is offered with 22 fractions of 2.0 Gy to the PTVlarge and of 2.5 Gy to the PTVboost as defined above, with an optional SIB2 of 2.7 Gy to the GTV(= PTVboost2), resulting in nominal total doses of 44 Gy, 55 Gy, and – if applicable without additional risk – 59.4 Gy, respectively. An example is given in Fig. 12.7. Target volume definition is generally based on image fusion of planning CT with diagnostic MRI and treatment delivered with IMRT and daily image guidance.
Fig. 12.7
Osseous metastasis of a liposarcoma in the first lumbar vertebra with soft tissue extension into the left psoas muscle (and a further lesion each to the left iliac bone and to the proximal femur, not shown) in a 55-year-old man, 10 years after R0 resection with intra- and postoperative radiotherapy of a 21-cm-sized primary of the left thigh and 2 years after R1 resection and postoperative radiotherapy of a 12-cm-sized sternal metastasis. (a) Coronal and (b) axial contrast-enhanced T1-weighted MR image displaying the intraosseous and extraosseous portion of the lumbar metastasis with elevated signal intensity compared to unaffected vertebral body and muscle signaling. (c) Axial CT image at the level of the affected vertebra, subtle morphological changes in the vertebral body, hypodensity, and enlargement of the left psoas muscle. (d) Target volume definition for definitive radiotherapy in a simultaneous integrated boost technique, visualized on a coronal STIR image and (e) in the axial planning CT: GTV, pale yellow (including soft tissue mass at the level L1-2 and fascial involvement of psoas muscle down to the level L3); PTVSIB1, orange (GTV plus 0.5 cm margin, without spinal canal) to a total dose of 55 Gy in 22 fractions of 2.5 Gy; and PTVlarge, red (GTV plus 1 cm margin in axial, 1.5 cm in cranial and 2.0 cm in caudal directions, including the whole affected vertebral body plus 1 cm margin, reduced in the direction of the right kidney) to a total dose of 44 Gy in fractions of 2.0 Gy. PTVSIB2 – inner yellow contour (GTV with a negative margin of 0.5 cm, minimal distance to spinal canal 1.0 cm) to a prescribed total dose of 59.4 Gy in fractions of 2.7 Gy. (A similar concept was used for radiation treatment of the metastatic sites in the pelvis, not shown.) The maximum point dose in the spinal canal was restricted to 51.5 Gy. The average dose (Dmean) to the left and right kidney was 17.9 and 8.2 Gy, the volume receiving 18 Gy or more (V18Gy) 32.5 and 5 %, respectively. (f) Contrast-enhanced CT image 1 year after definitive radiation treatment: complete remission with recalcification of the vertebral lesion and shrinkage of the soft tissue extension in the left psoas muscle (arrow). No deterioration of renal function parameters
For palliative treatment of STS metastases, hypofractionated treatment with single doses of 3 Gy to a total dose of, e.g., 39 Gy may be offered safely (Soyfer et al. 2010).
12.4 Desmoid-Type Fibromatosis
12.4.1 Anatomy and Histopathology
Desmoid-type fibromatosis is a locally aggressive (myo)fibroblastic neoplasm that usually arises in deep soft tissues. According to the WHO classification 2013, it is a soft tissue tumor of borderline malignancy due to locally aggressive growth with a high tendency toward local recurrence, but lacks metastatic potential. Mesenteric fibromatosis may be associated with Gardner-type familial adenomatous polyposis (FAP). The pathogenesis of sporadic lesions is thought to be multifactorial, with trauma (e.g., from surgery) and endocrine changes (e.g., gestation) playing a role. Abdominal fibromatosis may arise from the musculoaponeurotic structures of the abdominal wall (e.g., rectus or internal oblique muscles) or intra-abdominally in the mesentery or pelvis. Extra-abdominal fibromatosis can occur at any anatomical site; predilection sites are the shoulder, chest wall, back, thigh, and the head and neck region. The macroscopic aspect resembles scar tissue. Histopathologically, the lesions are typically poorly circumscribed with infiltration of the surrounding soft tissue structures. There is a spindle cell proliferation (fibroblasts or myofibroblasts with low mitotic activity and without cytological atypia) in a collagenous stroma, arranged into ill-defined long fascicles, containing prominent blood vessels and sometimes perivascular edema (see Fig. 12.8). Especially in mesenteric or pelvic lesions, myxoid change may be found (Goldblum and Fletcher 2013).
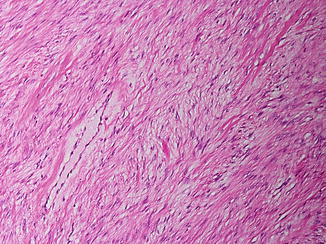
Fig. 12.8
Fibromatosis. Fascicles of bland spindle cells separated by collagen
12.4.2 Imaging in Desmoid-Type Fibromatosis
MRI represents the imaging modality of choice in desmoid-type fibromatosis. For imaging of abdominal fibromatosis, computed tomography still has its role and MRI can be used supplementarily. The intermuscularly located lesions usually exhibit predominantly low signal intensity on T1-weighted MR images and show considerable contrast enhancement (see Fig. 12.9a, b). On T2-weighted images, the signal intensity may vary interlesionally and intralesionally, depending on the extent and distribution of collagen deposits and more cellular areas. Dense areas of collagen typically present as band-like areas of low signal intensity. High T2-weighted signal intensity was found to be associated with a higher contrast enhancement ratio, suggesting that this might reflect greater cellularity and vascularization of a potentially aggressive desmoid tumor (Sinha et al. 2012). Usually, the margins of the lesion are ill defined, reflecting the diffuse infiltration of neighboring tissues. Streaks of high signal intensity in fat-suppressed, contrast-enhanced T1-weighted images or inversion recovery T2 images may exceed the main tumor mass by several centimeters and may indicate the extent of fascial involvement or direction of growth.
Fig. 12.9
Desmoid-type fibromatosis of the left axilla, affecting the subscapularis, the anterior serratus, and the supraspinatus muscle in a 70-year-old woman. Target volume delineation for definitive radiotherapy visualized (a) on an axial T2-weighted image showing an ill-defined mass of low signal intensity and (b) elevated signal intensity on a contrast-enhanced T1-weighted image with fat suppression. Note typical MR morphology with band-like areas of low signal intensity on T2-weighted as well as contrast-enhanced T1-weighted image. (c) Planning CT: GTV – yellow, including all visible extensions along the involved muscles and ventral capsule of the shoulder joint. PTVSIB, orange (GTV plus 1 cm margin, excluding lung tissue) to a total dose of 60 Gy in 30 fractions of 2 Gy, and PTVlarge, red (GTV plus 2.5 cm margin, but not beyond 0.5 cm into lung tissue and 0.8 cm into humerus or air. (d) Axial and (e) coronal view of dose distribution (tomotherapy planning). (f) Dose volume histograms for target volumes and OARs (right to left): GTV, yellow; PTVSIB, orange, dose to 95 % of this volume (D 95%) 58.4 Gy; PTVlarge, red (including the SIB-volume); PTVlarge-in-skin, dark red (subvolume of PTVlarge intersecting with a 0.3 cm interior wall of the body); PTVlarge-in-air, violet (subvolume of PTVlarge outside the body); humerus, green; left lung, dark blue (volume receiving 20 Gy or more (V20Gy) 30 %, V30Gy 12.6 %, mean dose (Dmean) 16.5 Gy); subvolume of left lung used for lung-sparing optimization, beige; whole lung, light blue (Dmean 10.5 Gy); esophagus, violet; and right lung, light pink. During the following year, repetitive MR imaging revealed slow but steady reduction of tumor size and contrast enhancement
12.4.3 Target Volume Delineation in Desmoid-Type Fibromatosis
Local recurrences are common after surgical resection alone, as a histological complete resection is difficult to achieve or would require mutilating surgery with gross functional deficits in individual cases. In a review of 22 publications on treatment of extra-abdominal fibromatosis, the 5-year local control rate was 72 % in case of complete tumor resections (R0) and 41 % in case of tumor-involved surgical margins (R1), whereas rates of 94 and 75 % were reported for a combined treatment with postoperative radiotherapy, respectively. Radiotherapy alone was more effective than surgery alone with control rates of 78 % versus 61 % (Nuyttens et al. 2000). The treatment of recurrences results in higher recurrence rates than treatment of newly diagnosed tumors (Zlotecki et al. 2002), and reported doses vary between 50 and 60 Gy with conflicting data on the issue, whether or not doses above 56 Gy are of further benefit (Gluck et al. 2011; Guadagnolo et al. 2008; Micke and Seegenschmiedt 2005; Rutenberg et al. 2011; Zlotecki et al. 2002).
As spontaneous arrest of the growth was found in approximately 50 % of patients during follow-up with either medical therapy or no therapy at all, modern management of desmoid-type fibromatosis aims for a conservative approach whenever possible, including pharmacotherapy like tamoxifen or imatinib (Bonvalot et al. 2012). In growing tumors, surgery aims for complete resection. Nevertheless, in a substantial percentage of cases, the final resection margins are very close or positive, in which case, additive radiotherapy is indicated (Baumert et al. 2007; Mullen et al. 2012). Irresectable tumors might be referred for definitive radiotherapy; an example is given in Fig. 12.9.
Given the rarity of the disease, details for target volume delineation are sparse, apart from the general advice for generous margins and the risk of failure at the edges of the radiation fields (Zlotecki et al. 2002; Gluck et al. 2011).
In a series of 65 patients treated with postoperative or definitive radiotherapy at the University of Florida between 1970 and 2000, RT portals encompassed the full tumor extent and/or the entire operative bed with the addition of generous, 5–10 cm, margins. After a median total dose of 54 Gy, 11 local failures occurred, two within the RT fields and nine at a margin of the RT field. The authors recommend to choose the size of irradiation ports large enough to cover the tumor bed and the full extent of all operative fields with sufficient margins to cover potential fibromatosis infiltration along the paths of the neurovascular bundles, fascial planes, and other potential paths of least resistance (Zlotecki et al. 2002).
Of 68 patients with radiotherapy for desmoid-type fibromatosis included in a study of a European rare cancer network, 17 developed a recurrence. Eleven recurrences (65 %) occurred at the field border or in areas of the target volume receiving less than 50 Gy of total dose. Thus, the authors supported the recommendation to add wide radiation field margins of at least 5 cm around the tumor or the surgical bed in the direction of possible infiltrative growth (Baumert et al. 2007).
In the series of 115 patients treated at the MD Anderson Cancer Center between 1965 and 2005, radiation portal margins were retrospectively calculated as one half of the difference between the maximal tumor dimension and the largest portal dimension, resulting in values <5 cm in 33 %, 5–7 cm in 22 %, and >7 cm in 44 %. The local control rates after 10 years for the three groups were 66, 88, and 73 %, showing no statistically significant difference. Similar values for local control were found regarding subgroups of patients with and without surgery. The current clinical practice at this institution at the time of publication was to include the surgical bed with a 5–7 cm margin to a dose of 50 Gy in case of marginal tumor resection. For gross disease, treatment of gross tumor volume plus 5–7 cm margins to a dose of 50 Gy was recommended, to be followed by a boost to the GTV with 2–3 cm margins to a cumulative dose of 56 Gy (Guadagnolo et al. 2008).
A series of 31 patients from a single institution was managed with a combination of tumor resection and intraoperative electron irradiation (IOERT) to a median dose of 12 Gy, followed by fractionated postoperative external-beam radiotherapy (EBRT) to a median dose 45 Gy. The IOERT boost was intended to cover the surgical bed with a margin of 1 cm as visually defined in correspondence with the surgeon. In fact, the median applicator size was 9 cm (range 5–14 cm), whereas the reported median tumor size was 9 cm as well (range 4–25 cm). The EBRT target volume included the surgical bed (and macroscopically residual tumor, if present), with a safety margin of 5–7 cm. After a median follow-up of 32 months, 5 recurrences were noted, classified as in-field IOERT in three, in-field EBRT in one, and at the border of the EBRT field in one case. The estimated 5-year local control for the whole group was 73 % and within the IORT-field 82 %, respectively (Roeder et al. 2010).
In our institution, the general principles of sarcoma treatment are applied (see above). Apart from the main tumor mass, we include all streaky changes of high MRI signal intensity in contrast-enhanced, fat-suppressed T1-weighted images and in STIR images into the GTV. Definitive radiotherapy is applied in IMRT technique with a simultaneous integrated boost concept and daily image guidance (see Fig. 12.9). The boost volume, consisting of the GTV plus a 0.5 cm margin to derive the CTVboost and another 0.5 cm margin to derive the PTVboost, is treated to a total dose of 60 Gy with single fractions of 2.0 Gy. The CTVlarge considers the GTV with margins of 1.5–4.5 cm, depending on the anatomical site and the directions of growth. The PTVlarge, including the CTVlarge plus a 0.5 cm margin, is to be treated to a total dose of 54 Gy with single fractions of 1.8 Gy. The 2–4.5 cm margins are applied in the directions of suspected tumor growth, i.e., along the fascial planes and neurovascular bundles, and the smaller 1.5–2 cm margins in the direction perpendicular to these planes. In case of tumor adherence to bone, a maximal slice of 1 cm thickness of the bone is included in the PTVlarge.
In the postoperative setting, apart from reconstructing the contact zones of the removed tumor mass, all manipulated tissue from previous tumor resections including scars are identified and in our practice included in the “GTVpostop.” Applying the margins as described above, the PTVlarge is derived. Drainage sites are at least included in the CTVlarge with 0.5 cm margins. In case of microscopically involved resection margins (R1 resection), treatment of a boost volume based on the contact zones of the resected tumor and the resection cavity with 1 cm margins is discussed individually. In case of localized macroscopic residual tumor (R2 resection), a boost volume is treated to a total dose of 60 Gy, consisting at least of the residual tumor plus a 1 cm margin.
12.5 Osteosarcoma
12.5.1 Anatomy and Histopathology
Bone tumors account for less than 0.2 % of all malignant tumors. The annual incidence of osteosarcoma (OS) is approximately 0.2–0.3/100,000 with a peak incidence of 0.8–1.1/100,000 in the age group 15–19 years and a smaller peak in older adults (0.4/100,000 for people aged ≥60 years). The vast majority of osteosarcomas arise in the long bones of the extremities, especially in the distal femur (30 %), proximal tibia (15 %), and proximal humerus (15 %), i.e., the sites of the most proliferative growth plates. In long bones, the metaphysis is the predilection site with 90 %. In adolescents, up to 70 % of tumors are located around the knee. Tumors of the axial or craniofacial skeleton are primarily observed in adults.
For primary osteosarcomas, i.e., in cases of normal underlying bone, different genetic syndromes such as Li-Fraumeni, hereditary retinoblastoma, and others are predisposing conditions. Secondary osteosarcoma can occur after previous radiotherapy (2.7–5.5 % of all osteosarcomas are radiation induced), after transformation in Paget’s disease of the bone, or rarely in the context of bone infarction or benign tumors (fibrous dysplasia), all typically affecting older patients.
Histopathologically, most high-grade osteosarcomas are conventional osteosarcomas, subclassified according to the predominant matrix into osteoblastic OS (76–80 %), chondroblastic OS (10–13 %), fibroblastic OS (10 %), or other rare histological subtypes. Less common are telangiectatic OS (<4 % of all osteosarcoma), small cell OS (1.5 %), or high-grade surface OS (<1 %). Conventional osteosarcoma has a broad morphologic spectrum and grows permeatively, replacing the marrow space, eroding preexisting trabeculae, and expanding haversian systems. An essential component for the diagnosis of OS is the presence of neoplastic bone or unmineralized matrix (osteoid). In osteoblastic OS, the principal matrix is neoplastic bone with variation between thin trabeculae to compact bone (see Fig. 12.10). In chondroblastic OS, the neoplastic cartilage is usually hyaline, but may be myxoid (e.g., in tumors of the jaw). The cartilage may be the dominating component over neoplastic bone. In fibroblastic OS, the tumor cells are often spindled with severe atypia and associated with extracellular collagen. Conventional OS typically arises in the medullary cavity of the metaphysis with ultimate destruction of the cortex, circumferential extraosseous soft tissue formation, and displacement of the periosteum (Fletcher et al 2013).
Fig. 12.10
Osteoblastic osteosarcoma, high grade, G3. Trabeculae of immature bone (“osteoid”) are produced by anaplastic tumor cells. (a) H&E and (b) van Gieson stains
12.5.2 Imaging in Osteosarcoma
On conventional radiographs, osteosarcoma typically shows a geographic growth pattern of moth-eaten or permeative bone destruction. Mineralized tumor matrix can produce “cloud-like” or “ivory-like” areas of increased radiodensity which occurs in combination with lytic portions. Exclusively blastic or lytic lesions are rare. The tumor usually destroys the bony cortex and causes an interrupted or complex periosteal reaction in 90 % of the cases. Osteoblastic osteosarcomas can be associated with radiating spicules of periosteal bone formation giving the lesion a “sunburst” appearance.
CT can visualize the destruction of cancellous and cortical bone, bone sclerosis, matrix mineralizations, and the extraosseous tumor component (see Fig. 12.11a). Its ability to define the exact intraosseous extent of the lesion is however limited.
Fig. 12.11


Osseous metastasis of a high-grade osteosarcoma affecting the 4th thoracic vertebra in a 19-year-old woman, 3 years after multimodal curative treatment of the primary in the left distal femur. (a) Pretreatment diagnostic CT: eburnation of the vertebral body and spiculated periostal reaction, large extraosseous paravertebral tumor component. (b) T2-weighted MR image displaying an inhomogeneous tumor mass of low signal intensity, contacting anteriorly the esophagus, aorta, and origin of left subclavian artery, bilaterally the pleura and protruding into the spinal canal. In order to release beginning paraplegia, sensory deficits, and pain, gross tumor resection was performed, proving tumor infiltration of the mediastinum, bilateral pleura, and vertebral ligaments extending just to involve level Th3 and Th5 (R1 resection). The resected vertebral body was reconstructed with a titanium cage, and the spine surgically stabilized from Th2 to Th6. Second-line chemotherapy (carboplatin, etoposide) was initiated and additive radiation therapy planned to be given simultaneously to the 3rd and 4th cycle. (c) Planning CT displaying the postoperative situation with artifacts due to stabilization material. For contouring and planning, an MV-CT was registered as well as (d) a myelo-CT for exact delineation of the spinal cord – green. Target volume delineation was based on the GTVcontact/postop, yellow (tissue contacting the initial tumor, the resection cavity and surgically manipulated tissue), rather than on the GTVinitial, blue (tumor mass at diagnosis). PTVSIB, orange (GTVcontact/postop plus 1 cm margin, restricted to 0.5 cm into lung and mediastinal tissues and to a distance of 0.6 cm to the spinal cord) with a prescribed total dose of 60 Gy in 30 fractions of 2 Gy, and PTVlarge, red (GTVcontact/postop plus a 2 cm margin, restricted to 1 cm into lung and mediastinal tissues and to a distance of 0.6 cm to the spinal cord) with a prescribed total dose of 54 Gy in fractions of 1.8 Gy. (e) Sagittal view of the dose distribution (tomotherapy planning). At the level of tumor initially contacting the spinal cord (lower part of Th3 to upper part of Th5), a total dose of 45 Gy (orange) is prescribed, with maximal myelon sparing above and below. (f) Dose volume histograms: PTVSIB60Gy, yellow; PTVlarge54Gy, red; spinal cord at high risk (Th3-5), orange; spinal cord beyond high-risk level, green; and whole lung, blue. The maximal dose at a distance of 0.3 cm to the spinal cord was 50.2 Gy and at a distance of 0.6 cm 58.0 Gy, respectively
Related posts:

Stay updated, free articles. Join our Telegram channel
Full access? Get Clinical Tree
