Fig. 32.1
The resection probability map in three orthogonal sections for left-sided and right-sided nonenhancing gliomas based on 234 patients. The color legend corresponds with the resection probability as indicated. The x/y/z coordinates refer to MNI152 standard brain space
32.2 Examples of the Use of Resection Probability Maps
Resection probability maps could both serve individual patient care and evaluation of patient groups. None of these applications have been evaluated in clinical practice, but may prove to be useful for evaluation and ultimately improvement of the quality of care for patients with a glioma.
32.2.1 Individual Patient Care
For the individual patient, indication for surgery, surgical planning and postoperative evaluation may be enhanced by relating the tumor location of an individual patient with aggregated results of other patients, which can be a resection probability map for instance based on best practice or based on previous institutional experience.
32.2.1.1 Patient Selection
The decision to advice a patient to have resective surgery for a glioma depends on several factors, including symptomatology and anticipated reduction of symptoms, radiological diagnosis of grade and type, patient condition, age, comorbidity, tumor size, tumor location, and anticipated resectability. In many institutions treatment decisions are made in a brain tumor board meeting with professionals from different disciplines taking part in a structured discussion on the arguments in favor of and against a number of treatment alternatives. The treatment options with the arguments provided by the board meeting are discussed afterwards with the patient, who ideally comes to a ‘shared treatment decision’. Sometimes explicitly, but oftentimes implicitly the attending neurosurgeon evaluates the resectability as anticipated extent of resection or expected residual volume based on a mental reference map of similar cases and sometimes non-invasive functional mapping. The result of this evaluation differs between teams, between neurosurgeons, and between moments in time for a single neurosurgeon. Unfortunately, this estimation cannot be fully objective, and many neurosurgeons may rather overestimate than underestimate the extent of resection. This inherently biased view could be made more objective using a resection probability map that quantitates the resectability for each location of a new patient’s tumor, indicating the regions that will most likely be resected and which regions will likely not be resected as was reported in 2007 [25]. In this study, the extent of resection was predicted in being more or less than 10 mL for 82% of 65 patients.
The board meeting discussions can be sharpened further by the choice of the reference resection probability map. With accumulating patient information on resections, it should be possible to relate with reference maps of a single neurosurgeon, a neurosurgical team, a regional or national best practice standard or even a international leading team.
Some interesting arguments for treatment decisions can be expected from this type of evaluation. For instance, in case a new patient presents to a less experienced surgical team and this new patient’s tumor contains regions that are universally resectable (‘green’) compared to a reference map of other teams, then it may not be necessary to refer this patient with a less complex glioma to a more experienced neuro-oncological team. And the patient can likely be operated without or with intraoperative stimulation mapping in case a resection beyond the tumor delineation on MRI (‘supracomplete’) is considered. As another example, in case a new patient’s tumor has regions with a resectability of around 0.5 then surgical treatment may benefit from more advanced techniques such as intraoperative stimulation mapping to determine the functional limits of the resection (Fig. 32.2). Yet, in case a new patient’s tumor has regions that are largely unresectable (‘red’), then it may be the best option to advice the patient to have a biopsy and other treatment such as chemotherapy and/or radiotherapy. Obviously a minimal threshold of resectability to profit from resective surgery remains elusive, although a partial resection of less than 50% of resection or a residue larger than 10 mL was indicated to have no or minimal impact on survival [1]. However, in case resective surgery is indicated such as for seizure control or reduction of mass effect, than a limited resection could be considered using the resection probability map information.
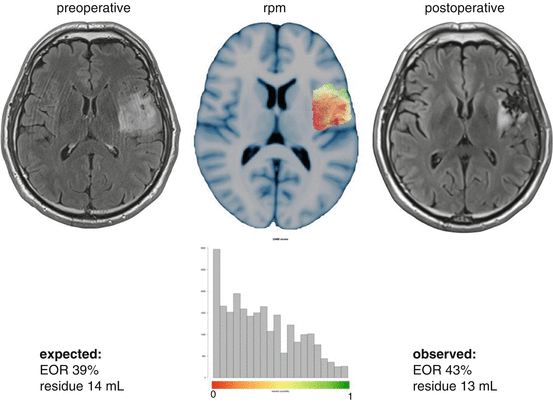

Fig. 32.2
An example of preoperative prediction of the residual volume and the expected extent of resection for a patient with a nonenhancing glioma. One axial section is shown at the same level in the resection probability map for only voxels corresponding with this patient’s tumor location. The postoperative MRI after 3 months is shown on the right, while this patient had surgery without resection probability map information. The histogram plots the resection probabilities of the voxels at the tumor location with corresponding expected surgical results and observed surgical result after measurement on the postoperative MRI
32.2.1.2 Surgical Planning
Once the decision has been made for resective surgery, the information from a resection probability map may be incorporated in the planning of the surgery along other image-guided techniques. So that the likelihood of resection can be incorporated in a surgical plan in addition to DTI tracking of white matter pathways, functional MRI or magnetoencephalography of brain regions involved in a specific task, and MRI SWI imaging of perforating arteries.
Intraoperatively image-guided navigation can project all regional information including resectability on the surgical field to enhance the surgical decision making at various stages of the resection.
The information on resectability can be used as an educational tool for residents and fellows to steepen their learning curves in successful glioma surgery by continuously answering the question whether to stop a resection based on what was done in other patients by other neurosurgeons. For instance, a less experienced neurosurgeon can be warned during resection that a critical region is approaching because the resectability drops according to previous surgical decisions by others as captured by the resection probability map.
32.2.1.3 Postoperative Evaluation
After the resection of a glioma the neurosurgeon can have a notion of the expected residue based on experience. A glioma cannot be completely resected at a cellular level. At best the imaging indicates the absence of tumor residue because microscopic disease remains undetectable, sometimes referred to as gross total resection. A postoperative MRI is customarily made to determine the residue more objectively. The neurosurgeon’s estimate and the observations on MRI do not necessarily comply with each other [29, 30]. The postoperative MRI is usually qualitatively reviewed by the radiologist and neurosurgeon and sometimes the residual volume is measured. Using the resection probability map the residual tumor can be quantitated in relation to surgical results in other patients for instance a best practice map (Fig. 32.3). So that the quality of the resection can be quantitated. Furthermore, relating the postoperative evaluation to the surgical results of an experience glioma surgeon from another surgical team may enhance the distribution of this expert’s knowledge. This has been demonstrated for the first time in a series of patients who had resection of low-grade glioma in Paris by a starting surgical team [31].
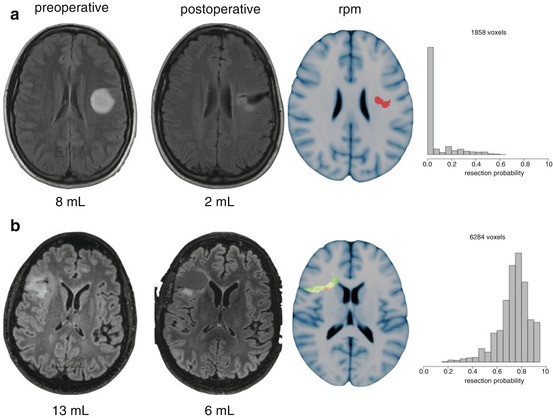

Fig. 32.3
An example of postoperative evaluation of the residual volume. (a, b) demonstrate resections of nonenhancing gliomas of similar pre and postoperative volume. (a) can be considered a favorable surgical result with remaining voxels with low resectability in the patients that contributed to the resection probability map. (b) can be considered a less favorable surgical result with remaining voxels with high resectability in other patients
Of course the interpretation of tumor residue versus postsurgical artefacts can be ambiguous. For instance, postsurgical diffusion restriction as a result of hypoperfusion has to be taken into account and should not be misinterpreted as postoperative residue [32, 33].
Residual glioma tissue on postoperative MRI is frequently observed, in particular after resective surgery for T2/FLAIR hyperintense diffuse infiltrative gliomas. In the ideal situation infiltrative tumor residues are only present in brain regions associated with an unacceptable risk of functional decline. In practice, however, postoperative residues can have several explanations. Intentional residues need to be discerned from unintentional residues. First, intentional residues involve regions where glioma tissue cannot be removed because critically functional structures have been infiltrated, such as the corticospinal tract or the optic radiation. Extending the resection to these regions would result in permanent neurological deficits. Second, intentional residues involve regions where fragile and critical vasculature is surrounded by glioma, such as the lenticulostriatal arteries at the medial margin of insular gliomas. Extending the resection beyond these arteries could result in deprived vascularization and irreversible ischemia of critically functional regions, such as the internal capsule, resulting in permanent neurological deficits. Third, intentional residues can involve regions nearby critically functional structures. A safety margin of infiltrating tumor tissue is then accepted, anticipating on avoidance of transient neurological deficits. For instance, for patients of higher age or requiring undelayed adjuvant therapy a temporary loss of function may be deemed unacceptable. Avoidance of transient neurological deficits is based on the hypothesis that postresection edema, contusion and reversible hypoperfusion at the margin of the resection cavity will not involve the critical functional regions. Fourth, unintentional residues can occur because glioma tissue has not been recognized during surgery. Attempts to distinguish infiltrative glioma tissue from normal brain during surgery rely on microscopical appearance, tissue consistency, (functional) anatomical context, image-guided ultrasound navigation, and intraoperative MRI. Each of these techniques is subject to false negative observations, which is why the authors stress that glioma resections should rather be optimized using intraoperative stimulation mapping to extend up to functional regions. Fifth, unintentional residues can also occur because of early cessation of surgery, resulting in a multistage procedure. This includes prolonged postictal loss of function after epileptic seizures induced by stimulation mapping, patient fatigue, or loss of patient cooperation, loss of orientation by the surgeon, unexpected longevity of the procedure, or anesthesiological circumstances. This should largerly be avoidable in teams with expertise based on applying inatraopetive stimulation a routine basis.
32.2.2 Patient Cohorts
Individual patient results can be aggregated at the level of a surgical team, an institution, or geographical regions in resection probability maps to compare resectability. This could serve as quality evaluation at a higher level to facilitate discussions on the best practice care for patients with a glioma. One example is the comparison of two surgical teams treating low-grade glioma patients with similar surgical techniques with similar resection results [27].
Given the variation in techniques to maximize tumor removal and to preserve functional integrity, treatment variation between teams is likely. The application of these techniques depends on availability (intraoperative MRI, magnetoencephalography, PET imaging), expertise (electrostimulation, motor evoked potentials), and opinions based on limited evidence (microscope, cusa settings, neuronavigation). Perhaps more important than technological variation is a diversity in arguments, concepts, ideas, and sometimes dogmas in the field of glioma surgery. On the one hand this diversity facilitates development and improvement, on the other hand this can result in different outcome for patients.
Obviously the extent of resection is only one perspective on quality of care, but resection probability maps provide an instrument to compare surgical achievements without brain location bias. This is not an endpoint, but a starting point for discussions on quality of neurosurgical care between professionals. This instrument could pinpoint the discussions between teams to more clearly define the border between brain regions where resections should proceed and brain regions where resective surgery should be avoided. It is clearly not a goal of resection probability maps to push neurosurgeons towards ‘more green maps’, but to have them become aware of the surgical decision where to stop a resection. The more interesting brain regions that may or may not be compensated and consequently may or may not be resectable are those regions with intermediate resectability. These brain regions are amenable to plasticity in some but not all patients. A better definition, understanding and prediction of this plasticity facilitates better surgical decision making in individual patients ([34]).
Furthermore, it should be stressed that surgical decision making does not only depend on brain location, but on many other factors, such as symptoms, anticipated symptom reduction by a reduction of mass effect, radiological diagnosis of grade and type, patient condition, age, comorbidity, and tumor size. Ultimately, the synthesis of all this information translates into well-informed surgical decision making by experts. The instrument of resection probability mapping could add meaningful and comprehensive brain location information to this process.
32.3 Method
Resection probability maps can be processed from routine clinical MR images. The processing consists of several steps requiring user interaction. These steps include: (1) collecting and storing of MRI dicoms, (2) segmenting of 3D tumor objects in each patient, such as preoperative tumor and postoperative residue, (3) registrating patient space to a standard brain space, (4) comparing single case results with a probability map based on a patient cohort and comparing one probability map with another probability map.
32.3.1 Collect Imaging Data
The first step is to identify patients that meet the requirements for inclusion in a probability map analysis. As this depends on the pertinent research question, this is beyond the scope of this text, but the quality of the results largely depends on the quality of this patient identification. Selection bias can be minimized by a good patient registry. For instance for a patient to be included in a universal best practice probability map several requirements should be met. Such as having a favorable functional outcome status according to standardized definitions, perhaps including cognitive performance and/or employment return in addition to neurological tests. And having a favorable oncological outcome according to standardized definitions, such as being alive at 6 years after diagnosis ([35]).
Second, the MR images of these patients should be acquired. Several characteristics can be discerned on different imaging protocols. Standardized imaging protocols are beneficial to standardize further processing [36]. However routine clinical imaging with T2/FLAIR- and T1-weighted imaging before and after gadolinium enhancement usually suffice for glioma detection. The noise from diversity of imaging protocols between institutions is likely less than the noise from other aspects of the processing, such as tumor delineation or patient to standard brain space registration.
Third, for legislative purposes it is important to strip the patient imaging files from any identifying information as early in the processing as possible. Numerous anonymization software packages are available providing from basic to advanced customization. In practice, not all MR image files are created equal and anonymization requires a dedicated template filter for each specific manufacturer’s scanner. On the one hand all identifying information should be discarded, while on the other hand all necessary imaging information, such as calibration and information on dimensions and orientation should be preserved. Examples consist of the MIRC DICOM Anonymizer (http://mircwiki.rsna.org/index.php?title=The_MIRC_DICOM_Anonymizer#Accessing_the_Anonymizer_Configurator_for_a_Storage_Service), custom matlab extension packages (http://nl.mathworks.com/help/images/ref/dicomanon.html), or DicomCleaner (http://www.dclunie.com/pixelmed/software/webstart/DicomCleanerUsage.html).
Fourth, clinical MRIs are acquired and stored in dicom file format (http://dicom.nema.org). In many image processing software packages the NIfTI file format (http://nifti.nimh.nih.gov) is preferred or required. Several tools are available to convert from a stack of 2D dicom files to one 3D nifti file, such as extension packages for Matlab (https://www.mathworks.com/matlabcentral/fileexchange/42997-dicom-to-nifti-converter–nifti-tool-and-viewer), SPM (http://www.fil.ion.ucl.ac.uk/spm/software/spm12/) or MRIcron from Chris Rorden (http://people.cas.sc.edu/rorden/mricron/index.html).
Fifth, after this preprocessing a file archive has to be constructed to store the data. This can be quite a tedious task depending on the level of structure that is required. A low level solution is a straightforward folder structure. The advantage is simplicity, but the disadvantage is limited searching and sorting options. A high level solution is a full feathered pacs server storage, such as available open source from Osirix [37] (http://www.osirix-viewer.com/PACS.html#PACS), Orthanc (http://www.orthanc-server.com/index.php), Conquest (https://ingenium.home.xs4all.nl/dicom.html) or XNAT [38] (https://www.xnat.org). This allows for scripted query and export of data, but specific expertise in installation, security and maintenance is required.
32.3.2 Segment Tumor Outlines
The next step is the identification of the tumor or residue on the images. The result is a 3D volume of voxels consisting of either 0s where there is no tumor or 1s at tumor locations, a socalled binary volume. Again a standard is lacking.
The most accepted strategy is the manual segmentation of tumor on sequential 2D patient images by an expert in radiology. This is very time consuming and can take several hours per scan. Another difficulty is that segmentation in one direction, for instance on axial sections, does not render an acceptable segmentation in another direction, coronal or sagittal, so that a lot of editing is necessary. Furthermore even between experts agreement on tumor segmentation can diverge considerably with DICE scores between 75–85% [39–46]. When resources are limited this is not always a realistic strategy for a dataset. A standard interpretation for glioma delineation on images is lacking. In general, for glioblastoma the T1-weighted images are used for tumor measurement, while acknowledging the underestimation of non-enhancing tumor elements. For low-grade and anaplastic gliomas the T2/FLAIR-weighted images are used. Two standards have been proposed for MRI assessment of glioma. First, standardized criteria for MRI response assessment have been postulated by the Response Assessment in Neuro-Oncology Working Group to apply in clinical trials of low-grade [47] and high-grade glioma [48]. Responses are categorized in four classes based on tumor diameter changes. Second, a standardized feature set (VASARI) was developed to characterize glioblastoma on MRI using 24 imaging characteristics based on the Visually Accessible Rembrandt Images [49, 50] (VASARI Research Project) (https://wiki.cancerimagingarchive.net/display/Public/VASARI+Research+Project). Both standards were not developed for the purpose of volume segmentation, but to address a specific clinical need. Furthermore, the interobserver agreement has not been systematically assessed for these standards. At the other end of the spectrum is a fully-automated segmentation. This has been attempted by several imaging teams as Multimodal Brain Tumor Image Segmentation (BRATS) benchmark challenge [39] evaluating 20 segmentation algorithms to delineate gliomas. The ideal fully-automated algorithm should be rapid, accurate, reproducible and scriptable for this purpose. No single automatic algorithm seems to outperform the manual segmentation of experts so far. Although several algorithms rank high in the benchmark tests, such as BraTumIA [51, 52] and GLISTR [53]. Automatic segmentation relies of a model of normal brain image measurements and the likelihood that image measurements deviate from normal due to tumor. This is a notoriously difficult task for several reasons. First, detection is based on relative intensity differences between abnormal and normal tissue that are smooth and obscured by artefacts and anatomical structures. Second, tumors vary considerably in location, size, and infiltration, so that a priori assumptions on abnormal tissue cannot be too strong. Third, normal brain structures can be grossly distorted or altered in signal by tumor and/or treatment effects, so that a priori assumptions on normal tissue cannot be too strong either. Fourth, the normal brain model can be optimized for a dedicated imaging protocol, but it is difficult to extrapolate any model to another environment with different scanners and protocols.
In between fully-automated and manual segmentation algorithms are many semi-automatic strategies that guide the user in a more rapid, more reproducible manual segmentation. These have been reviewed [54–56]. Three generations of semi-automatic algorithms are discerned. The first generation includes simple image analysis such as intensity thresholding and region growing. The second generation adds uncertainty models, such as tissue classification and supervised or unsupervised cluster analysis, as well as optimized boundary tracing techniques, such as the ‘snake’, ‘fuzzy connections’ or ‘watersheds’. The third generation includes data driven a priori knowledge, such as atlas-based segmentation or shape modeling. Examples of popular open source software packages that provide semi‑automatic tumor segmentation algorithms are Osirix [37] (http://osirix-viewer.com), ITKsnap [57] (http://www.itksnap.org/pmwiki/pmwiki.php?n=Main.HomePage), and Slicer [58] (https://www.slicer.org).
32.3.3 Register MRIs
The next step is to align the patient MRIs so that brain locations of tumors and residues can be compared between patients. Conceptually the transformation is determined from the patient’s individual brain space to a standard brain space. This transformation is then applied to the binary tumor segmentations that were outlined in patient brain space.
At each step several options are available, while the best selection for each step remains undetermined for images of glioma. This should be optimized in a trial and error approach for each specific research question and for every dataset. Major decisions consist of the sequence of registrations, the registration algorithm with its parameters, and the standard brain space atlas.
For the purpose of resection probability maps both the preoperative and postoperative tumor volume is segmented. These segmentations are derived from separate MRI sessions of the same ‘subject’. Each MRI set can be registered to standard brain space separately directly (two subject-to-atlas registrations) or indirectly by first determining an intersession registration for the same patient from the postoperative set to the preoperative set and second a patient to standard space registration (one intra-subject and one subject-to-atlas registration). Sometimes the preoperative tumor volume is estimated from the postoperative imaging by adding the resection cavity to the postoperative tumor volume [25, 26]. This may avoid a separate registration step for the preoperative MRI session but typically in the case of removal of brain tissue beyond the preoperative tumor volume, as in supracomplete resections, the interpretation can become ambiguous. Many open source registration algorithms are available. A comprehensive effort to benchmark customary algorithms has been done for normal brain of adults [59, 60] and of children [61]. These algorithms have not been evaluated for lesioned brains. For normal brains no single algorithm performed best. Highly ranked algorithms were: ART, SyN, IRTK, and DARTEL. Some of these are available as standalone application, others are distributed in software suites such as Slicer [58] (https://www.slicer.org). Each application comes with its own parameters and optimal settings. It is typical to use sequential registration steps with incremental complexity: translation, rigid, affine, and deformable registration. The registration of lesioned brains may be improved by the lesion masking feature. This essentially cancels out the intensity information at the lesion from the calculation of the registration. The optimal settings for various parameters may be different between datasets from different scanners and from different scan sessions. Usually a tradeoff is required between time and accuracy. Depending on these settings and hardware resources, a typical registration of one patient’s MRI to standard space could take approximately 10–60 min. Standard brain space is by no means ‘standardized’. Many atlases have been developed that could serve as common reference frame [62]. The classical stereotactic space was established by Talairach [63], that was devised for stereotactic procedures in deep-brain structures. Other atlases are based on a single indivudual’s brain that has been scanned many times, such as Colin27 [64]. This atlas is a very precise representation of this single brain but it does not capture anatomical variability. Other atlases have aligned normal brain MRIs of many individuals aiming to capture anatomical variability, such as MNI305, MNI152, and ICBM452 [65–67]. These atlases mainly differentiate in the numbers of individual brains and the methods for alignment, either linear or non-linear.
Stay updated, free articles. Join our Telegram channel

Full access? Get Clinical Tree


