Without underlying
liver disease
With underlying liver disease
p value
Number
82
124
−
Liver disease, n (%)
HBV (HBsAg+)
HCV (anti-HCV Ab+)
NASH
Alcoholic liver disease
Other
−
81 (65.3)
23 (18.5)
6 (4.8)
5 (4.0)
9 (7.3)
−
Age, yearsa
65.1 ± 14.2
57.0 ± 12.0
<0.001
Sex, M:F
1.8:1
2.9:1
0.029
Asian descent, n (%)
5 (6.1)
71 (57.3)
<0.001
Serum AFP level, ng/ml a
7033 ± 20,622
10,711 ± 46,452
N.S.
Serum AFP level >200 ng/ml, n (%)
24 (36.9)
35( 31.8)
N.S.
Major resectionb
43 (52.4)
61 (49.2)
N.S.
Blood transfusion, n (%)
35 (44.3)
30 (24.4)
0.003
Postoperative mortality, n (%)
3 (3.7)
3 (2.4)
0.005
Fibrosis stagec, n (%)
0
1
2
66 (80.5)
11 (13.4)
5 (6.2)
11 (9.2)
32 (26.7)
77 (64.2)
<0.001
Tumor size, cm a
9.7 ± 5.6
7.3 ± 4.9
0.002
Tumor size >7cm, n (%)
49 (61.3)
48 (39.0)
0.002
Number of tumorsa
1.28 ± 0.72
1.15 ± 0.42
N.S.
Vascular invasion, n (%)
None
Microvascular
Macrovascular
25 (31.6)
38 (48.1)
16 (20.3)
36 (29.0)
59 (47.6)
29 (23.4)
N.S.
Satellitosis, n (%)
21 (26.9)
36 (29.0)
N.S.
Poor histological grade, n (%)
11 (14.5)
29 (24.4)
0.036
Positive surgical margin, n (%)
9 (12.0)
9 (7.4)
N.S.
Both groups underwent major resections (≥3 Couinaud segments) in roughly half of the cases, a rate far exceeding that reported in cirrhotic patients undergoing resection for HCC [4, 7, 12], a reflection of their well-preserved liver function. The likelihood of perioperative blood transfusion and the perioperative mortality rate were significantly higher for patients without underlying disease (44.3 vs. 24.4 %, 3.7 vs. 2.4 %, respectively), possibly a sequela of a greater mean tumor size (Table 1).
As expected, most patients without underlying disease had negligible hepatic fibrosis in the background liver parenchyma; by contrast, the majority of patients with underlying disease had histological evidence of either mild (F1) or moderate (F2) hepatic fibrosis according to the Scheuer staging system [28]. It should be noted that patients with bridging fibrosis (F3) are generally grouped with cirrhotic patients (F4) and are not included in this series.
The comparatively larger mean tumor diameter (9.7 vs. 7.3 cm) and greater percentage of patients with tumor diameter greater than 7 cm (61.3 vs. 39.0 %) observed in patients without underlying disease is clearly related to the mode of presentation: those tumors were generally recognized once they had reached an adequate size to cause mass-related symptoms. By contrast, most of the 81 HBV-positive patients in the underlying disease group were enrolled in HCC surveillance programs and came to diagnosis at an earlier temporal point in tumor growth, either through an abnormal liver ultrasound examination or elevated serum AFP. Despite larger tumor size, patients without underlying disease developed fewer poorly differentiated tumors (14.5 vs. 24.4 %). Table 1 summarizes additional pathological findings.
2.2 Outcomes and Prognostic Factors
Median overall survival (OS) and time to recurrence (TTR) for the entire noncirrhotic cohort were 52.0 and 24.2 months respectively, with 5 year OS and recurrence-free survival (RFS) rates of 46.3 and 39.1 % respectively (Figs. 1 and 2). Patients without underlying liver disease had significantly lower OS than those with liver disease, with a median OS of 36.1 versus 88.0 months and a 5 year OS of 33.6 versus 56.4 % (Fig. 3). Incidence of recurrence, TTR, and 5 year RFS did not differ significantly between groups. Patterns of recurrence were also similar, with liver-only recurrence noted in just over half of patients who recurred. Many of these patients underwent repeat hepatic resection or local ablative therapy with curative intent.
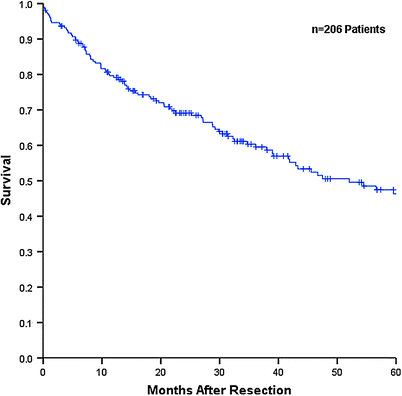
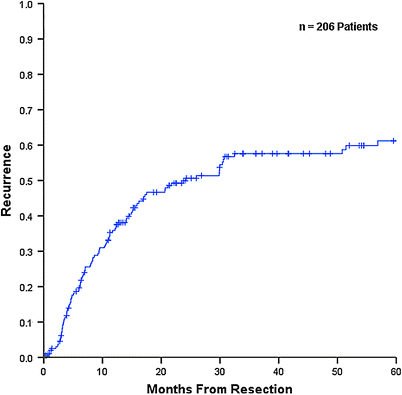
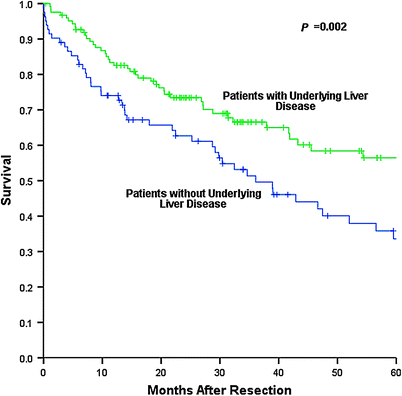

Fig. 1
Overall survival for entire noncirrhotic population (n = 206). Based on data collected at The Mount Sinai Medical Center, New York, NY, 1987–2010

Fig. 2
Time to recurrence for entire noncirrhotic population (n = 206). Based on data collected at The Mount Sinai Medical Center, New York, NY, 1987–2010

Fig. 3
Overall survival difference between noncirrhotics with underlying liver disease (n = 124, green tracing) versus noncirrhotics without underlying liver disease (n = 84, blue tracing). p = 0.002. Based on data collected at The Mount Sinai Medical Center, New York, NY, 1994–2010
On univariate analysis (Table 2), decreased TTR was associated with age >60 years, perioperative blood transfusion, tumor diameter >7 cm, presence of satellites, and vascular invasion; decreased OS was associated with age >60 years, non-Asian ethnicity, perioperative blood transfusion tumor diameter >7 cm, presence of satellites, and vascular invasion. Hepatitis B surface antigen (HBsAg)-positive serology was associated with better survival on univariate analysis. On multivariate analysis (Table 3), tumor diameter >7 cm, presence of satellites, and vascular invasion were independent predictors of recurrence; tumor diameter >7cm, presence of satellites, and vascular invasion were predictors of decreased survival. HBsAg-positive serology was a predictor of enhanced survival on multivariate analysis.
Table 2
Univariate analysis of clinical and pathological variables associated with recurrence and survival (n = 206)
No. | Median time to recurrence (mo.)a | p value | Median overall survival (mo.)a | p value | |
|---|---|---|---|---|---|
Gender | 0.31 | 0.491 | |||
Male | 141 | 29.8 ± 11.9 | 56.5 ± 12.2 | ||
Female | 65 | 14.0 ± 5.3 | 47.4 ± 10.3 | ||
Age | 0.027 | 0.013 | |||
>60 years | 109 | 16.1 ± 2.7 | 38.9 ± 8.7 | ||
≤60 years | 97 | 51.4 ± 28.8 | 89.7 ± 25.7 | ||
HBsAg | 0.211 | <0.001 | |||
Positive | 81 | 30.4 ± 11.9 | 131.0 ± 28.4 | ||
Negative | 125 | 16.8 ± 4.3 | 38.9 ± 6.4 | ||
Anti-HCV Ab | 0.741 | 0.171 | |||
Positive | 23 | 30.6 ± 13.7 | 31.4 ± 9.2 | ||
Negative | 183 | 24.2 ± 4.9 | 59.5 ± 11.7 | ||
Asian ethnicity | 0.318 | 0.006 | |||
Yes | 76 | 30.5 ± 14.6 | 89.7 ± 200.6 | ||
No | 130 | 17.5 ± 4.9 | 42.9 ± 5.2 | ||
Perioperative transfusion | 0.002 | 0.001 | |||
No | 137 | 32.4 ± 18.6 | 89.8 ± 19.0 | ||
Yes | 65 | 14.0 ± 2.2 | 34.6 ± 5.3 | ||
Parenchymal fibrosis | 0.084 | 0.064 | |||
None (F0) | 77 | 15.7 ± 3.0 | 42.9 ± 10.4 | ||
Mild (F1) | 43 | 15.9 ± 3.0 | 36.0 ± 6.5 | ||
Moderate (F2) | 82 | 51.4 ± 22.8 | 89.7 ± 11.0 | ||
Diameter of tumor | <0.001 | <0.001 | |||
≤7 cm | 106 | 51.4 ± 28.0 | 89.8 ± 10.4 | ||
>7 cm | 97 | 10.3 ± 1.5 | 22.4 ± 5.5 | ||
Number of tumors | 0.981 | 0.551 | |||
Single | 174 | 25.9 ± 5.4 | 56.5 ± 11.3 | ||
Multiple | 32 | 20.6 ± 3.4 | 38.9 ± 6.8 | ||
Satellites | <0.001 | <0.001 | |||
Yes | 57
Stay updated, free articles. Join our Telegram channel
Full access? Get Clinical Tree
 Get Clinical Tree app for offline access

|
