Work by Blundell (1824) indicating the need to use a donor of the same species has been referred to in an earlier chapter. Blundell’s work was fully confirmed by Ponfick (1875), who showed that if the red cells of a donor of another species were transfused, they underwent rapid intravascular lysis. Ponfick also showed that when the red cells of a donor of one species were mixed in vitro with the serum of another, haemolysis occurred.
Despite Blundell’s earlier work, an enthusiasm for transfusion and difficulty in recruiting human donors led to a considerable vogue for giving transfusions of lamb’s blood during the last quarter of the nineteenth century (Gesellius 1874; Hasse 1874). Not all physicians were impressed, particularly as lamb’s blood, except when used in very small quantities, ‘invariably escaped via the kidneys’ (Fagge and Pye-Smith 1891). A witticism of the time ran that for a transfusion three sheep were needed: the donor, the recipient and the doctor (Zimmerman and Howell 1932).
Transfusions Between Members of the Same Species
The first studies of red cell survival following transfusion between members of the same species (bulls) were described by Todd and White (1911) in animals that had not previously been transfused. In fact, all the donor red cells were eliminated within a few days, presumably through the action of naturally occurring antibodies. Ashby (1919), who used a similar technique to study red cell survival following transfusions between humans, found prolonged survival, due no doubt to the selection of ABO-compatible red cells.
Scope of This Chapter
The present chapter is concerned mainly with experimental studies of the survival in vivo of small amounts of incompatible red cells and with theoretical deductions from the results. Chapter 11 deals with the clinical effects of the accidental transfusion of relatively large amounts of incompatible blood.
Some of the factors that affect the rate and site of destruction include: (1) the characteristics of the antibody, namely binding constant, Ig class and IgG subclass, ability to activate complement, thermal range and plasma concentration; (2) the characteristics of the antigen, namely abundance of sites on the cell surface and association with complement activation (both related to antigen specificity); (3) the number of red cells transfused; (4) the presence of the relevant antigen in the plasma; and (5) the phagocytic activity of the mononuclear phagocyte system (RES). In analysing the effects of these variables, tests with volumes of red cells as small as 1 ml or less have proved very helpful. The injection of such amounts almost never produces untoward symptoms in the recipient, causes virtually no immediate change in the concentration of antibody and does not tax the capacity of the RES. Accordingly, the main factors determining the rate of red cell destruction are the various characteristics of the antibody, including its concentration. The characteristics of the antigen also affect the result but this source of variability can be eliminated by using red cells from a single donor or can be minimized by using red cells of a particular phenotype or ‘grade’ of antigen.
In the present chapter, the results of tests with small volumes of red cells will be considered first from a qualitative point of view, that is to say from the patterns of red cell destruction observed, and second from the quantitative point of view, using evidence derived from investigations in which the amounts of antibody and antigen involved have been determined. The situation encountered in clinical practice, in which relatively large numbers of incompatible red cells are transfused, will then be discussed.
Estimation of Survival of Incompatible Red Cells
When incompatible red cells are transfused by accident, as a rule the only way to study their survival is with a serological method (see Chapter 9). For example, if the donor red cells are group N and the recipient is group M, differential agglutination with anti-M will provide estimates of the survival of the unagglutinated group N donor red cells. If the donor is Rh D positive and the recipient D negative, the donor red cells can be recognized by direct agglutination with anti-D or, if the recipient has formed anti-D, the surviving red cells can be recognized by the direct antiglobulin test (DAT) (Wiener and Peters 1940; Dacie and Mollison 1943). If a flow cytometer is available, quantitative estimates can be made whenever an antigenic difference between the red cells of the donor and the recipient exists, and suitable antisera are available (Garratty and Arndt 1999).
Ordinarily, the transfusion service does not perform an extended phenotype on the patient’s red cells. As a result, no serological target for differential agglutination may be obvious after transfusion has taken place. However, if even modest erythropoiesis continues, the youngest circulating cells should belong to the recipient. The serologist can make use of this finding to separate the young from the old cells with a capillary gradient method and phenotype the separated (autologous) cells to identify the best serological target (Wallas et al. 1980). Here too, flow cytometry has become a method of choice (Griffin et al. 1994; Garratty and Arndt 1999). An elegant non-serological technique can be used should the transfused patient be one with a sickling disease. Red cells from patients with SS or SC haemoglobin (Hb) resist lysis with hypotonic saline. When a specimen from such a transfused patient is exposed to hypotonic saline (0.3%), the transfused cells are lysed and the native cells can then be resuspended in isotonic solution and phenotyped (Brown 1988). Semi-quantitative estimates of the Hb variant can be determined by electrophoretic techniques.
In experiments in which incompatible red cells are deliberately transfused, various labels can be used. For example, in studying the response of D-negative recipients to D-positive red cells, cord red cells can be transfused and their survival determined by making counts by the acid-elution method. However, the method of most general application and greatest precision is that of labelling with 51Cr (see Chapter 9).
The following pages describe experiments to determine the relation between the serological characteristics of antibodies and the effects that they produce in vivo. The scope of tests with small volumes of incompatible red cells in ordinary transfusion practice has been discussed briefly elsewhere (Mollison 1981). In clinical practice, tests are indicated when it is uncertain whether the injected red cells will survive normally.
Labelling of Incompatible Red Cells: the Chrome Standard
Labelling with radionuclides remains the best method, as the survival of amounts less than 1 ml can be estimated accurately. Although flow cytometry offers certain advantages, the opportunity to store serial samples for example, the need to inject about 10 ml of red cells (Garratty and Nance 1990; Issitt et al. 1990) is a disadvantage. Kumpel and co-workers (2000) performed clearance studies using 4 ml of autologous D+ cells coated with anti-D at two concentrations (5 or 10 µg anti-D/ml of red cells) transfused to two subjects at separate times and survival studies using 5 ml of frozen-thawed D+ cells transfused to five D–subjects with no detectable anti-D. Flow cytometry is now the best method for typing reticulocytes in mixed cell populations (Griffin et al. 1994). None of the flow cytometric assays exhibited the necessary sensitivity or accuracy in quantification of the rare events to provide reliable data for the calculation of the initial clearance rate, the red cell half-life or the mean cell lifespan of transfused red cells. The inability to enumerate rare fluorescence-labelled cells was due mainly to the presence of ‘background’ events, which were a considerable problem when the coating level of anti-D was less than 3000 molecules of IgG per cell. If these techniques can be made more sensitive, they may become the method of choice.
Almost all of the results discussed in the present chapter were obtained using 51Cr, which, when survival is to be followed for more than a few hours, remains the best label. For labelling with other radionuclides and with biotin, see Chapter 9. With 51Cr, loss of label from red cells is slow, about 3% in the first 24 h with only about 1% per day thereafter (see Chapter 9). The T1/2 of radioactive decay is 27.7 days, which allows studies over a period of weeks if necessary. In contrast, when red cells are labelled with 99mTc, about 4% of the label is lost from the red cells during the first hour. The rate of loss over the next 2 or 3 h is similar, but thereafter the rate slows and the loss in the first 24 h is about 30%. The rate of loss of indium (111In or 113In) appears to be 3–5% during the first 15 min after injection and approximately 15% in the first 24 h. 99mTc and 111In appear to be suitable for detecting substantial destruction occurring in the first few hours after injection, but 51Cr must be used if small amounts of destruction are to be detected reliably or if survival is to be followed for longer periods. For further details and references, see Appendix 2.
Use of 51CR
A dose of 0.2–0.5 µCi (7–18 kBq)/kg may be used, for example 12–30 µCi in a 60-kg adult. Using 51Cr with a specific activity of 100 µCi/µg, a maximum of 0.3 µg of Cr will be added. Thus, even when the amount of red cells injected is as small as 0.3 ml, the amount of 51Cr (1 µg/ml of red cells) will be well below the level that is likely to produce any interference whatever with the survival of the red cells.
The common indication for injecting small numbers of donor red cells is to determine whether survival will be normal. A 1-ml aliquot usually suffices for this use. In a few other circumstances, injection of smaller aliquots may be advisable. For patients whose serum contains potent incomplete antibodies (those detected only with antiglobulin reagents), a dose of 0.5 ml of red cells is recommended, as infusions as small as 1 ml have been known to provoke chills and fever. For subjects whose serum contains haemolytic antibodies, tests should be performed with caution and no more than 0.1–0.2 ml of red cells should be injected.
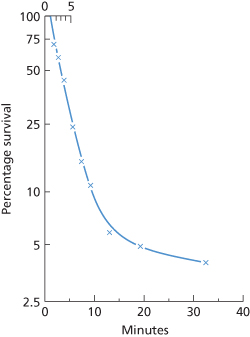
When early rapid destruction of donor red cells appears unlikely, a sample drawn from the recipient 3 min after the injection of the cells may be used as the 100% survival value. In most normal subjects, mixing is at least 98% complete by 3 min (Strumia et al. 1958; Mollison 1959a) (Figure 10.1) and appreciable destruction of injected red cells within the mixing period occurs only with relatively potent antibodies; an example is given in Figure 10.2. If such early destruction is suspected, an estimate of the patient’s red cell volume will be required, and is best obtained by labelling a sample of the patient’s own red cells with either 99mTc or 111In and injecting these labelled red cells and the 51Cr-labelled donor red cells as a single suspension (‘double label’ technique).
Figure 10.1 The rate of appearance of labelled red cells in samples taken from one superficial arm vein after injecting the cells into a vein in the other arm. Two different samples of the subject’s own red cells were injected, labelled with 51Cr (•) and 32P (×) respectively. One sample was injected about 30 s after the other, but in each case the times are expressed as seconds from the mid-point of injection to the mid-point of the sample. ‘100%’, the concentration attained after complete mixing, based on samples taken 10–20 min after injection.
(Source: Mollison 1959a. Reproduced with permission of the BMJ Publishing Group.)
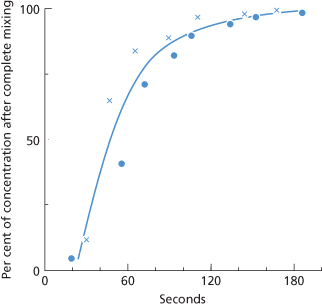
Figure 10.2 Survival in vivo of a sample of red cells from an Fy(a+) donor; the cells were labelled with 51Cr, incubated with purified IgG anti-Fya and with complement, and re-injected into the donor. Red cell volume was determined by simultaneous injection of another sample of the donor’s red cells labelled with 32P but otherwise untreated. Mixing was probably incomplete at 2 min; a line drawn through estimates of survival at 2.8, 3.7 and 5.6 min intersects the time axis at about 1 min after the mid-point of injection. The initial rate of destruction has a T1/2 of 2 min; the rate of destruction starts to slow 5–10 min after injection of the cells.
(Source: Mollison 1962, case 3b. Reproduced with permission of Schwabe.)
Qualitative Aspects of Red Cell Destruction by Alloantibodies
As described in Chapter 3, red cells are not directly damaged by antibodies. The attachment of antibodies leads to destruction in one of two ways: either complement is activated leading to damage to the red cell surface by C8–9 followed by lysis; or the red cells, coated with antibody or complement (C3b, iC3b), or with both antibody and iC3b, become attached to a phagocyte, leading to loss of membrane, lysis or engulfment.
Predominantly Intravascular Destruction
With rare exceptions, the only antibodies that produce intravascular lysis of the majority of the red cells transfused are those that are readily lytic in vitro and the mechanisms are probably identical. The commonest antibodies of this kind are anti-A, anti-B and anti-A,B. As Figure 10.3 shows, within 2 min of injecting ABO-incompatible red cells, the plasma may contain Hb equivalent to 90% of the amount contained in the injected intact red cells (Jandl et al. 1957; Cutbush and Mollison 1958). For antibodies other than those in the ABO system (e.g. anti-Vel and anti-Lea), in vitro haemolysis and intravascular haemolysis may not correlate as well.
Figure 10.3 Intravascular haemolysis of 51Cr-labelled ABO-incompatible red cells.  , B cells injected into a group A recipient. •, A2 cells injected into a group O recipient.
(Source: Cutbush and Mollison 1958. Reproduced with permission of John Wiley & Sons Ltd.)
When ABO-incompatible red cells that are lysed incompletely by the recipient’s serum in vitro, because either the antibody or the antigen is relatively weak, are transfused, fewer than one-half of the injected red cells may be lysed intravascularly. Figure 10.3 shows an example in which, following the transfusion of a small volume of A2 red cells to a group O recipient, only 40% of the Hb was found in the plasma immediately after injection.
When the anti-A or anti-B in the recipient’s plasma is weakly lytic so that lysis is observed in vitro only when the ratio of serum to cells exceeds about 500 : 1, destruction of the transfused cells may take place predominantly in extravascular sites with only 10% of the injected radioactivity being found in the plasma (Jandl et al. 1957).
When destruction by anti-A and anti-B is very rapid, 99.9% of the cells may be lysed within 10 min (see Figure 10.3). When destruction is slower, some cells may survive for relatively long periods having, presumably, acquired resistance to complement-mediated destruction.
Certain other antibodies, particularly anti-PP1Pk and anti-Vel, which are readily haemolytic in vitro, seem capable of causing predominantly intravascular lysis of incompatible red cells, but few quantitative data have been published (Tilley et al. 1977).
Many examples of anti-Lea and rare examples of anti-Leb lyse red cells in vitro, but as a rule the lysis is relatively slow. Accordingly, when small amounts of incompatible red cells are injected, the cells may be cleared by the RES before there has been time for haemolysis to occur. If relatively large amounts of incompatible red cells are transfused, some intravascular haemolysis may be observed. Exceptionally potent Lewis antibodies may produce some intravascular haemolysis even when small amounts of incompatible red cells are injected.
In the case reported by Mollison and co-workers (1963), 0.5 ml of 51Cr-labelled Le(b+) red cells were injected at a time when the titre of anti-Leb in the patient’s serum was approximately 100. A sample taken 4 min later contained 60% of surviving cells with 13% of the injected radioactivity in the plasma: the sample at 13 min contained 16% of surviving cells and 7% of the injected radioactivity in the plasma. The discrepancy between the amounts of Hb in the two plasma samples suggested that some degree of haemolysis might have occurred after the samples had been withdrawn; this possibility emphasizes the need to separate cells from plasma promptly when making observations of this kind.
Erythrophagocytosis Accompanying Lysis by Anti-A and Anti-B
As mentioned above, not all ABO-incompatible red cells are lysed in the plasma. Presumably, most of the remainder are engulfed by cells of the RES but some are engulfed by neutrophils, so that erythrophagocytosis is observed in films of peripheral blood (Hopkins 1910; Ottenberg 1911). Gross neutropenia may be produced by the injection of as little as 10 ml of ABO-incompatible red cells.
Predominantly Extravascular Destruction
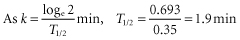
All antibodies except those that are readily haemolytic in vitro bring about extravascular destruction of red cells, chiefly in sinusoids of the liver and spleen. The maximum rate of disappearance of red cells from the bloodstream corresponds to the clearance of rather more than one-third of the blood per minute (Mollison 1962); that is, k, the fractional rate of red cell clearance = approximately 0.35/min.
When clearance occurs with a T1/2 of the order of 2 min, surface counting shows that approximately 75% of the cells have been sequestered in the liver and approximately 10% in the spleen (Mollison and Hughes-Jones 1958).
Antibodies that fail to activate complement, of which anti-Rh D is exemplary, bring about destruction predominantly in the spleen (Jandl 1955; Mollison, 2nd edn; Jandl and Greenberg 1957). In predominantly splenic destruction, the maximum rate of clearance observed corresponds to a T1/2 of approximately 20 min (k = approximately 0.035/min); more than 90% of the cells are removed in the spleen (Hughes-Jones et al. 1957). Under these circumstances, the rate of clearance of red cells is limited by the rate of blood flow through the spleen.
As the blood flow through the liver is approximately 10 times greater than that through the spleen, antibodies such as anti-D must not achieve efficient red cell destruction in the liver. In fact in splenectomized subjects, red cells heavily coated with anti-D are cleared with a T1/2 of the order of 3–5 h, indicating that, on a weight basis, the liver is about 100 times less efficient than the spleen at removing D-sensitized red cells from the circulation (Crome and Mollison 1964).
It has been proposed that in the spleen, because the packed cell volume (PCV) of the blood is higher, plasma IgG competes with bound IgG antibodies for Fc receptors on macrophages far less successfully than it does in the liver (Engelfriet et al. 1981). By contrast, the adherence of complement-coated cells is not inhibited by plasma and therefore the cells bind to macrophages just as well in the liver as they do in the spleen.
Release of Some HB Into the Circulation in Predominantly Extravascular Destruction: a Touch of Pink
Jandl and co-workers (1957) found that when D-positive red cells were injected into subjects whose plasma contained anti-D, or when D-positive red cells were incubated with anti-D in vitro and then re-injected, haemoglobinaemia developed within a few minutes of the injection and increased steadily to reach a peak 2 or 3 h after the injection.
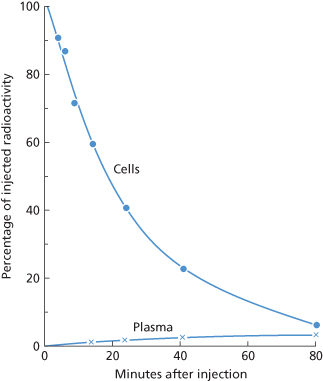
In a previous edition, it was shown that when amounts of 51Cr-labelled, anti-D-coated red cells of less than 1 ml are injected and the rate of clearance of the cells is approximately 0.035/min, the maximum amount of radioactivity in the plasma is usually 2–5%, reached about 1–2 h after injection (10th edition, p. 321; see also Figure 10.4). Allowing for the fact that 51Cr and Hb are being cleared steadily throughout this period, the amount released probably corresponds to about 10% of the number of red cells injected.
Figure 10.4 Radioactivity found in red cells and plasma following the injection of 51Cr-labelled D-sensitized red cells. A small amount of radioactivity appears in the plasma about 10 min after the injection and reaches a maximum after about 1 h. This radioactivity in the plasma represents Hb liberated into the circulation.
(Source: Mollison 1959a. Reproduced with permission of the BMJ Publishing Group).
Jandl and co-workers (1957) found that in subjects injected with approximately 10 ml of red cells, the maximum plasma Hb concentration did not as a rule exceed 6% of the amount injected in the red cells, although in one subject injected with a larger volume of red cells (about 20 ml) the plasma Hb concentration reached the equivalent of 12% of the amount injected in the red cells. Presumably when amounts of this order are injected the capacity of the RES to clear the Hb–haptoglobin complex is taxed, clearance is slowed and Hb tends to build up in the plasma. Alternatively, it is possible that intravascular haemolysis takes place in the absence of complement fixation and activation.
Haemoglobinaemia associated with predominantly extravascular destruction is thought to occur when red cells are lysed by the lysosomal enzymes released by macrophages following contact of the antibody-coated cell with the macrophage (Fleer et al. 1978; Kurlander et al. 1978). Thus, the process is postulated to be the same as that observed in antibody-dependent cell-mediated cytotoxicity tests in vitro.
‘Lag’ before the Onset of Extravascular Destruction: Delayed But Not Denied
When the percentage survival of incompatible red cells is plotted against the time after their injection into the circulation there is an apparent ‘lag’ before destruction begins. The most obvious explanation is that accelerated destruction cannot begin until the cells have taken up sufficient antibody but, like many obvious explanations, this one is probably incomplete or incorrect. Even if cells are previously sensitized by antibodies in vitro or rendered non-viable by storage, the lag before the onset of destruction persists. In a series of measurements with such ‘altered’ red cells this delay was found to be 1.35 min, SD 0.45 (Mollison 1962). The most likely explanation for this ‘lag’ is an anatomic one. The circulation time through the portal circuit is slower than circulation through the rest of the body so that the time required for cells to pass from the point of injection to the sampling point (arm vein) may be of the order of 1–2 min. Accordingly, a blood sample taken from an arm vein less than 1 min after the injection of incompatible cells will not include any cells that have transited the portal circulation and thus it will appear that no cells have been cleared from the circulation (Mollison 1962).
After the injection of incompatible red cells, which must take up antibody before becoming susceptible to rapid clearance by the RES, a somewhat longer lag is observed. In 10 cases in which the antibody concerned was capable of agglutinating red cells suspended in saline, the mean apparent delay was 2.20 min, SD 0.75; and in 12 cases involving incomplete, complement-binding antibody, the mean delay was 4.0 min, SD 1.5 (Mollison 1962). Obvious examples of lags are provided by several figures in this chapter (see Figures 10.5, 10.6 and 10.7).
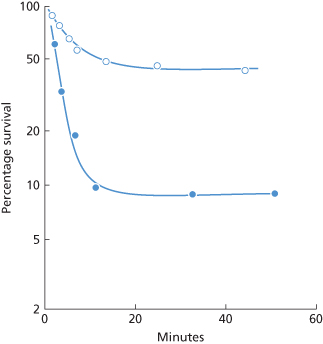
Figure 10.5 Clearance due to complement-binding IgM antibody (anti-Lea) (Mollison 1986).  , 1 ml of Le(a+ b+) red cells injected into a subject whose plasma contained anti-Lea. After a delay of 3 min, 50% of the cells are cleared rapidly, the initial rate of destruction having a T1/2 of about 9 min. The rate of clearance starts to diminish within 10 min of injection and percentage survival is the same at 20 and 50 min (Cutbush et al. 1956). •, 1 ml of Le(a+ b–) red cells injected into the same subject; after a delay of about 2.3 min, 95% of the cells are cleared with a T1/2 of 2 min. The rate of clearance starts to diminish within 10 min of injection and percentage survival is the same at 100 as at 24 min (observations during first 10 min only published by Mollison and Cutbush 1955).
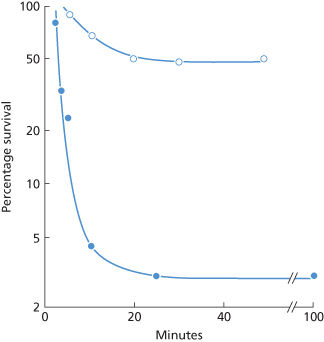
Figure 10.6 Destruction of P1-positive red cells in a patient whose serum contained anti-P1, weakly active at 37°C. (a) P1-positive red cells labelled with 32P were injected as an ice-cold suspension (•) and red cells from the same donor labelled with 51Cr were injected as a warm (39°C) suspension (×) immediately afterwards. The temperature of the suspension at the time of injection did not appear to influence the survival. (b) Deduction of the initial rate of destruction of the warm suspension from (a). If it is (incorrectly) assumed that there are two subpopulations of red cells, one susceptible to rapid destruction and one resistant, the half-time of clearance of the susceptible population, plotted as the difference between the observed points and the extrapolated ‘slow’ component, is estimated to be 2 min. If it is (correctly) assumed that all cells are initially susceptible, the initial rate of destruction is estimated to have a half-time of 5 min.
(Source: (a) Mollison PL 1956. (b) Mollison PL 1989. Both parts reproduced with permission of John Wiley & Sons Ltd.)
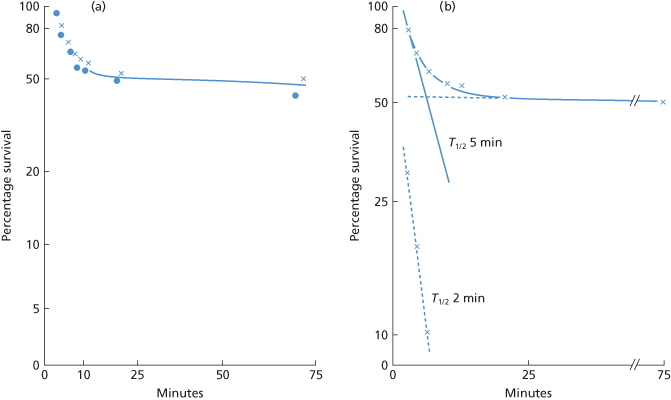
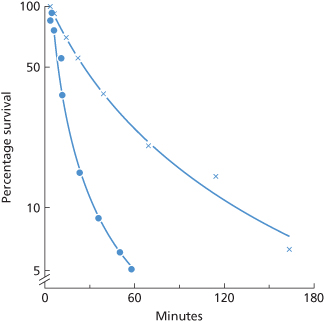
Figure 10.7 Destruction by a complement-binding example of anti-K of 1-ml doses of K-positive red cells. •, KK cells (10th edition, p. 325); ×, Kk cells.
(Source: Hughes-Jones et al. 1957. Reproduced with permission of John Wiley & Sons Ltd.)
When the concentration of antibodies in the serum is very low, long delays may be observed. For example, in a D-negative subject injected with 1 µg of intramuscular anti-D and infused 24 h later with 0.3 ml of D-positive red cells, the maximum rate of red cell destruction began about 5 days afterward (Mollison and Hughes-Jones 1967). A similarly long delay was observed by Schneider and Preisler (1966) after injecting small amounts of low-titre anti-D and D-positive red cells into D-negative subjects. The delay is due partly to the time taken for the uptake of IgG into the circulation and partly to the time taken for antigen and antibody to come into equilibrium at very low concentrations (Mollison and Hughes-Jones 1967).
Relation Between Antibody Characteristics and Patterns of Red Cell Destruction
Those antibodies, whether IgM or IgG, that activate complement but cause either no lysis in vitro or only slow lysis characteristically bring about destruction of red cells in the liver. Initially, destruction is rapid with a T1/2 of a few min, but after 5–20 min, and usually between 5 and 10 min, destruction slows abruptly. With IgM, antibody destruction is all but arrested, but with IgG antibody, destruction continues, although at a reduced rate (Mollison 1989). These patterns do not point to two populations of red cells, one susceptible and one resistant to rapid destruction. Rather, the whole population is susceptible to rapid destruction initially, but destruction slows as iC3b on the red cells is inactivated. Accordingly, the initial rate of destruction is obtained by extrapolating the tangent to the initial slope to the time axis, rather than by subtracting the ‘slow component’ (see Figure 10.6b).
Those IgG antibodies that do not activate complement, for example anti-D, some examples of anti-K and -Fya, characteristically bring about red cell destruction in the spleen, often with no measurable destruction in the liver. Destruction produced by immune non-complement-binding IgG antibodies is typically described by a single exponential, even when the rate of destruction is very slow. On the other hand, some naturally occurring, non-complement-binding IgG antibodies (anti-D, anti-E) exhibit removal kinetics described by at least two components.
Although evidence reviewed in previous editions of this book appeared to indicate that non-complement-binding IgM antibodies could cause red cell destruction, a re-appraisal of the data suggests that they do not. As macrophage receptors specific for IgM have not been confirmed, if haemolysis can be effected through IgM binding alone, some other mechanism must be postulated.
The following sections contain examples of destruction by the various kinds of antibody described above.
Complement-Binding IGM Antibodies
Complement-binding IgM alloantibodies, the commonest of which are anti-A, -B, -A1, -HI, -P1, -Lea and -Leb, almost all occur naturally. Of this list, only anti-A and anti-B are often strongly lytic in vitro and in vivo. Lewis antibodies may cause slow lysis in vitro but only rarely cause intravascular haemolysis. Anti-A1, -HI and -P1 are almost never lytic in vitro; rare examples activate complement to the C3 stage and, when active at 37°C, may be capable of destroying small volumes of incompatible red cells in vivo.
Some examples of the patterns of destruction produced by complement-binding IgM antibodies are as follows.
Anti-A and Anti-B
As described above, anti-A and anti-B commonly bring about the intravascular destruction of a proportion of injected incompatible red cells (see Figure 10.3).
In subjects with hypogammaglobulinaemia, who often have very low levels of circulating anti-A and anti-B, destruction may be almost entirely extravascular. Destruction may be relatively rapid with an initial rate corresponding to a T1/2 of a few minutes, with some slowing apparent after 10–20 min (Chaplin 1959); or 50% may be removed with a T1/2 of a few minutes with much slower removal (T1/2 1.5 days) of the remainder (van Loghem 1965). In some cases there is no evidence of initial hepatic destruction, as in a case in which destruction was predominantly splenic with a T1/2 of 12 h (van Loghem 1965); complement activation may be too weak to influence the mode of destruction in such cases. In still other cases, survival is only slightly subnormal with a T50Cr of 9–15 days. Similarly, in three healthy group A subjects without serologically detectable anti-B, the T50Cr was 10–21 days (van Loghem 1965). In these various cases, destruction was probably influenced by an IgG component of antibody.
The effect of low concentrations of anti-B has also been investigated by injecting small volumes of B cells and of anti-B serum into a patient of group A with hypogammaglobulinaemia in whom group B cells had previously been found to have a T50Cr of 9–15 days; with varying amounts of anti-B the rate of destruction ranged from 1% to 14% per minute (Jandl and Kaplan 1960). It can be inferred from the data that slowing of destruction occurred after 6–21 min when 20–90% of the cells had been destroyed.
Experiments in which cells have been sensitized in vitro with anti-A or anti-B and then injected into the circulation of either healthy subjects or subjects with complement deficiency are described below in the section on sequestration and release of injected red cells.
Anti-Lea and Anti-Leb
Most examples of anti-Lea give a positive indirect antiglobulin test (IAT) with anti-complement at 37°C and cause some destruction in vivo of a small dose of Le(a+) red cells. With potent anti-Lea the initial rate of clearance may have a T1/2 as short as 1.9 min, but the rate is slower than this with less potent antibodies (Mollison, 2nd edn; Cutbush et al. 1956).
When group O, Le(b+) red cells were injected into the circulation of a group A subject, whose plasma contained potent anti-Lea, 20–50% of the transfused red cells were destroyed owing to the small amount of Lea substance carried on group O, Le(b+) red cells (Cutbush et al. 1956; Figure 10.5).
A few examples of anti-Leb react at 37°C with cells of the same ABO group as the recipient. With those that do, the pattern of destruction is the same as with anti-Lea. For example, in one case in which a patient’s plasma contained unusually potent anti-Leb reactive at 37°C in vitro, the initial rate of destruction of group O, Le(a– b+) red cells had a T1/2 of 4.5 min; destruction slowed abruptly after about 10 min and 44% of the cells were still present in the circulation at 6 h (Mollison 1959c).
In five cases in which anti-Leb was active only at 30°C or less, survival of a small volume of Le(b+) red cells was normal at 24 h; in three others in which anti-Leb was active at 37°C, 24-h survival ranged from 6% to 58%; in each of the three cases a two-component survival curve was observed (Davey et al. 1982).
Anti-A1-HI and -P1
Most examples of these antibodies are not active in vitro above a temperature of about 25°C and are incapable of causing destruction of injected red cells. In cases in which the antibody has reacted in vitro at 37°C, or has given definite reactions only up to 30–34°C, with dubious reactivity at 37°C, there has been some hepatic destruction initially with slowing after 10 min and with only slightly subnormal survival thereafter. For anti-A1, see Cutbush and Mollison (1958) and Mollison and co-workers (Mollison et al. 1978); for anti-HI, see Mollison (1959a) and for anti-P1 see Mollison and co-workers (Mollison, 2nd edn) and Figure 10.6.
A close relationship has been observed between thermal range in vitro and destruction of a 1-ml dose in vivo. For example, in one case in which anti-HI was weakly active at 31°C in vitro, no destruction whatever occurred in the 40 min following injections of 1 ml of red cells and in another, in which, at 37°C, the antibody only doubtfully agglutinated red cells but weakly sensitized them to agglutination by an anti-complement reagent, 20% destruction occurred in the first 20 min with virtually normal survival thereafter (PL Mollison, unpublished observations). In a further case in which weak agglutination and a positive reaction with anti-complement was observed at 37°C with anti-P1, 50% of the cells were destroyed in 20 min (see Figure 10.6).
Anti-H
In three OBHM subjects with weak or undetectable anti-B and anti-H (or -HI), 4-ml amounts of group B and O cells underwent 40–70% destruction; in a fourth subject, following the injection of 58 ml of group B cells, there was little or no destruction (Lin-Chu and Broadberry 1990), possibly because the number of antibody molecules bound per cell was too small.
In contrast, the anti-H present in subjects with the Oh (Bombay) phenotype is strongly lytic in vivo. When a small sample of 51Cr-labelled group O donor red blood cells was infused into one such individual, the T1/2 of the infused cells was 6 min, with 2% of the cells surviving at 24 h. A similar study using the patient’s own labelled red blood cells demonstrated 100% survival at 24 h. Anti-H was active in saline at 4°C, 22°C and 37°C and by the IAT. The antibody(ies) showed both IgM and IgG components. The anti-H titre at 37°C rose from 4 prior to the infusion of the O cells to 32 at 1 week post infusion, and a partial haemolysin appeared. Saliva inhibition studies demonstrated that the antibody was neutralizable prior to the group O exposure but was not neutralizable 1 week post exposure (Davey et al. 1978).
Auto-Anti-I
This antibody is considered here because the pattern of destruction of injected I-positive red cells follows the same two-component kinetics as seen with the foregoing alloantibodies. In three patients with cold haemagglutinin disease (CHAD) with potent auto-anti-I, following the injection of a small dose of 51Cr-labelled I-positive red cells a two-component curve was observed: 30–60% of the cells were removed in 40–120 min with much slower removal of the remaining cells, i.e. T1/2 5–10 days (Evans et al. 1968). In a case in which detailed observations were made over the first 35 min, destruction started to slow 5–10 min after injection of the red cells and was very slow after 20 min, by which time about one-third of the cells had been destroyed (Mollison 1985).
Anti-M
This antibody almost never binds complement. In one exceptional case (Cutbush and Mollison 1958), the serum, containing only IgM anti-M, weakly sensitized M+N–, but not M+N+, red cells to agglutination by anti-complement. Following the injection of test doses of red cells, 65% of M+N– cells were removed with a half-time of 4 min; the rate of destruction slowed after 10 min. M+N+ cells were removed with a half-time of 4.5 days.
Effect of Temperature of Injected Red Cells
In a subject with anti-P1 weakly reactive in vitro at 37°C (see Figure 10.6) and in another with anti-M reactive in vitro at 34°C, although not at 37°C (Mollison 1959b), one sample of labelled incompatible red cells was warmed to 37°C and one, labelled with a different isotope, was cooled in ice water, following injection. Survival curves of the injected cells were superimposable.
Effect of Hypothermia on Cold Alloantibodies
In a clinical lecture at St. Thomas’s Hospital in London, John Elliotson reported a man with episodes of bloody urine whenever he was exposed to the cold:
The singular circumstance, however, in this man’s disease was, that when his paroxysms came on he discharged bloody urine. … The bloody urine was intermittent … There can be no doubt of the truth, because the man showed his urine and the blood was abundant in it … Having had aguish fever, however, in the severe form which he suffered whenever the east wind blows or he is exposed to cold or wet … he will be liable to a return of the disease.
(Elliotson 1832, in The Lancet).
It is likely that this patient had a cold haemagglutinin that resulted in haemolysis when his body temperature dropped below the thermal amplitude of the antibody. Cold agglutinins are common, but those with a broad thermal amplitude, and therefore clinical sequellae, are not.
As most cold alloantibodies are IgM and complement binding, the issue of clinical significance in patients subjected to artificial hypothermia recurs frequently. Most transfusion services have long ago abandoned antibody screening at temperatures below 30°C, and virtually all hospitals crossmatch blood at a temperature of 37°C, even for patients undergoing procedures that involve deep hypothermia. Given the dearth of adverse events reported, it is likely that cold alloantibodies inactive at 37°C but active at some lower temperature such as 25°C or 30°C, rarely cause clinically significant red cell destruction when the patient is cooled. Although some shortening of red cell lifespan may result from the cold alloantibody, accurate assessment of red cell survival is confounded by changes in blood volume induced by haemorrhage and transfusion. One approach to this problem is to inject two labelled suspensions of red cells, one susceptible and one resistant to destruction, and note whether the ratio of the two populations changes during hypothermia. In a case investigated in this way, no evidence of destruction by anti-P was observed when the patient was cooled, but some destruction had occurred before cooling so that the cells had presumably become resistant to complement-mediated destruction.
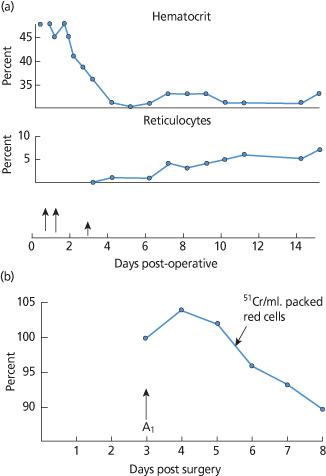
Clinical data concerning cold agglutinins, hypothermia and haemolysis are limited. In the first case, reported at NIH, intravascular haemolysis began during cardiac surgery under hypothermia in a patient with an anti-HI cold agglutinin. Haemolysis continued for a week with destruction of an amount of red blood cells equal to the mass of A2B cells transfused. At the same time, 51Cr-tagged A1 cells survived normally (Figure 10.8) (Wertlake et al. 1969). The authors speculated that ‘this cause of clinical hemolysis must be a rare complication of hypothermia’ which has proved to be prescient, since only a handful of case reports, some of questionable reliability, have been published since then. An oft-cited case report involves a patient with Mycoplasma pneumoniae, cold agglutinins and a haemolytic anaemia that may have resulted from vigorous treatment of hyperpyrexia with a cooling mattress (Niejadlik and Lozner 1974). Other anecdotes involve cold agglutinins in extracorporeal circuits and agglutination in the plastic tubing during plasmapheresis. None is particularly convincing. Perhaps the most reassuring data involve in vivo survival of M (M+N–) red cells in two patients with anti-M studied during hypothermia. The low-titre, IgM antibodies did not react at 30°C. 51Cr survival studies performed with 2 ml of labelled blood documented normal circulation of M (M+N–) cells at 37°C, and no accelerated loss of these cells at blood temperatures between 16° and 28°C. One patient received 187 ml of MN (M+N+) red cells when the blood temperature was 25°C without evidence of a clinical transfusion reaction and without development of a positive DAT (Kurtz et al. 1983).
Figure 10.8 (a) Continuing haemolysis after surgery under hypothermia. (b) Survival of 51Cr A1 red cells injected on third day of postoperative haemolysis. Long arrows indicate whole blood transfusions; short arrow the time of 51Cr A1 cell injection.
(Source: Adapted from Wertlake et al. 1969. Reproduced with permission of John Wiley & Sons Ltd.)
Complement-Binding IGG Antibodies
As described in Chapter 6, IgG antibodies of certain specificities, for example anti-A and anti-B, anti-K, -Fya and -Yta, occasionally bind complement. Sera containing Kidd antibodies usually bind complement, but recent data challenge the belief that IgG is implicated (Yates et al. 1996).
Anti-K
In one subject, Kk cells had a curvilinear slope of destruction. The initial rate had a T1/2 of less than 20 min, but by 1–2 h the T1/2 was more than 1 h. Surface counting showed that in the initial phase, destruction occurred mainly in the liver, and in the later phase mainly in the spleen (Hughes-Jones et al. 1957). When KK cells were injected the initial rate of clearance had a T1/2 of 6 min and destruction slowed about 20 min after injection (Figure 10.7). In a further case, about 80% of the cells were removed with an initial T1/2 of 6 min. After about 30 min, the T1/2 had lengthened to about 30 min (Cutbush and Mollison 1958).
Anti-Fya
One example was studied extensively: in the subject (RD) in whom anti-Fya was first identified, Fy (a+) cells showed a two-component curve of destruction. The initial rate of destruction had a T1/2 of 4 min but, after 15 min, by which time 90% of the cells had been cleared, destruction became very much slower (Cutbush and Mollison 1958). In tests in which Fy (a+) cells were sensitized in vitro with purified anti-Fya from RD, up to 90% of the cells were cleared with a T1/2 that could be as short as 2.5 min (Cutbush and Mollison 1958). Destruction slowed abruptly about 10 min after injection of the red cells (Figure 10.9; see also Figure 10.2). The results of quantitative tests are described in a later section.
Figure 10.9 Clearance due to complement-binding IgG antibody (anti-Fya). Red cells (ml) of two Fy (a+) donors were coated in vitro with different amounts of anti-Fya and returned to each donor’s circulation. The anti-Fya was a purified IgG fraction from a donor, RD (Mollison 1986).  , After a delay of about 1 min, clearance begins with an initial T1/2 of 8 min, but slows abruptly after about 10 min (Mollison 1962, case 6a; rate of clearance recalculated). •, After a delay of about 1.2 min, clearance begins with an initial T1/2 of 2 min, but slows abruptly after about 10 min (Mollison 1962, case 5; rate of clearance recalculated).
Anti-Jka and Anti-Jkb
In one case, JkaJka cells were cleared with a T1/2 of 4 min, 99% of cells being removed within 30 min of injection. In the same subject JkaJkb cells were cleared with a T1/2 of about 80 min and no slowing was observed during the 60 min after injection for which survival was followed (Cutbush and Mollison 1958). In two other cases, substantially slower destruction was observed: for an example of anti-Jka, cells were cleared with a T1/2 of 75 min (Fudenberg and Allen 1957), and for an example of anti-Jkb, destruction also appeared to be described by a single exponential, with 90% of the cells being cleared in a period of 24 h (Howard et al. 1982). The exponential slopes sometimes associated with destruction by anti-Jka may be explained by the recent observation that, apparently, only IgM (and not IgG) Kidd antibodies bind complement (Yates et al. 1996).
In one unusual case, in which anti-Jka could be detected only by the manual polybrene test, destruction was rapid and more than 50% of the 51Cr was found in the plasma within 1 h (Maynard et al. 1988).
Anti-Yta
In a patient with a complement-binding IgG example of this antibody, approximately 85% of Yt (a+) cells were cleared within 12 min, the remainder being cleared much more slowly (Bettigole et al. 1968).
Acquired Resistance to Complement-Mediated Destruction
In almost all the curves of destruction described above, owing to complement-binding antibodies, whether IgM or IgG, a common pattern emerges: destruction is initially rapid, with a T1/2 of a few minutes indicating hepatic destruction, but after an interval which may be as short as 5 min or as long as 60 min (most commonly about 10 min) destruction slows abruptly. The slowing of destruction appears to result from cleavage of C3b, leaving on the red cell surface C3d,g which does not mediate red cell destruction through receptor-mediated macrophage uptake.
Acquired resistance of red cells to destruction by alloantibodies was described by Möller in mice (Möller 1964). The effect could be produced both in vitro and in vivo and depended on specific antibody and on some host factor, subsequently identified as complement. A similar effect was demonstrated in CHAD by Evans and co-workers (1967, 1968), who described the mechanism of resistance to complement-mediated lysis by cold agglutinins. Transfused red cells underwent rapid destruction initially but, within an hour, destruction slowed and the remaining cells were destroyed far more slowly. Donor red cells could be rendered relatively resistant to destruction by exposure to CHAD serum in vitro. Resistance to destruction was associated with the accumulation of complement on the red cell membrane. Similar observations were reported by Engelfriet and co-workers (1972) who discussed the possibility that the accumulation of α2D (C3dg) on the red cell membrane might block the attachment of further C3 molecules (Jaffe et al. 1976).
Further work confirmed that the presence of functionally active C3 on the red cells was essential for hepatic sequestration and that cells coated with C3d (or C3dg) alone were not cleared from the circulation. The active forms of C3, C3b and iC3b have specific receptors on phagocytic cells (Nicholson-Weller et al. 1982). The inactive product, found on the red cells of patients with CHAD, is C3dg (Lachmann et al. 1982). Acquired resistance of transfused ABO-incompatible red cells to destruction was strongly suggested by observations published by Akeroyd and O’Brien (1958). After the transfusion of group AB cells to a group A patient, some surviving cells could be demonstrated after 6 weeks, even although the recipient’s serum contained an anti-B lysin. When a new sample of AB cells was injected, 90% of the cells were removed from the circulation within 45 min.
Acquired resistance to destruction suggests the presence on the red cells of C3dg around the sites of antibody attachment. Chaplin and co-workers (1983) have shown that 85–95% of bound C3d disappears from circulating red cells in 5–8 days. Red cell destruction that depends on complement activation should be able to continue, although at a greatly reduced rate. The slowing of the rate of destruction, observed some 10 min after injection of red cells into the circulation, should be much less with IgG than with IgM antibodies, as IgG alone can mediate erythrophagocytosis, whereas IgM antibodies depend on complement activation. The difference between the effects produced by IgG and IgM complement-binding antibodies has been illustrated above. For example, with IgG anti-K, after the initial rapid phase of destruction, the subsequent phase (with KK cells) continued with a T1/2 of 30 min. In contrast, in destruction by IgM anti-P1, after the initial phase of rapid destruction the rate became too small to measure. For further examples, see Mollison (1989).
Sequestration and Release of Complement-Coated Red Cells
When red cells are sensitized in vitro with a complement-binding IgM antibody, or with complement alone, a proportion of the injected population is cleared rapidly but some or all of the red cells slowly return to the circulation. The initial disappearance is presumably mediated by attachment of the C3b- or iC3b-coated red cell to a macrophage. When iC3b is cleaved, leaving only C3dg on the red cell, the cell is released back into the circulation. This temporary trapping followed by the release of complement-coated red cells has been demonstrated in various experiments:
Rate of Cleavage of C3B in Vitro and in Vivo
Conversion of C3b to iC3b takes about 1 min in vitro. In blood, where cells express a cofactor, further cleavage of the molecule splits off C3c and leaves only C3dg on the cell surface with a T1/2 of about 20 min (see Chapter 3). This rate of cleavage is consistent with the observation that destruction of complement-coated red cells may slow within 5–10 min of their injection into the circulation (Mollison 1986). On the other hand, it does not agree well with the observation that the release of temporarily sequestered complement-coated red cells takes about 2–3 h. The reason for the discrepancy is unknown. Possibly, iC3b is less accessible when it is attached to CR3.
Role of IGM and of Complement in Producing Irreversible Sequestration
When incompatible red cells are injected into a subject with a complement-binding antibody that appears to be solely IgM, a portion of the red cells is rapidly cleared and these cells do not return to the circulation. On the other hand, when red cells are sensitized in vitro with an IgM complement-binding antibody, many of the cells that are initially sequestered later return to the circulation. Neither IgM antibody nor complement alone causes red cell destruction. Although C3b seems to be involved primarily in bringing about attachment to macrophages rather than in promoting ingestion, macrophages activated by a lymphokine show complement-dependent phagocytosis (Griffin and Mullinax 1985). The enhanced activity of macrophages in infection is mentioned in Chapter 3. The effect of IgM in phagocytosis seems to be either to enhance in some unspecified way complement-mediated cell removal or to bring about the binding of critical numbers of complement molecules.
Non-Complement-Binding IGM Antibodies: Serology Revisited
In previous editions of this book, several examples of destruction by IgM antibodies that seemed to be non-complement binding were described. Re-examination of the evidence has cast doubt on the interpretation of the data. The example of anti-M which produced rapid destruction of MM red cells should not have been described as non-complement binding, nor should the IgM fraction of the rabbit alloantibody anti-HgA (Mollison 1986). The examples of IgM Rh antibodies that were reported to effect red cell destruction were probably contaminated with an amount of IgG that was too small to be detected by immunoelectrophoresis, but sufficient when given intravenously to have caused the clearance of D-positive cells that was observed. In summary, no evidence is available that non-complement-binding IgM antibodies play a role in accelerated red cell destruction.
Non-Complement-Binding IGG Antibodies
Virtually all examples of IgG anti-D and most examples of IgG anti-K, anti-S and anti-Fya fail to bind complement. Antibodies of this kind bring about red cell destruction predominantly in the spleen (Jandl 1955; Mollison, 2nd edn; Hughes-Jones et al. 1957; Jandl and Greenberg 1957; Cutbush and Mollison 1958; Crome and Mollison 1964); Figure 10.10.
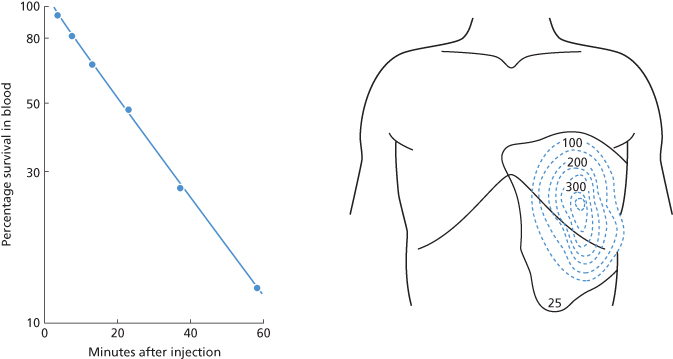
Figure 10.10 Destruction of 51Cr-labelled Kk red cells in a subject with non-complement-binding anti-K. The points are fitted by a single exponential with a T1/2 of 19 min. After the cells had been cleared from the circulation, surface counting showed that virtually all the 51Cr was localized in the area of the spleen.
(Source: Hughes-Jones et al. 1957 (case 3). Reproduced with permission of John Wiley & Sons Ltd.)
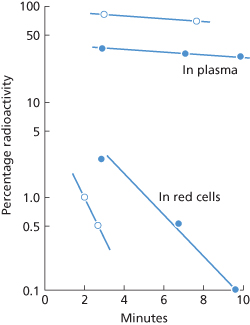
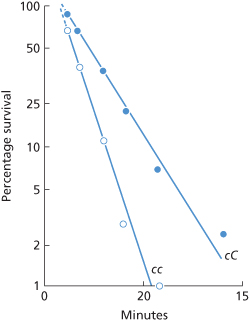
As discussed in a later section, with most of the antibodies mentioned above, the small numbers of corresponding antigen sites limit the number of molecules of IgG bound per cell to about 25 000 or fewer. On the other hand, with anti-c, owing to the greater number of c sites, a theoretical maximum of about 80 000 molecules of anti-c per red cell can be bound. In retrospect, this fact probably explains the relatively rapid clearance of c-positive red cells in a subject whose serum contained both IgM and IgG anti-c. In this subject, cc red cells were cleared with a T1/2 of 2.8 min, indicating clearance of 70% of the blood at a single passage through the liver (Figure 10.11), a finding originally believed to indicate clearance by IgM anti-c (Cutbush and Mollison 1958). The subsequent recognition that the serum also contained relatively potent IgG anti-c, and the finding that c sites were more abundant than D sites, led to the re-interpretation of the data (Mollison 1989). The number of anti-c molecules bound per cell has been estimated as approximately 57 000 (NC Hughes-Jones, personal communication). The degree of coating with IgG needed to produce complete clearance of coated red cells at a single passage through the spleen and the degree needed to produce some clearance by the liver are discussed below.
Figure 10.11 Clearance of c-positive red cells in a subject whose serum contained both IgG and IgM anti-c. cc cells ( ) were cleared with a T1/2 of 2.8 min, and cC cells (•) with a T1/2 of 5.6 min.
(Source: Cutbush and Mollison 1958. Reproduced with permission of John Wiley & Sons Ltd.)
The fact that red cells coated with anti-D are removed from the circulation predominantly in the spleen can be turned to advantage. Clearance of antibody-coated red cells has been used as a functional diagnostic assay in several circumstances. First, scanning with a gamma camera following the injection of radiolabelled D-sensitized red cells can be used to locate aberrant splenic tissue. Second, the presence of a splenunculus (accessory spleen), as in a patient with hereditary spherocytosis who relapses following splenectomy, can be demonstrated (MacKenzie et al. 1962). Third, estimation of the rate of clearance of D-positive red cells coated with an amount of anti-D that would normally be cleared in a single passage through the spleen can be used to determine whether splenic size or splenic blood flow are abnormal. For example, in a patient with hereditary spherocytosis with a spleen later shown at operation to weigh 395 g, D-sensitized red cells were cleared with a T1/2 of just over 8 min compared with the normal T1/2 of about 18–22 min (Mollison 1970). In a second example, a subject with a normal-sized spleen that was suspected to have been damaged at a previous operation cleared D-sensitized red cells with a T1/2 of 60 min, strongly suggesting that the spleen was infarcted and had a much reduced blood flow. This finding was confirmed at operation (Mollison 1979, p. 504). Finally, in subjects in whom the RES is partially blocked by immune complexes, as in lupus erythematosus, clearance of D-sensitized red cells is much slower than in normal subjects (Frank et al. 1979). Similarly, in adults with AITP injected with 1–1.5 g of IgG/kg body weight, the rate of clearance of D-sensitized red cells was slowed (Fehr et al. 1982).
In splenectomized subjects, D-positive red cells coated with an amount of anti-D sufficient to bring about maximal clearance in a subject with a spleen are cleared with a T1/2 of about 5 h (Jandl and Greenberg 1957; Crome and Mollison 1964; Brown 1983). When red cells are more heavily coated with anti-D, removal with a T1/2 as short as 90–160 min may reflect a component of hepatic sequestration (Crome and Mollison 1964; Brown 1983). Hepatic destruction of red cells carrying only moderate amounts of IgG is partially inhibited by plasma IgG blockage of Fc receptors on the macrophages. On the other hand, when the number of IgG molecules bound to red cells exceeds a certain value, which differs for IgG1 and IgG3, plasma IgG becomes a much less efficient blocker of receptor sites (Engelfriet et al. 1981).
Naturally Occurring RH Antibodies
The survival of small volumes of incompatible red cells has been studied in a few subjects with naturally occurring anti-E or anti-D; although, in the past, naturally occurring Rh antibodies have been assumed to be solely IgM, recent investigations using more sensitive tests indicate that most if not all antibodies are partly IgG.
kAnti-E
Anti-E is the most common naturally occurring Rh antibody, but its effect on the survival of E-positive red cells has been studied in very few cases. In the subject described by Vogt and co-workers (1958) the survival curve had an interesting shape, about one-quarter of the cells being cleared with a T1/2 of 20 min and the rest with a T1/2 of several hours. This example of anti-E may well be alloimmune, rather than ‘naturally occurring’, as the subject had received transfusions of E-positive blood 52 and 41 days before the test was carried out. On the other hand, in the series described by Jensen and co-workers (1965), one subject who had not been transfused previously exhibited survival of E-positive red cells that was only slightly subnormal (T50Cr 19.5 days).
In a small series studied by Contreras and co-workers (1987), survival was normal in one case but was reduced in two others. In one of these cases, approximately two-thirds of the cells were removed with a T1/2 of a few hours and the rest with a T1/2 of almost 5 days. In the other, 25% of cells were cleared in 24 h. The antibodies were at least partly IgG.
Anti-D
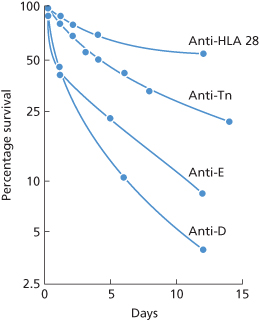
As described in Chapter 5, the kind of naturally occurring anti-D found on screening in the autoanalyzer and by no other method is IgG and cold reacting. In one subject with an antibody of this kind, T50Cr was 19 days, only slightly reduced (Perrault and Högman 1972). Strictly normal survival was found in one case by Lee and co-workers (1984). In another series of three examples of naturally occurring anti-D in males, survival was virtually normal in one but greatly reduced in the remaining two. In one of these, about 75% of the cells were removed with a T1/2 of a few hours, the remainder with a T1/2 of approximately 6 days. In the remaining case, all the cells were removed with a T1/2 of 2 h (Contreras et al. 1987). In summary, normal or almost normal red cell survival has been found in some subjects with naturally occurring anti-E or anti-D, but definitely reduced survival has been found in others. A puzzling feature of these latter cases has been the two component curves of survival, with slowing occurring as a rule some hours after injection of red cells into the circulation (Figure 10.12).
Figure 10.12 Curves with more than one component, associated with destruction by antibodies believed to be non-complement activating. Anti-HLA-28, survival of red cells on which HLA-28 was very strongly expressed, in a patient whose serum contained anti-HLA-28 (Nordhagen and Aas 1978). Anti-Tn, survival of red cells from a patient with Tn transformation in a normal subject, i.e. with anti-Tn (Myllyla et al. 1971). Anti-E and anti-D, survival of E-positive and D-positive red cells, respectively, in subjects whose serum contained naturally occurring anti-E and anti-D.
(Source: Contreras et al. 1987. Reproduced with permission of John Wiley & Sons Ltd.)
Destruction by Non-Complement-Binding IGG Antibodies of Other Specificities
Observations on the rate of clearance of test doses of incompatible red cells, produced by alloantibodies of many other specificities, have been published. The following list is far from complete: Ata, Jra, Oka (Chapter 6); Cob (Dzik and Blank 1986); Cra, IFC (Chapter 6); Doa (Polesky and Swanson 1966); Dob (Shirey et al. 1998); HLA (van der Hart et al. 1974; Nordhagen and Aas 1978; Panzer et al. 1984); Hy (see Chapter 6); Ina (Badakere et al. 1980); Inb (Ferguson and Gaal 1988; Lan (Clancey et al. 1972; Lampe et al. 1979); Lub (Cutbush and Mollison 1958; Peters et al. 1978); Lu6 (Issitt et al. 1990); LWb (Sistonen et al. 1981); M, Mia (Cutbush and Mollison 1958); N (Ballas et al. 1985); S,s (Fudenberg and Allen 1957); Sc3 (see Chapter 6); Wra (Cutbush and Mollison 1958); Yta (Gobel et al. 1974; Ballas and Sherwood 1977; Silvergleid et al. 1978; Davey and Simpkins 1981).
Perhaps special note should be made of antibodies to HLA antigens that are found on red cells. Anti-HLA-A2 and -HLA-B7 antigens, corresponding to Bg(c) and Bg(a) antigens have been associated with haemolytic transfusion reactions (Benson et al. 2003; Takeuchi et al. 2005).
Non-Destructive IGG Antibodies
Antibodies not expected to cause red cell destruction are: (1) those that are active only at temperatures below 37°C; (2) those that are active at 37°C, but are solely IgM and do not bind complement; and (3) those that are IgG, but are confined to subclasses IgG4 or IgG2 (but see Chapter 12) or are IgG1 often, but not always, present in low concentration (Garratty and Nance 1990). As in most cases, IgG subclass has not been determined, and often cannot be determined because of the low antibody concentration; this characteristic is rarely helpful in determining whether a particular IgG antibody will, or will not, cause red cell destruction.
Examples of antibodies of the following specificities, although active in vitro at 37°C, and although shown to be, or presumed to be, IgG, have failed to bring about the destruction of small doses of incompatible red cells: Ch (Moore et al. 1975; Tilley et al. 1977; Silvergleid et al. 1978); Csa (Shore and Steane 1977); JMH (Sabo et al. 1978); K11 (Kelley et al. 1998); Kna, McCa (Silvergleid et al. 1978; Baldwin et al. 1985); Lua (Greendyke and Chorpenning 1962); LW (Tregellas et al. 1978; Cummings et al. 1984; Chaplin et al. 1985); Xga (Sausais et al. 1964); Yka (Tilley et al. 1977; Lau et al. 1994); Yta (Dobbs et al. 1968; Mollison 1983, p. 428). However, as these reports are often of single examples, these antibodies should still be respected when selecting blood for transfusion unless rare antigen-negative red cells are not available.
Relation Between Results of Cellular Bioassays and Destruction in Vivo
On the whole, good correlation has been found between the results of monocyte or macrophage monolayer tests and evidence of destruction in vivo. In the first series to be described, 25 antibodies (anti-Yta, -Jrd, -Ch, -JMH, etc.) that had failed to cause haemolytic transfusion reactions or haemolytic disease of the newborn resulted in low values in the assay, whereas two that had caused either a haemolytic transfusion reaction or had rapidly destroyed 51Cr-labelled red cells yielded high values (Schanfield et al. 1981). In another series, six antibodies (all anti-Yta, -Ge or -Lan) that had not caused haemolytic reactions after the transfusion of incompatible red cells or (in two cases) had not rapidly destroyed 51Cr-labelled red cells gave a negative monocyte monolayer assay, whereas five antibodies (anti-Yta, -Ge or -Lan) that had rapidly destroyed labelled red cells gave positive results. Two of these five were anti-Lan, and these yielded positive results only when fresh serum was used for the assay (Nance et al. 1987).
In one series, four patients with anti-McCa, -JMH or -Hya had negative macrophage assays but destroyed incompatible red cells at an accelerated rate in a short-term survival assay. The survival rate of labelled cells was 89–95% at 1 h, but the authors argued that the T50Cr of 12–15 days indicated that the risk of haemolysis was best estimated by this longer study (Baldwin et al. 1985). However, these long-term cell survival data are unreliable as evidence of antibody-mediated destruction, as some patients had chronic bleeding and others were transfused during the study period.
In patients with anti-Yta in whom the antibody had first been detected less than 6 weeks previously, the MMA was positive (more than 3% reactive monocytes) in 24 out of 30; of eight who were transfused with Yt (a+) blood, three with a negative MMA had no adverse events; of five with a positive MMA, two had a mild delayed haemolytic transfusion reaction (DHTR). A positive MMA was significantly less common (6 out of 33) in patients in whom anti-Yta had been detected more than 6 weeks previously. Of 10 of these who were transfused with Yt(a+) blood, the only patient with a positive MMA had a mild DHTR (Eckrich et al. 1995).
In addition to these relatively extensive studies, numerous single cases have been reported: an example of anti-Cra that brought about more than 40% destruction of a small volume of incompatible red cells in 4 h gave a clearly positive result in a monocyte monolayer test (McSwain and Robins 1988); on the other hand, an example of anti-Lu12, which destroyed 50% of a small dose of incompatible red cells in vivo, did not react in a mononuclear assay (Shirey et al. 1988). In a patient who had formed an antibody against the Cromer-related antigen Tca, the survival at 24 h of a test dose of incompatible red cells was within normal limits and an MMA was normal at a time when the antibody was a mixture of IgG2 and IgG4. Some years previously, the antibody had also been partly IgG1, and an MMA had been well above normal limits (Anderson et al. 1991).
Using a test for monocyte phagocytosis (see Chapter 3), a negative result was obtained with an example of an IgG1 monoclonal anti-D that failed to destroy D-positive red cells in vivo (Crawford et al. 1988); and using a test for adherence to, and phagocytosis by, monocytes and an ADCC(M) assay (see Chapter 3), positive results were obtained with two monoclonal anti-Ds, one IgG1 and one IgG3 (Wiener et al. 1988) that were subsequently shown to produce accelerated clearance of D-positive red cells in vivo (Thomson et al. 1990). The same two monoclonal antibodies yielded moderately strong results when tested ‘blind’ in a number of bioassays with monocytes, although they gave only weak reactions in an ADCC(M) assay (Report from 9 Collaborating Laboratories 1991). In an analysis of 20 years of data correlating the MMA with clinical outcomes, Garratty concludes that a negative MMA (< or =5%) indicates that incompatible blood can be given without risk of an overt HTR but does not guarantee normal long-term survival of those red cells (Arndt and Garratty 2004). Limited data with a chemiluminescence assay suggest that results are similar to those with MMA (Hadley et al. 1999).
Effect of Antigen Content of Red Cells
Earlier sections have provided several examples of differences in the rate of destruction of two samples of red cells, depending on their membrane antigen content. The purpose of this section is to bring these observations together and to add a few additional ones.
Subgroups of A
The injection of 30–40 ml of A1 blood to group O recipients produced haemoglobinaemia, and in 3 out of 5 cases, clinical reactions, whereas the same amount of A2 blood produced neither haemoglobinaemia nor reactions (Wiener et al. 1953). Further evidence of the relative resistance of A2 cells is provided by cases in which an A2 or A2B recipient is transfused with A1 or A1B blood and then with group O blood containing potent anti-A. The A1 or A1B red cells are destroyed preferentially.
Although red cells with a weak A antigen are relatively resistant to damage by anti-A, a haemolytic reaction following the transfusion of AX blood has been reported in a patient whose serum contained potent anti-A. The pre-transfusion titre was 1000 vs. A1 cells and 8 vs. AX cells (Schmidt et al. 1959).
B Red Cells in Newborn Infants
Although the A and B antigens are considerably weaker in newborn infants than in adults, in experiments in which 1 ml of group B cord red cells was injected into group A mothers whose anti-B titre never exceeded 32, all of the red cells were destroyed within 20 min and usually within 5 min, mainly via intravascular lysis (Sieg et al. 1970).
Differences in the P1 and Lewis Antigens
Differences in the serological ‘strength’ of P1 antigen in different P1-positive blood samples correlate with the degree of red cell destruction in vivo. For example, in a patient whose serum contained a strong anti-P1, 49% and 51% of the red cells of one P1-positive donor were destroyed on two different occasions. In between these two tests, the red cells of another P1-positive donor, whose red cells reacted more strongly in vitro, were injected and 60% were destroyed rapidly in vivo (PL Mollison, personal communication). Similarly, in a patient whose serum contained anti-Lea, the red cells of adult donors of the phenotype Le(a+ b–) were removed with a T1/2 of approximately 2 min, whereas those of infant donors of the phenotype Le(a+ b+) were removed with a T1/2 of 3–5 min (Cutbush et al. 1956).
Differences Between Red Cells from Homozygotes and Heterozygotes
An example of the slightly more rapid destruction of cc red cells compared with Cc by anti-c is shown in Figure 10.11 and a similar difference between the rate of destruction of KK and Kk cells by anti-K is shown in Figure 10.7. Considerably more rapid destruction of JkaJka red cells than of JkaJkb cells by anti-Jka and a large difference between the rate of destruction of MM and MN cells has also been described (Cutbush and Mollison 1958).
Survival Curves with More Than One Component
As discussed above, acquired resistance to complement-mediated destruction seems to be the commonest cause of survival curves with two components. There are only a few examples of two-component survival curves that seem not to be due to acquired resistance to complement-mediated destruction:
Related posts:
 Immunology of leucocytes, platelets and plasma components
 Red cell antibodies against self-antigens, bound antigens and induced antigens
 ABO, H, LE, P1PK, GLOB, I and FORS blood group systems
 Alternatives to allogeneic transfusion
 The transfusion of platelets, leucocytes, haematopoietic progenitor cells and plasma components
Stay updated, free articles. Join our Telegram channel

Full access? Get Clinical Tree


