Highlights
- •
Real-world study of US adults with la/mUC receiving first-line therapy.
- •
Most received platinum-based chemotherapy (48.2%) or PD-1/L1 inhibitor (35.5%).
- •
All first-line therapies had short survival, high health care resource utilization/costs.
- •
Higher costs and shorter survival with PD-1/L1 inhibitor vs platinum-based therapy.
- •
More effective therapies are needed to prolong survival and reduce economic burden.
Abstract
Background
Given the changing treatment landscape for locally advanced or metastatic urothelial carcinoma (la/mUC), this study aimed to describe real-world treatments, overall survival (OS), health care resource utilization (HCRU), and costs among US patients with la/mUC receiving first-line therapy.
Methods
This retrospective study was conducted using 100% Medicare claims data (2015–2020). Patients with la/mUC were selected; initiation of first-line therapy was the index date. Treatments and OS were assessed during follow-up (index date to the earliest of end of data availability, health plan coverage, or death). All-cause HCRU and costs (2021 USD) were assessed during the first-line treatment period (index date to the earliest of first-line discontinuation, switch to second-line therapy, end of follow-up, or death). Outpatient pharmacy costs were not included. All-cause OS from start of first-line therapy was estimated using the Kaplan–Meier approach. The HCRU, cost, and OS analyses were stratified by 3 index treatment groups—platinum-based chemotherapy, non–platinum-based chemotherapy, and programmed cell death protein 1/ligand 1 (PD-1/L1) inhibitor monotherapy—and adjusted for baseline characteristics.
Results
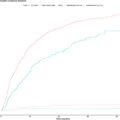
Of 9,939 patients included, 77.1% were men and mean age was 76 years. In total, 5,050 (50.8%) received platinum-based chemotherapy, 1,361 (13.7%) received non–platinum-based chemotherapy, and 3,242 (32.6%) received PD-1/L1 inhibitor monotherapy for first-line la/mUC. Median OS was 12.9, 12.9 ( P = 0.960), and 9.0 months ( P < 0.001) with platinum-based chemotherapy (reference), non–platinum-based chemotherapy, and PD-1/L1 inhibitor monotherapy, respectively. Most (> 99%) patients had ≥ 1 outpatient visit during the treatment period; mean number of visits per patient was 13.1 with platinum-based chemotherapy, 10.5 with non–platinum-based chemotherapy, and 18.3 with PD-1/L1 inhibitor monotherapy. In general, HCRU was significantly lower for patients receiving PD-1/L1 inhibitor monotherapy versus platinum-based chemotherapy. However, costs were significantly higher with PD-1/L1 inhibitor monotherapy versus platinum-based chemotherapy. Mean total monthly cost per patient was $10,285 for platinum-based chemotherapy, $8,982 for non–platinum-based chemotherapy, and $18,147 for PD-1/L1 inhibitor monotherapy.
Conclusions
From 2015 to 2020, patients with la/mUC had substantial HCRU and costs and short survival, regardless of first-line treatment. More effective therapies were needed to prolong survival and reduce the economic burden of la/mUC.
1
Introduction
Bladder cancer was the sixth most common malignancy in the United States in 2022 [ ]. Median age at bladder cancer diagnosis is 73 years [ ], and most cases (≥ 90%) are urothelial carcinoma (UC) [ , ]. Locally advanced or metastatic UC (la/mUC) is generally incurable [ ]; the 5-year overall survival (OS) rate in the United States is approximately 8% [ ].
Historically, first-line systemic therapy for la/mUC has consisted of cisplatin-based chemotherapy for cisplatin-eligible patients and non–cisplatin-based chemotherapy regimens, such as carboplatin and gemcitabine, for cisplatin-ineligible patients [ ]. Few treatment options were available for patients with UC who were ineligible for platinum-based chemotherapy. After approval of programmed cell death protein 1/ligand 1 (PD-1/L1) inhibitors, the treatment landscape for la/mUC evolved dramatically [ ]. As of 2022, pembrolizumab and atezolizumab were recommended as first-line options for patients who are ineligible for cisplatin but have tumors with high expression of PD-L1 or who are ineligible for platinum-containing chemotherapy regardless of PD-L1 expression [ ]. However, clinical trials showed that the response rates with first-line PD-1/L1 inhibitors were generally less than 50%, leaving a high unmet need in this la/mUC population [ ]. Pembrolizumab in combination with enfortumab vedotin (EV) became the new standard of care for first-line treatment, regardless of cisplatin eligibility [ , ], based on the results of the EV-302 clinical trial [ , ]. Pembrolizumab + EV was approved in the United States as first-line treatment for la/mUC in December 2023 [ ].
Because several first-line treatment options were available for la/mUC prior to the approval of pembrolizumab + EV, historical real-world patterns of use and outcomes are of interest as data on treatment patterns and economic burden have yet to emerge post-pembrolizumab + EV approval. Furthermore, a gap exists in the literature regarding health care resource utilization (HCRU) and costs in this population, particularly those receiving Medicare. This study aimed to describe real-world treatments and survival rates from 2015 to 2020 (i.e., prior to pembrolizumab + EV approval) among Medicare patients with la/mUC who received first-line therapies and to characterize HCRU and costs in the United States.
2
Materials and methods
2.1
Study design and patient selection
This retrospective noninterventional study was conducted using data from the US Centers for Medicare and Medicaid Services 100% Medicare claims database (parts A, B, and D) from January 1, 2015 to December 31, 2020.
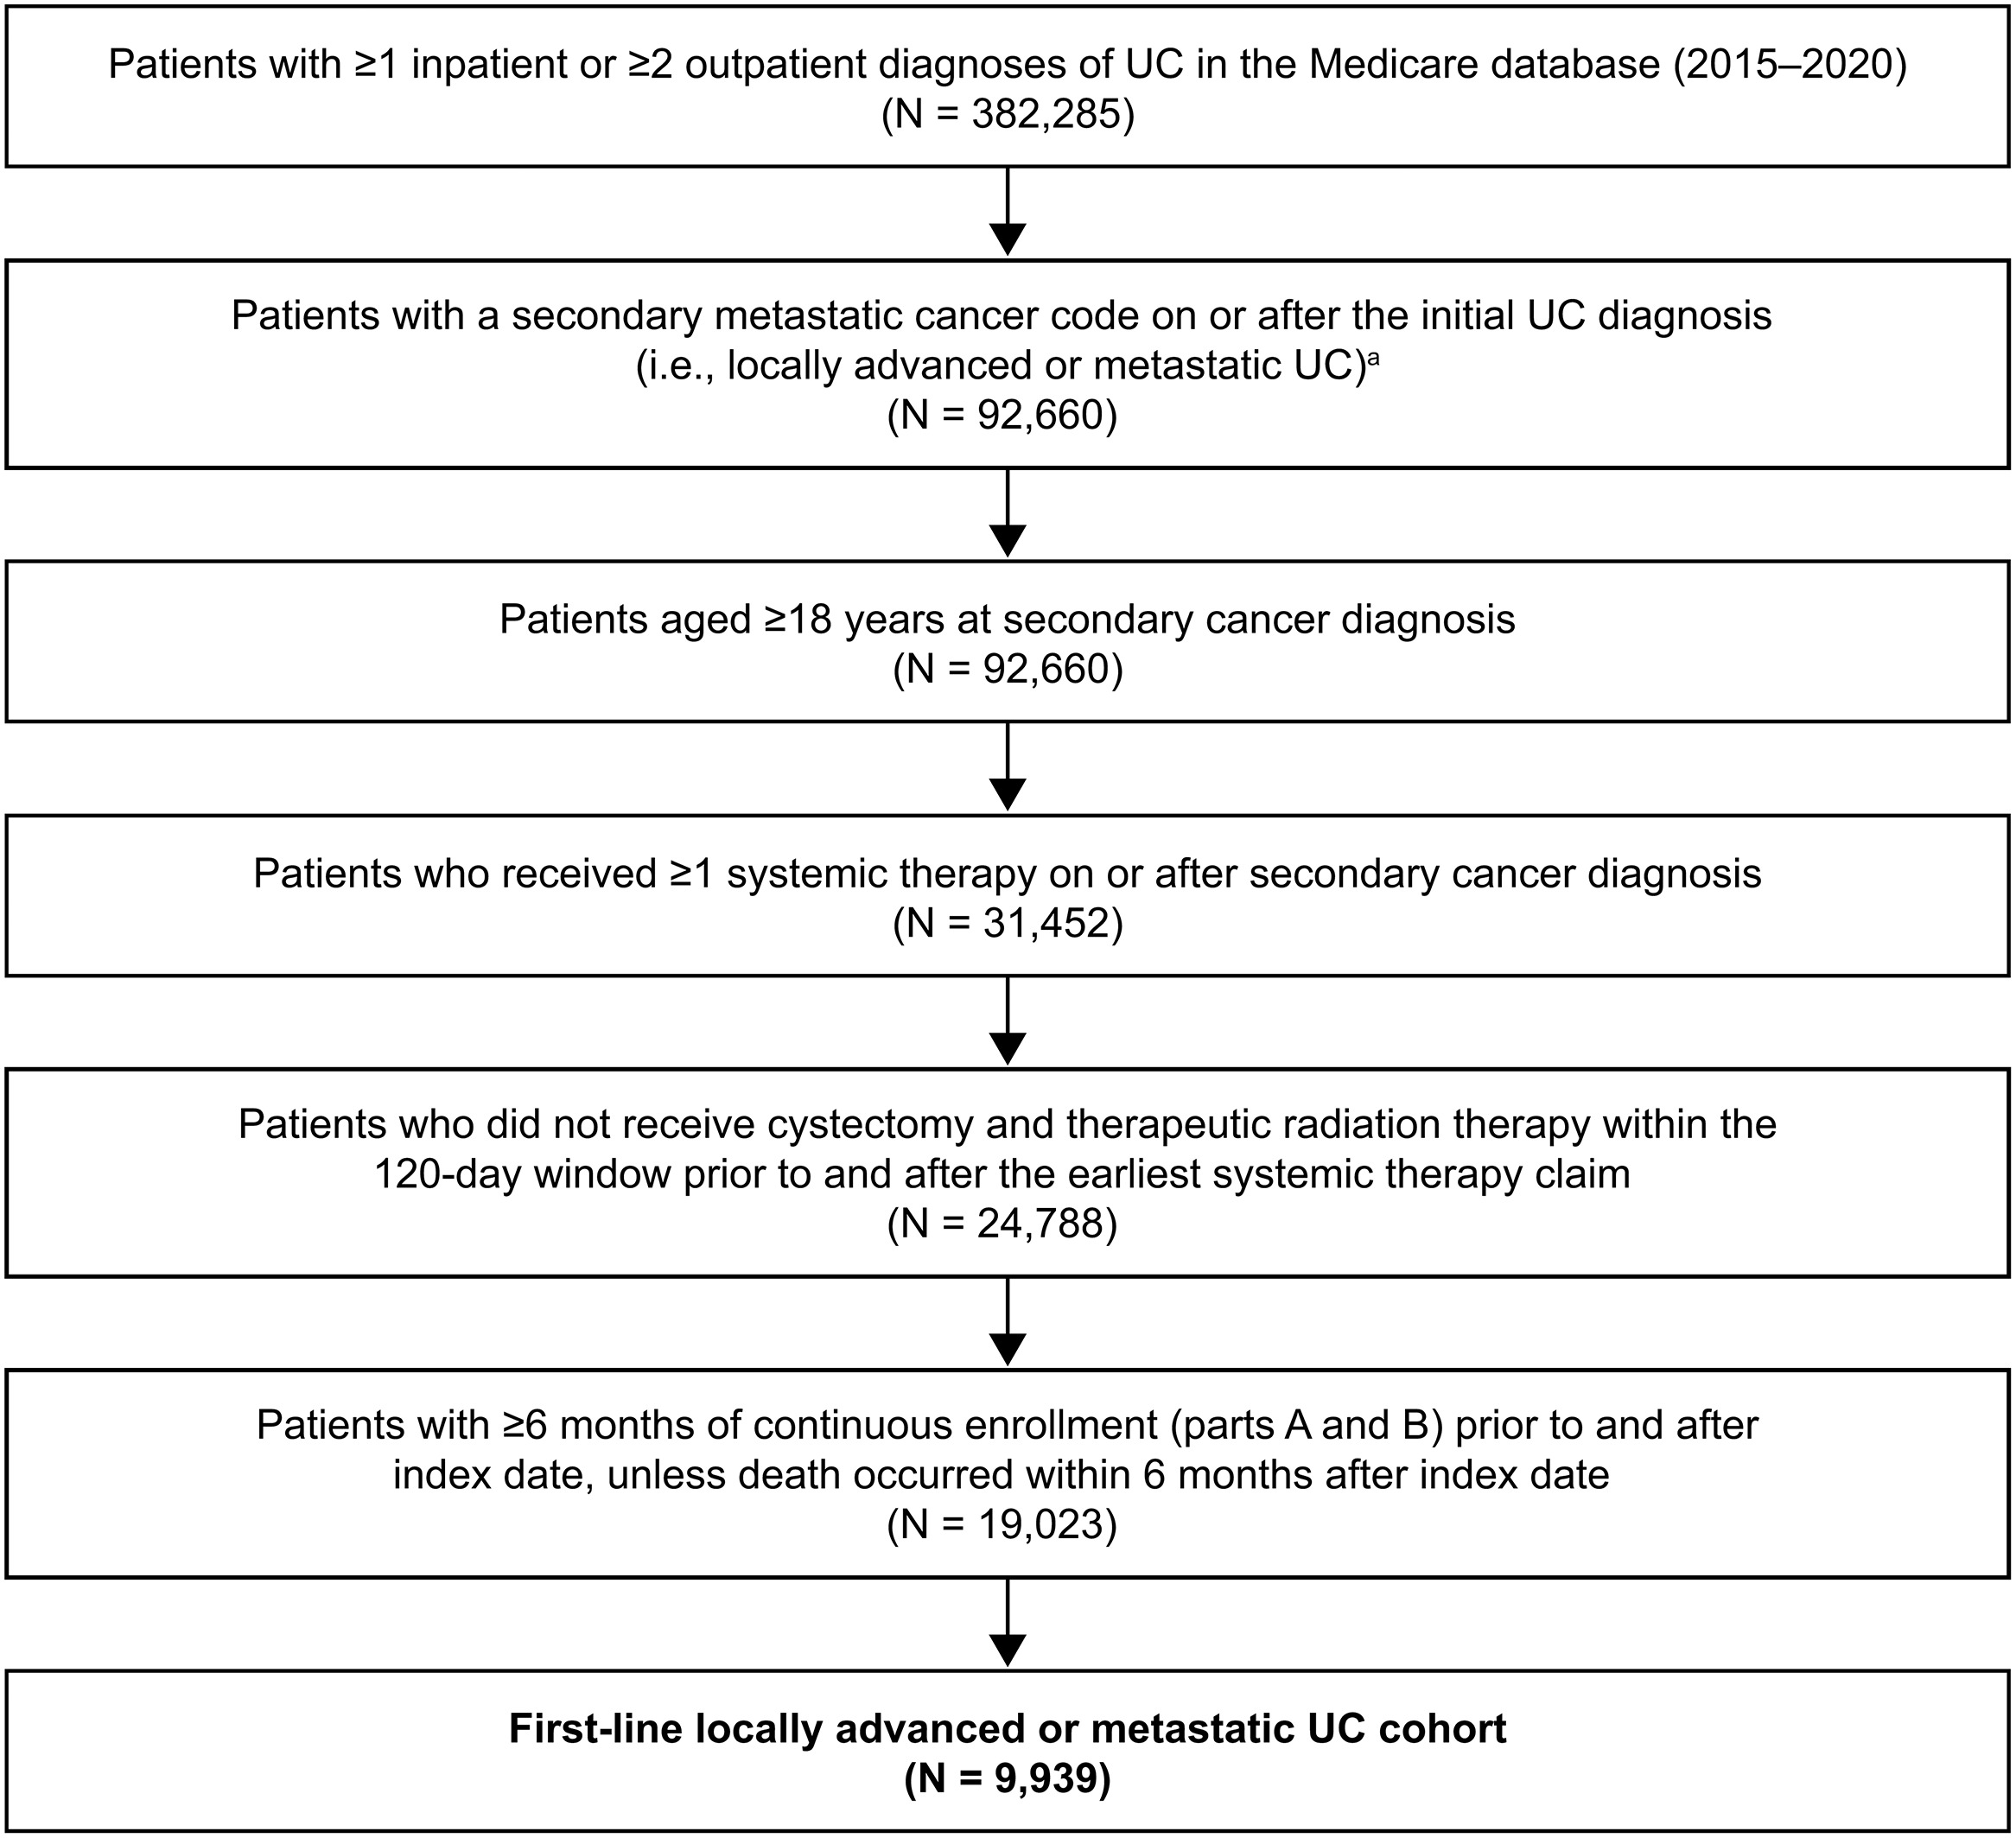
The la/mUC first-line cohort consisted of adult patients who received active systemic therapy after UC diagnosis. Patients had to have ≥ 1 inpatient or 2 outpatient UC diagnoses on different days plus a secondary cancer diagnosis code on or after initial UC diagnosis (Table A1) and to have received ≥ 1 systemic cancer treatment on or after a secondary cancer diagnosis (Table A2). Patients had to have ≥ 6 months of continuous enrollment in Medicare parts A and B before first-line therapy initiation (index date) and ≥ 6 months continuous enrollment after the index date unless death occurred ≤ 6 months after the index date.
Patients were excluded if they had ≥ 1 diagnoses of other invasive primary cancers (other than prostate cancer and melanoma) before secondary cancer diagnosis or had a medical claim associated with clinical trial participation ≤ 6 months of the index date (Table A1). Patients who received neoadjuvant or adjuvant therapy, i.e., cystectomy (Table A3) and/or radiotherapy (for > 14 days; Table A4) ≤ 120 days before or after initiating a first systemic therapy, were also excluded because these patients may have been receiving curative-intent treatment [ ].
The baseline period was the 6-month period preceding the index date . The follow-up period—defined as the time from index date to the earliest of end of data availability, end of health plan coverage, or death—was used to assess treatment regimens and OS. The first-line treatment period—defined as the time from index date to the earliest of first-line therapy discontinuation, date of switching to second-line therapy or basic supportive care, end of study follow-up, or death—was used to assess HCRU and costs associated with first-line therapy. Only time on treatment was included for HCRU and cost evaluation; any time between discontinuation and the initiation of a subsequent line was excluded.
2.2
Outcomes
Patient characteristics were assessed during the baseline period. These characteristics included demographics, National Cancer Institute Comorbidity Index composite score (a composite score of overall disease burden as a continuous variable) [ ], tumor location on initial UC diagnosis, certain specific comorbidities, and select prior surgeries. First-line treatment regimen at index date was captured and categorized into groups. The platinum-based chemotherapy group included cisplatin- or carboplatin-based chemotherapy as monotherapy or in combination with non–platinum-based chemotherapy and/or PD-1/L1 inhibitor therapy. Non–platinum-based chemotherapy included single-agent docetaxel, paclitaxel, gemcitabine, doxorubicin, methotrexate, vinblastine, ifosfamide, or erdafitinib. The PD-1/L1 inhibitor monotherapy group included single-agent atezolizumab, pembrolizumab, nivolumab, durvalumab, or avelumab.
All-cause HCRU included inpatient hospital admissions, intensive care unit (ICU) admissions, outpatient visits (including hospital outpatient and physician office visits), hospice care, and emergency department (ED) visits . For each care type, mean HCRU per patient was estimated for patients who had ≥ 1 visit and for the entire study population, including those not utilizing that care type. All-cause medical costs included costs for inpatient, ICU, outpatient, hospice, and ED visits/admissions. Outpatient pharmacy costs (Medicare Part D) were not included; this was expected to have limited impact on costs because almost all treatments for la/mUC are either infusions or injections, which are not covered by Medicare Part D. Costs were identified based on Medicare payments to providers, adjusted to 2021 US dollars using the change in the Consumer Price Index, and reported on a per patient per month (PPPM) basis to accommodate unequal follow-up periods between groups.
All-cause OS was defined as the time difference between the start of first-line therapy and the date of death. In the Medicare database, date of death is validated and documented in the enrollment file.
2.3
Statistical analysis
Baseline characteristics were summarized for the overall population and compared across first-line treatment groups using Wilcoxon rank-sum tests (continuous variables) and chi-square and Fisher exact tests (categoric variables).
For the OS analysis, patients were considered censored if still alive on the study end date. Kaplan–Meier curves and a log-rank test were used to compare OS across groups. In addition to the Kaplan–Meier analysis, hazard ratios (HRs) with their respective 95% confidence intervals (CIs) and P values were estimated across first-line treatment categories using Cox regression models, adjusting for baseline characteristics.
To compare HCRU across groups, adjusted incidence rate ratios (IRRs) with 95% CIs and P values were estimated using a generalized linear model with Poisson distribution, with follow-up time as an offset. Adjusted cost differences between groups with 95% CIs and P values were estimated using a generalized linear model with Tweedie distribution adjusting for baseline characteristics.
3
Results
3.1
Study population
A total of 92,660 patients with la/mUC were identified; 9,939 were included in the analysis ( Fig. 1 ). Of these, 5,050 (50.8%) patients received platinum-based chemotherapy, 1,361 (13.7%) received non–platinum-based chemotherapy, and 3,242 (32.6%) received PD-1/L1 inhibitor monotherapy. A total of 286 patients received other therapies not in the above groups and were not included in the OS analyses due to small sample sizes.
3.2
Baseline demographics and clinical characteristics
Overall, mean patient age was 76 years ( Table 1 ). Most patients were men (77.1%) and non-Hispanic White (87.9%). The bladder (90.3%) was the most common tumor location. The mean National Cancer Institute Comorbidity Index score was 0.9 (standard deviation [SD] = 0.7; interquartile range = 0.5, 1.3). The most common comorbidities were renal disease (39.2%) and chronic obstructive pulmonary disease (36.4%). In the 6-month baseline period, few patients underwent cystectomy (3.9%) and nephroureterectomy (2.4%), whereas 31.7% received prior radiotherapy and 10.8% received prior systemic therapy.
| Characteristic | Total (N = 9,939) | Platinum-Based Chemotherapy a (n = 5,050) | Non–platinum-Based Chemotherapy b ( n = 1,361) | PD-1/L1 Inhibitor Monotherapy c ( n = 3,242) |
|---|---|---|---|---|
| Age, mean ± SD, years | 75.9 ± 7.5 | 74.5 ± 7.0 | 77.3 ± 7.4 d | 77.6 ± 8.0 d |
| Male | 7,661 (77.1) | 3,852 (76.3) | 1,117 (82.1) d | 2,462 (75.9) |
| Race/ethnicity | ||||
| Non-Hispanic White | 8,736 (87.9) | 4,480 (88.7) | 1,183 (86.9) | 2,837 (87.5) |
| Black | 487 (4.9) | 232 (4.6) | 71 (5.2) | 163 (5.0) |
| Hispanic | 318 (3.2) | 146 (2.9) | 42 (3.1) | 115 (3.5) |
| Asian | 164 (1.7) | 75 (1.5) | 25 (1.8) | 55 (1.7) |
| Multiple/other | 95 (1.0) | 50 (1.0) | 18 (1.3) | 26 (0.8) |
| Unknown | 139 (1.4) | 67 (1.3) | 22 (1.6) | 46 (1.4) |
| Year of index date | ||||
| 2015 | 1,232 (12.4) | 898 (17.8) | 251 (18.4) | 24 (0.7) d |
| 2016 | 2,042 (20.5) | 1,310 (25.9) | 306 (22.5) d | 361 (11.1) d |
| 2017 | 1,818 (18.3) | 872 (17.3) | 219 (16.1) | 678 (20.9) d |
| 2018 | 1,965 (19.8) | 796 (15.8) | 194 (14.3) | 928 (28.6) d |
| 2019 | 1,867 (18.8) | 772 (15.3) | 260 (19.1) d | 793 (24.5) d |
| 2020 | 1,015 (10.2) | 402 (8.0) | 131 (9.6) d | 458 (14.1) d |
| Tumor location | ||||
| Bladder | 8,973 (90.3) | 4,608 (91.2) | 1,274 (93.6) d | 2,828 (87.2) d |
| Renal pelvis | 484 (4.9) | 200 (4.0) | 49 (3.6) | 224 (6.9) d |
| NCI Comorbidity Index score, mean ± SD e | 0.9 ± 0.7 | 0.9 ± 0.7 | 0.9 ± 0.7 | 1.0 ± 0.7 d |
| NCI comorbidity | ||||
| Renal disease | 3,893 (39.2) | 1,631 (32.3) | 531 (39.0) d | 1,619 (49.9) d |
| Chronic obstructive pulmonary disease | 3,621 (36.4) | 1,907 (37.8) | 424 (31.2) d | 1,192 (36.8) |
| Peripheral vascular disease | 3,090 (31.1) | 1,500 (29.7) | 389 (28.6) | 1,125 (34.7) d |
| Mild liver disease | 2,058 (20.7) | 1,082 (21.4) | 256 (18.8) d | 636 (19.6) d |
| Congestive heart failure | 1,714 (17.2) | 782 (15.5) | 255 (18.7) d | 640 (19.7) d |
| Cerebrovascular disease | 1,426 (14.3) | 696 (13.8) | 185 (13.6) | 508 (15.7) d |
| Prior surgery/therapy | ||||
| Cystectomy f | 385 (3.9) | 159 (3.1) | 36 (2.6) | 182 (5.6) d |
| Nephroureterectomy | 236 (2.4) | 141 (2.8) | 21 (1.5) d | 69 (2.1) |
| Radiotherapy f | 3,150 (31.7) | 1,497 (29.6) | 406 (29.8) | 1,181 (36.4) d |
| Systemic therapy | 1,075 (10.8) | 470 (9.3) | 152 (11.2) d | 426 (13.1) d |
| Provider specialty at index | ||||
| Hematology/oncology | 4,600 (46.3) | 2,473 (49.0) | 561 (41.2) d | 1,456 (44.9) d |
| Internal medicine | 3,116 (31.4) | 1,595 (31.6) | 303 (22.3) d | 1,140 (35.2) d |
| Medical oncology | 1,077 (10.8) | 574 (11.4) | 128 (9.4) d | 344 (10.6) |
| Urology | 338 (3.4) | 38 (0.8) | 240 (17.6) d | 26 (0.8) |
| Other | 490 (4.9) | 222 (4.4) | 95 (7.0) d | 159 (4.9) |
| Follow-up duration, mean ± SD, months | 15.0 ± 14.3 | 16.7 ± 15.3 | 15.4 ± 14.4 | 12.3 ± 12.3 |
Related posts:
 Optimal imaging techniques across the spectrum of testicular cancer
 Defining the genetic profile of prostate cancer
 Retrospective analysis of partial cystectomy in patients with muscle-invasive urothelial carcinoma: A German single-center experience
 Concomitant antihistamine administration is associated with improved survival outcomes in patients with locally advanced or metastatic urothelial carcinoma treated with atezolizumab. Analysis of individual participant data from IMvigor210 and IMvigor211
 Assessing the causal relationship between gut microbiota and prostate cancer: A two-sample Mendelian randomization study
 Integrated care among patients with kidney or urinary bladder cancer: An NCI patterns-of-care analysis
Stay updated, free articles. Join our Telegram channel

Full access? Get Clinical Tree


