(1)
Department of Radiology, Hacettepe University, Ankara, Turkey
Abstract
The use of radiological imaging in urological cancers is increasing with improvements in imaging technologies and implementation of these techniques to clinical scenarios. Ultrasonography, computed tomography, and magnetic resonance imaging have enormous potentials in the diagnosis, staging, and surveillance of urological cancers. Emerging imaging techniques enable morphologic assessment of urological cancers with high spatial and contrast resolution. Functional imaging techniques reveal microstructure of tumors which can be used in the diagnosis, prediction of prognosis, and assessment of response to treatment and surveillance of tumors. Biopsyless diagnosis may be possible in the future particularly for renal and prostate tumors. In this chapter, current status of urooncologic imaging will be reviewed.
Keywords
Urological cancersRadiologyImaging1.1 Introduction
Urological cancers constitute one of the most frequent encountered malignancies in urologic and oncologic practice. Imaging has a critical role in the diagnosis of urological tumors as well as staging and active surveillance. In addition to the morphologic and functional assessment of tumors, imaging techniques can be used to guide the interventional procedures including biopsy, preoperative embolization, or ablation providing palliative care or curative treatment. Optimal evaluation and treatment of urological cancers can be accomplished with appropriate use of imaging techniques for the diagnosis and staging of tumors, guidance for invasive procedures, and active surveillance of patients.
Ultrasonography (US) is usually the first preferred imaging technique in the diagnosis of urological cancers. As a noninvasive, inexpensive, easily accessible, and nonionizing radiation used imaging method, US can be used in patients as a first-step imaging technique in patients with suspected malignancy. US demonstrates solid and/or cystic content of the urological masses. Color-flow Doppler US (CDUS) can reveal blood flow within the mass. However grayscale US and CDUS have remarkable limitations in characterization of urological masses. Contrast-enhanced US (CEUS) can demonstrate the enhancement features of tumors which increase the likelihood of neoplastic nature of a mass and can be used in differentiation between benign and malignant urological masses. New emerging technologies promise increased capability for detection and characterization of urological cancers.
Computed tomography (CT) is the mainstay imaging technique utilized in radiologic assessment of renal, ureteral, and bladder cancers. With its multiplanar imaging capability acquired in a short scanning time, CT can demonstrate morphological imaging features, attenuation values, and contrast enhancement patterns of tumors. CT may be helpful to characterize urological cancers by comparison of density values of urological cancers represented by Hounsfield unit (HU) at unenhanced, early, and delayed phases after intravenous (IV) contrast administration.
Magnetic resonance imaging (MRI) is a problem-solving imaging technique in the radiologic assessment of urological cancers. Acquisition of multiple imaging sequences with high soft tissue contrast resolution assigns MRI as decision-making technique in difficult cases. Multiparametric MRI (mp-MRI) technique which consists of conventional MRI sequences such as T1-weighted (W), T2-W, dual-echo T1-W sequences combined with functional MRI sequences including diffusion-weighted imaging (DWI ) and dynamic contrast-enhanced MRI (DCE-MRI ) are being more increasingly used in detection and characterization of the urological cancers.
1.2 Renal Cancer
1.2.1 General Information
Renal cancers account for 3% of adult malignancies, occurring at a mean age of 65. Male predominance exists in renal cancers with a male to female ratio of 3:1 [1]. Renal cancers are more frequently detected at early stages due to frequent incidental presentation of renal tumors on cross-sectional imaging studies performed due to indications other than urological symptoms. The likelihood of malignancy is 80% in all solid renal lesions detected on imaging studies [2]. However 38% of renal lesions less than 1 cm are benign [3]. Detection of renal tumors on imaging studies necessitates differentiation between benign and malignant masses. In the setting of renal malignancy assessment of other kidney in terms of renal mass is mandatory since 5% of sporadic renal tumors present as bilateral multifocal renal masses [4, 5].
Best prognostic factors in renal cancers are grade and stage of the cancers determined with Fuhrman grading system and tumor-node-metastasis (TNM) staging system, respectively. Fuhrman grading system classifies renal carcinomas according to nuclear size and shape and the size of the nucleoli [1]. TNM staging system includes localization of renal cancers, extension of tumors to perirenal tissues, and metastatic involvement of lymph nodes and distant tissues and organs. Imaging techniques can determine the local and distant spread of renal cancers.
1.2.2 Imaging Techniques
1.2.2.1 Ultrasonography
Ultrasonography is helpful for initial screening of renal lesions as well as to discriminate cystic lesions from solid lesions and monitoring growth of previously determined lesion [6]. Renal cancers usually present as a focal, expansile mass with heterogeneous echogenicity different from adjacent hypoechoic renal parenchyma. Heterogeneous echogenicity and expansile nature of renal cancers are helpful in distinguishing renal cancers from pseudotumoral renal lesions such as column of Bertin and dromedary hump of the kidney . However detection of small renal cancers (<3 cm) confined in renal parenchyma without expansile appearance may be difficult with US especially if these cancers have isoechoic appearance similar to renal parenchyma. Renal cell carcinoma (RCC) as being most frequently encountered renal tumor usually manifests as hypo-, iso-, or hyperechoic expansile mass on US (Figs. 1.1 and 1.2).
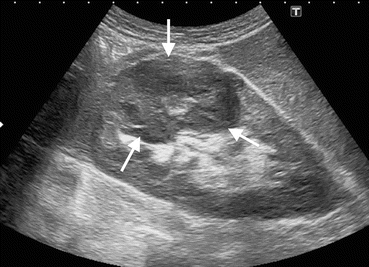
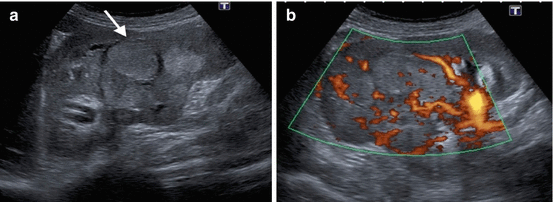

Fig. 1.1
Clear cell RCC. Grayscale US of a 78-year-old male demonstrates a hypoechoic expansile solid renal mass (arrows)

Fig. 1.2
Chromophobe RCC. (a) Grayscale US of a 56-year-old female with chromophobe RCC reveals multilobulated hyperechoic solid mass (arrow). (b) Power Doppler US demonstrates hypervascularity of the tumor
Small renal masses (<3 cm) may more likely present with hyperechoic appearance than larger tumors [7]. Papillary RCCs usually appear as hypoechoic or isoechoic and rarely hyperechoic solid masses (Fig. 1.3) [8]. However it is nearly impossible to differentiate subtypes of RCCs such as clear cell RCC , papillary RCC, and chromophobe RCC by US due to similar sonographic features of these tumors on grayscale US and CDUS. Generally, papillary cell types of RCCs have less vascularity compared to other types of RCCs on CDUS (Fig. 1.3). Renal lymphomas and metastases may manifest as multifocal infiltrative masses (Fig. 1.4). Renal pelvis tumors, most frequently as transitional cell carcinomas (TCCs), present with a hypoechoic appearance within the hyperechoic renal sinus (Fig. 1.5). However TCCs or other tumors localized in renal pelvis are usually more susceptible to be missed on US compared to renal parenchymal tumors.
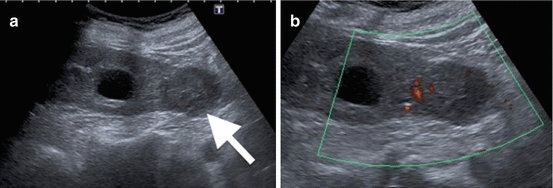
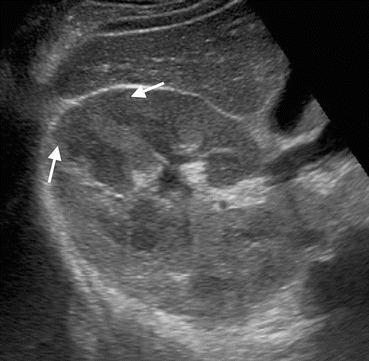
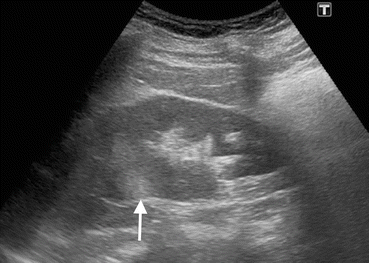

Fig. 1.3
Papillary cell RCC. (a) Grayscale US of a 66-year-old male with papillary RCC shows hypoechoic renal mass (arrow) arising from lower pole of the kidney and extending inferiorly. (b) Renal mass presents with low vascularity on power Doppler US

Fig. 1.4
Renal lymphoma. Grayscale US reveals multifocal hypoechoic infiltrative lesions (arrows) in the renal parenchyma representing lymphomatous involvement

Fig. 1.5
Renal TCC. Grayscale US of a 72-year-old female with TCC demonstrates a hypoechoic solid mass (arrow) in the renal pelvis replacing hyperechoic renal sinus fat in the upper pole of the kidney
Cystic renal masses detected on US should be elaborated in terms of malignancy. Sonographic features that increase the likelihood of malignancy in complex renal cysts include thickened cyst wall, numerous or thickened or nodular septations within the cyst, presence of irregular or central calcifications, and the presence of blood flow in the septations or cyst wall (Fig. 1.6) [9]. US can be an important complementary method by revealing cystic nature of hyperdense, solid-appearing renal lesions on CT and solid nature of lesions which appear as cystic mass on CT [10].
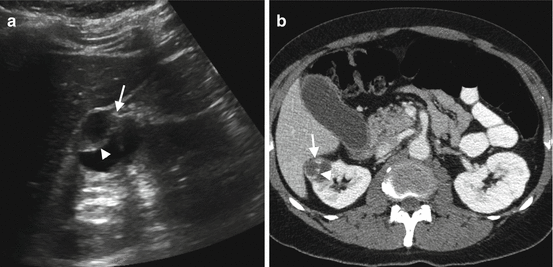

Fig. 1.6
Cystic RCC. (a) Grayscale US reveals cystic renal mass (arrow) containing thick septa (arrowhead). (b) Axial contrast-enhanced CT reveals cystic renal mass (arrow) in the right kidney with enhancing septa (arrowhead)
Contrast-enhanced US seems to be a promising imaging technique for distinguishing benign and malignant renal tumors. A meta-analysis study including 11 studies reported a pooled sensitivity of 88% and specificity of 80% in differentiation between benign and malignant renal tumors by CEUS [11].
Ultrasound elastography is an emerging technique based on measuring elasticity of biological tissues by calculating their response to manually applied force by US probe or propagating sound waves. Since malignant renal tumors are assumed to be stiffer than benign tumors, it has been suggested that US elastography can be used to differentiate benign and malignant renal tumors (Fig. 1.7). Although successful results imply the utility of US elastography in differentiation between benign and malignant renal tumors, determination of subtypes of renal tumors seems to be unpredictable by this technique [12].
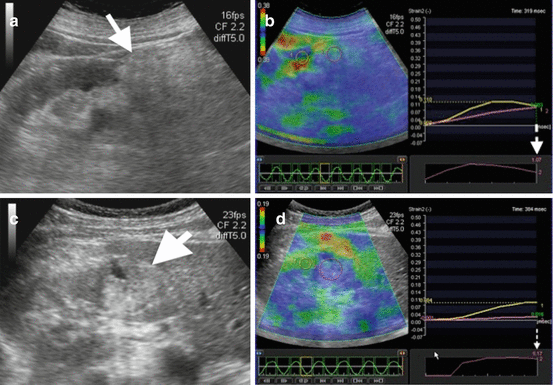

Fig. 1.7
Ultrasound elastography of renal masses. (a) Grayscale US image of a 48-year-old female demonstrates hyperechoic mass (arrow) representing angiomyolipoma. (b) Strain elastography of the mass depicts strain index value as 1.07 (dashed arrow) corresponding to benign renal mass. (c) Grayscale US image of a 55-year-old male with RCC reveals hyperechoic solid mass (arrow) in the kidney. (d) Strain elastography depicts strain index value of the mass as 5.17 (dashed arrow) representing increased stiffness and likelihood of malignancy of the mass
Assessment of renal vein involvement is mandatory in case of renal cancers. Renal veins should be visualized from renal hilum to inferior vena cava (IVC) on CDUS to detect hypo- or hyperechoic filling defect with solid appearance in renal vein representing tumoral thrombus. CDUS is comparable to MRI for detecting tumoral extension to renal veins and inferior vena cava with a sensitivity of 86% and specificity of 94% [13–15].
Main limitation of US in assessment of renal tumors is difficulty to detect and characterize small renal masses. One study showed that 42% of renal lesions between 15 and 20 mm were not detected on US while CT detected 100% of lesions [16]. User dependency which may cause interobserver variability in follow-up of lesions is another limitation of US.
Intraoperative US yields high-resolution images in partial nephrectomies and enucleation of tumors. Intraoperative US can demonstrate new findings which were not detected on preoperative imaging in 10.6% of cases and alters the surgical management in 71.4% of patients with renal cancers [17].
1.2.2.2 Computed Tomography
Computed tomography is the decision-making imaging technique in assessment of renal tumors. Awareness of sonographic imaging features of renal mass may be helpful for planning CT protocol since renal parenchymal or pelvis tumors should be scanned with different CT protocols. The use of intravenous (IV) iodinated contrast material and ionizing radiation in CT examination mandates appropriate planning of CT protocol. Multiphasic CT protocols used in the evaluation of renal mass include precontrast scanning and corticomedullary (scan delay 35–40 s after IV contrast injection), nephrographic (scan delay 70–90 s after IV contrast injection), and delayed excretory (scan delay 5–10 min after IV contrast injection) phases [18]. Precontrast images demonstrate calcifications in the renal masses and yield a baseline density measurement to compare enhancement degree and pattern of the tumors on contrast-enhanced images. Precontrast CT is also critical in depicting hypovascular hemorrhagic cysts which may be misdiagnosed on contrast-enhanced images as hypovascular papillary RCC [19]. In these cases, unenhanced CT demonstrates hyperdense appearance of hemorrhagic cysts secondary to high attenuation of the blood on CT and helps to realize pseudoenhancement of hemorrhagic cysts on contrast-enhanced CT images (Fig. 1.8). Corticomedullary images demonstrate lesion vascularity and renal vascular anatomy. Renal cortex enhances more than renal medulla in corticomedullary phase. Images acquired on this phase may help to distinguish hypervascular clear cell carcinoma from hypovascular papillary cell carcinoma [19]. However renal masses localized in renal medulla may be missed on corticomedullary phase images. In nephrographic phase renal parenchyma enhances homogeneously with similar enhancement in renal cortex and medulla. Renal tumors manifest as less enhancing solid or semisolid lesions compared to renal parenchyma (Fig. 1.9). This phase is the most helpful imaging phase for detection and characterization of renal masses [20]. Nephrographic phase images have superiority in detection especially small (<3 cm) renal masses in the renal parenchyma [18]. Excretory images are helpful to delineate renal collecting systems, ureters, and bladder with tumoral involvement of these structures (Fig. 1.9).
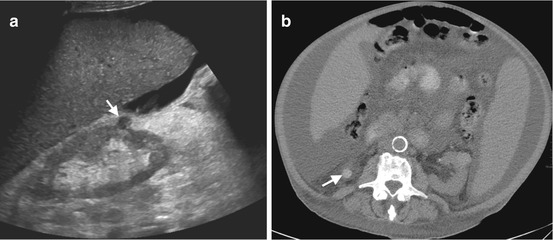
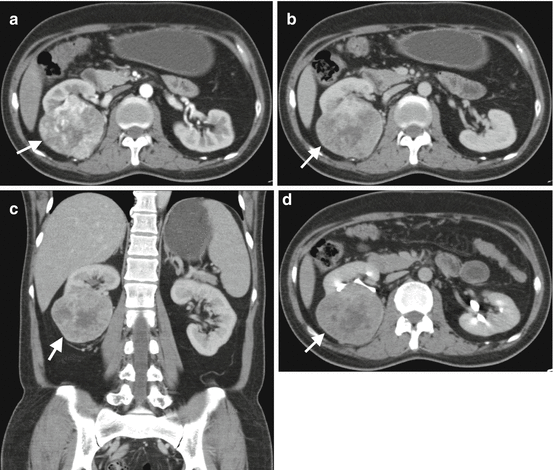

Fig. 1.8
Hemorrhagic cyst. (a) Grayscale US image of a 45-year-old female shows well-circumscribed hypoechoic cyst-like mass (arrow) located near the lower pole of the right kidney. The absence of posterior acoustic enhancement suggests probability of solid mass. (b) Precontrast axial CT image reveals hyperattenuation in the mass (arrow) representing hemorrhagic cyst

Fig. 1.9
Multiphasic CT of clear cell RCC . (a) Axial CT image obtained at corticomedullary phase reveals hypervascular solid mass (arrow) arising from the inferior pole of the right kidney. (b) Axial and (c) coronal CT images at nephrogram phase demonstrate solid mass (arrows) enhancing less than adjacent renal parenchyma. (d) Axial excretory phase CT image reveals splaying of inferior collecting system by the mass (arrow)
Malignant potential of a renal mass increases with presence of significant enhancement which is defined as an attenuation increase of at least 15–20 HU on postcontrast images with respect to the precontrast image [20]. Enhancement of a lesion up to 10 HU is defined as pseudoenhancement which may be encountered in some renal cysts. Enhancement of 10–20 HU in a renal mass on CT refers to indeterminate mass that necessitates assessment with MRI. Other scanning phases give additional valuable information for presurgical planning. Contrast enhancement characteristics of renal masses can be a distinguishing feature in prediction of subtypes of RCCs. Conventional type or clear cell type of RCC as being most frequently detected RCC subtype presents usually as well-circumscribed, heterogeneous mass containing usually two components as solid hypervascular portion and necrotic or hemorrhagic necrotic, avascular portion [21]. Typical clear cell RCC manifests with intense enhancement in the corticomedullary phase and less enhancement compared to renal parenchyma at nephrographic phase. Papillary RCCs were reported as homogeneously enhancing renal mass in comparison to renal parenchyma and other subtypes of RCC [22, 23]. A hypovascular solid renal mass without fat content usually suggests papillary RCC as 82% of the cases manifest with less than or equal to 40 HU enhancement [24].
Small renal lesions which are smaller than 10 mm constitute a challenge for both urooncologists and radiologists. Characterization of renal masses less than 1 centimeter is frequently difficult on CT [21]. If a renal parenchymal lesion appears hypodense compared with the renal cortex on precontrast CT images with the density values of <10 HU or <−20 HU regardless of density values after IV contrast administration, these lesions can be assumed to be a benign renal parenchymal lesion mostly renal cortical cyst and small angiomyolipoma, respectively [21]. When density measurement of small renal parenchymal lesions does not yield any informative value, these lesions can be defined as “indeterminate microlesion, with no suspect characteristics” and can be followed up with imaging [21].
Cystic renal masses detected on CT should be interrogated in terms of malignancy. Bosniak classification system is widely accepted as a reliable tool to define complicated cystic renal masses for likelihood of malignancy. Although Bosniak classification was firstly introduced as CT classification system, the classification scheme may also be applied to MRI [25]. According to Bosniak classification system, category I lesions refer to simple cysts. Category II lesions have smooth septa and minimal wall thickening. Category I and II lesions are benign lesions requiring no further workup. Category IIF lesions include well-marginated cysts with enhancing or nonenhancing multiple hairline-thin septa and nonenhancing high-attenuation renal lesions. These lesions are indeterminate moderately complicated cystic renal masses that require follow-up to demonstrate stability. Category III lesions have thickened wall or septa and include some imaging features suspicious of malignancy that may be managed surgically. The presence of solid component in cystic renal mass refers to Bosniak category IV lesion and indicates high suspicion for malignancy (Fig. 1.10). Category IV lesions are managed surgically. Pseudoenhancement which is characterized as increased density in the cyst wall or septa after IV contrast administration is a pitfall that can cause misdiagnosis of cystic renal malignancy. Pseudoenhancement of cystic renal masses results from volume averaging and beam-hardening effects on CT [22]. Smaller renal cysts tend to be more amenable to pseudoenhancement [26]. Hemorrhagic cysts can present with pseudoenhancement; however hyperdense appearance of hemorrhagic cysts on precontrast CT is characteristic for hemorrhagic cysts.
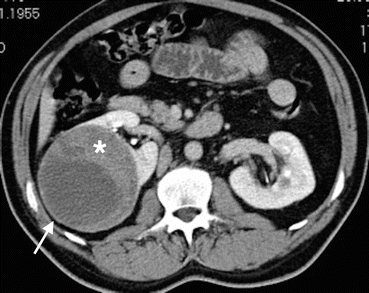

Fig. 1.10
Cystic RCC. Axial contrast-enhanced CT demonstrates cystic mass (arrow) with enhancing solid component (asterisk) classified as Bosniak category IV and surgically proved to be RCC
CT can easily identify macroscopic fat in renal masses. The diagnosis of angiomyolipoma can be established safely on CT when the density of a mass measured as <−20 HU with no content of calcification or necrosis [21]. However RCCs may rarely present with fat component. Fat content in a RCC mostly occurs in papillary cell type [27]. In the setting of fat-containing renal mass, the possibility of malignancy should be thought if a large, solid, infiltrating, and heterogeneous lesion is detected on CT. Calcifications may be encountered in 30% of RCCs which are typically central and irregular [21]. Invasion of the renal vein and inferior vena cava (IVC) occurs in 23% and 7% of RCCs, respectively [28] (Fig. 1.11).
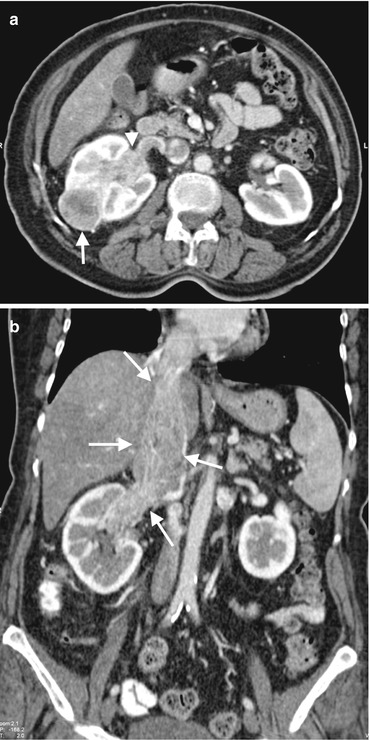

Fig. 1.11
RCC with venous invasion. (a) Axial contrast-enhanced CT of a 66-year-old female with RCC demonstrates a solid renal mass (arrow) in the interpolar region of the right kidney and invasion of the renal vein with tumor (arrowhead). (b) Coronal contrast-enhanced CT reveals tumoral invasion of the right renal vein and extension of the tumor thrombus to the right atrium through IVC (arrows)
RENAL nephrometry scoring system is a numerical scoring system of imaging features of renal mass on CT or MRI including maximal tumor radius, exophytic versus endophytic nature of the tumor, relationship of the tumor to the collecting system or sinus, location relative to polar lines, and anterior or posterior tumor location [20]. It was reported that RENAL nephrometry scoring system can be used as a predictor of surgical outcomes of laparoscopic partial nephrectomy and histology and grade of RCCs [29].
Dual-energy CT (DECT) is an evolving CT technology, which is characterized by simultaneous acquisition of CT data with two different energies or peak tube voltages [30]. In this technology different tissues in the organs can be separated by attenuation difference behavior at two different tube voltage levels. Virtual unenhanced CT images can be acquired which contributes to decreasing ionizing radiation dose up to 47% compared to multiphasic CT examination [31]. Iodine content of the renal masses instead of attenuation values (HU) after IV contrast administration can be measured with this technique (Fig. 1.12). DECT can also be helpful to demonstrate pseudoenhancement of renal masses [32].
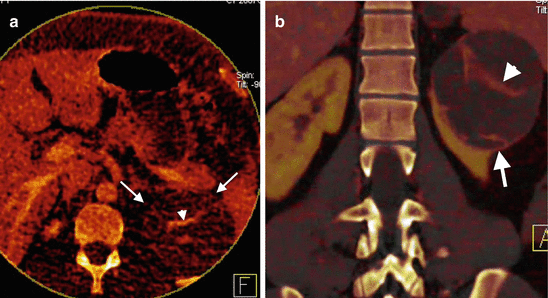

Fig. 1.12
Dual-energy CT of renal mass. Axial iodine overlay (a) and coronal mixed (b) images of DECT reveal a cystic mass (arrows) at the upper pole of the left kidney with a septum formation that uptakes iodine (arrowhead)
1.2.2.3 Magnetic Resonance Imaging
Magnetic resonance imaging (MRI) is a problem-solving tool in characterizing renal tumors with its high soft tissue contrast and multiplanar imaging capabilities [33]. MRI can depict water and fat content of renal tumors. Benign and malignant renal tumors may be more accurately differentiated by MRI due to capability of obtaining various sequences which enable to determine fat and water content of renal masses. MRI was shown to be better in evaluating renal lesions which were previously deemed indeterminate on CT [34].
Renal mass evaluation with MRI should include T1-W axial in- and out-of-phase gradient-echo sequence to identify macroscopic and microscopic fat, T2-W axial and coronal sequences to evaluate overall anatomy, renal collecting system, and complexity of cystic renal lesions and dynamic contrast-enhanced (DCE) T1-W fat-suppressed sequences consisting of corticomedullary, nephrographic, and excretory phases. Renal tumors usually appear hypointense on T1-W and hyperintense on T2-W images, while papillary cell RCCs manifest as hypointense lesions on T2-W images (Fig. 1.13). Cystic renal masses can be more easily and accurately characterized by MRI compared to CT. The presence and thickness of septa, wall thickness, and contrast enhancement patterns of renal cystic lesions can be depicted on DCE-MR images. Coronal T1-W images at excretory phase with administration of diuretics can delineate collecting system and ureters and may be helpful in the diagnosis of TCCs.
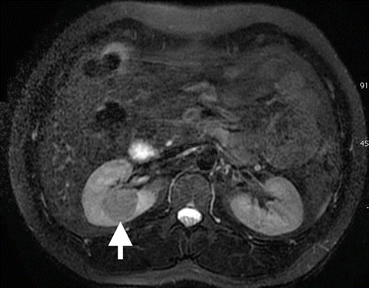

Fig. 1.13
Papillary RCC. Axial T2-W MRI of a 72-year-old male demonstrates a well-circumscribed hypointense mass (arrow) in the right kidney
DWI technique is increasingly used in the assessment of renal tumors. Solid renal tumors demonstrate increased signal intensity on DW images and decreased signal intensity on ADC maps secondary to restricted diffusion of water molecules in renal tumors (Fig. 1.14). DWI has potential to discriminate malignant renal tumors from benign tumors with ADC measurements . It was shown that malignant renal masses have lower ADC values than benign renal masses (Fig. 1.15) [19]. The ADC values of clear cell RCC were shown to be significantly higher than chromophobe and papillary cell RCC which may be helpful to differentiate these subtypes of RCC [35, 36].

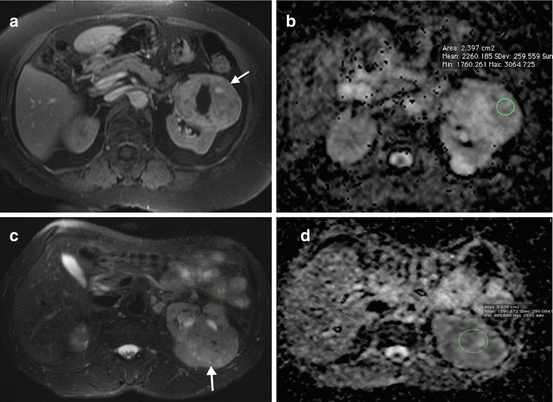

Fig. 1.14
DWI of renal cancer. (a) Contrast-enhanced T1-W MRI of a 62-year-old male with chromophobe RCC demonstrates enhancing solid mass (arrow) in the right kidney. (b) Renal mass presents with signal loss (arrow) secondary to restricted diffusion on ADC map

Fig. 1.15
ADC values of benign and malignant renal masses. (a) Axial contrast-enhanced fat-saturated T1-W image of a 44-year-old female with oncocytoma reveals enhancing solid mass (arrow) with nonenhancing central scar. (b) ADC value of the mass on ADC map image is measured as 2.26 mm2/s. (c) Axial T2-W image of a 66-year-old male with chromophobe RCC reveals a hyperintense solid mass (arrow) arising from the left kidney. (d) ADC value of the mass on ADC map image is measured as 1.59 mm2/s
Superiority of MRI over other imaging techniques is most remarkable on renal cystic masses with high protein content and hemorrhage. Since these lesions demonstrate high density on precontrast images and may show pseudoenhancement on contrast-enhanced CT images, their diagnosis may be difficult on MDCT. MRI provides a solution for this problem with subtraction technique. With MRI subtraction technique, precontrast MR image of a T1-W hyperintense lesion can be subtracted from contrast-enhanced image of same lesion (Fig. 1.16). MRI was shown to be superior than CT on depicting additional septa, thickening of the wall or septa, or enhancement of the complex renal cysts [25]. Application of Bosniak criteria to cystic lesions on MRI may lead to upstaging of lesions in 10% of cases which were previously categorized on CT [25].
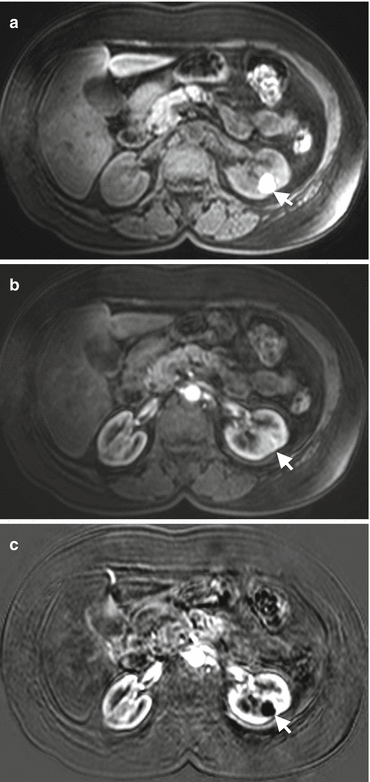

Fig. 1.16
Renal complex cyst on subtraction MRI. (a) Axial fat-suppressed T1-W image shows a hyperintense mass (arrow) in the left kidney. (b) Axial contrast-enhanced T1-W image demonstrates left kidney mass with hyperintense appearance (arrow) suggesting contrast enhancement. (c) Subtraction image reveals signal loss (arrow) in the mass confirming nonenhancement of the mass
MRI is also a key imaging tool for differentiation between fat-poor angiomyolipomas (AMLs) from RCC. A study using combination of MR sequences reported sensitivity, specificity, and accuracy values of 73%, 99%, and 96%, respectively, in distinguishing AML from RCC [37].
Multiparametric MRI (mp-MRI) of the kidney refers to acquisition of DCE-MRI , DWI, and perfusion MRI for evaluation of renal tumors. Perfusion MRI techniques including arterial spin labeling (ASL) and blood-oxygen-level-dependent (BOLD) MRI were reported to be helpful in distinguishing between benign and malignant renal masses with the capability of obtaining high-temporal-resolution images compared to conventional dynamic MRI. ASL is characterized by using the endogenous contrast properties of arterial blood and noninvasively labeling inflowing spins without exogenous contrast material administration [38]. ASL was shown to be helpful in distinguishing between RCC and oncocytomas as well as between papillary RCCs from other subtypes of RCC [38, 39]. BOLD MRI may be helpful for distinguishing RCCs from AMLs at 3 T MRI and for differentiation between benign cystic lesions from RCCs [40].
Although gadolinium-based contrast agents that are used in MRI were thought as safe contrast agents before, it is well known that these patients especially ones with impaired kidney function are at the risk of nephrogenic systemic fibrosis. Therefore, the use of gadolinium contrast in patients with low glomerular filtration rate (<30 mL/min/1.73 m2) is not recommended according to guidelines of American College of Radiology unless risk-benefit assessment favors the use of gadolinium contrast agent [20].
Malignant Tumors of Renal Pelvis
Transitional cell carcinomas and squamous cell carcinomas (SCC) represent 90% and 10% of pelvicalyceal malignant tumors (PMTs), respectively [41]. TCC may present as multifocal, synchronous, or metachronous lesions , which necessitate evaluation of all urinary tract with cross-sectional imaging studies. Computed tomography urography (CTU) enables evaluation of pelvicalyceal system of the kidneys, ureters, and bladder.
PMT manifest as focal mass or thickening of the wall of the urinary tract. US may not detect PMT presenting with thickening of the pelvis or ureteral wall. However focal mass forming PMT can be visualized on US as hypoechoic mass replacing hyperechoic renal sinus fat (Fig. 1.5).
CTU is essential for evaluating PMT especially for detection of synchronous lesions in the entire urinary tract. Mean attenuation value of these tumors (30 HU) is different from water (mean HU, 0), blood clot (mean HU, 50–75), and calculi (mean HU >100) [42]. PMTs enhance mildly or moderately on arterial phase images and manifest with washout on delayed phase images on CT [43]. Renal pelvis tumors most frequently manifest as filling defect in the renal pelvis at excretory phase images (Fig. 1.17). Superficial TCCs can be diagnosed based on the CT features as focal or diffuse mural thickening, focally obstructed calyces, or sessile filling defects within the hyperdense pelvicalyceal system or ureters filled with iodinated contrast material. Renal collecting system may be expanded, and renal fat sinus may be compressed due to mass effect of the PMT. Renal parenchymal invasion may be observed on aggressive and advanced stage of TCC that represents 15% of these tumors and can mimic renal parenchymal malignancies invading renal collecting system [43]. Renal parenchymal invasion of PMT can be defined as obliterated renal sinus fat plane between the mass and renal parenchyma on CT. TCC is more likely to be located centrally and expand the kidney centrifugally with less likely causing contour irregularities compared to RCC invading renal collecting system [44]. CT may play an important role in staging of PMT; however it cannot distinguish T1 tumor (limited to uroepithelium and lamina propria) from T2 tumor (tumor invading the muscularis propria) [22]. Early-stage PMT (T1 and T2) can be distinguished from advanced-stage tumors such as T3 (invading peripelvic fat or renal parenchyma) and T4 (invading adjacent organs or abdominal wall or extending perinephric fat) [22].
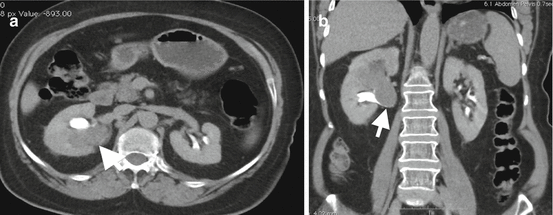

Fig. 1.17
Transitional cell carcinoma of renal pelvis. Axial (a) and coronal (b) CTU excretory phase images of a 74-year-old male reveal filling defect at the inferior portion of the renal pelvis and calyces caused by solid mass (arrows)
Metastases
Renal metastases usually manifest as bilateral and multifocal masses. If a solid renal mass is detected in a patient with extrarenal malignancy and metastases in other organs, probability of the diagnosis of renal metastasis is more likely [45]. However in the absence of other organ metastasis, a solid renal mass is less likely to be a metastasis even in the setting of primary extrarenal malignancy [46]. Renal metastases frequently appear as more infiltrative and less vascular masses compared to clear cell RCCs in the renal parenchyma. Differentiation between primary renal malignancies and metastases is usually difficult according to imaging features on cross-sectional imaging which often necessitate biopsy of the mass in the setting of solitary solid renal mass in patients with extrarenal primary malignancy.
Lymphoma
Lymphoma should be kept in mind in the differential diagnosis of extraprimary solid renal tumors since lymphoma is the third most common tumor involving the kidney after lung and breast cancer [47]. Primary renal lymphoma is a rare condition. Secondary renal lymphoma occurs due to invasion of the kidney by retroperitoneal lymphomatous tissue or hematogenous spread from distant sources. Renal lymphoma may present with diffuse infiltrating type or focal masses in the renal parenchyma.
US demonstrates hypoechoic, infiltrative focal masses in the renal parenchyma. CT is more helpful in the diagnosis of renal lymphoma than US. Diffuse infiltrating renal lymphoma may appear with nephromegaly and heterogeneously enhanced renal parenchyma on contrast-enhanced CT. Focal renal masses show homogeneous and a lower degree of enhancement than renal parenchyma with a relatively little mass effect (Fig. 1.18). Infiltrative renal lymphoma which arises from retroperitoneal lymphoid tissue presents with typical appearance that is characterized by infiltration of renal sinus without obstructing the renal collecting system and invasion of renal hilar vasculature. Renal contours are not usually deformed unless infiltrative lesion becomes enlarged and extended to perirenal fat tissue. Perirenal infiltration of lymphoma without parenchymal involvement is less common form of the disease.
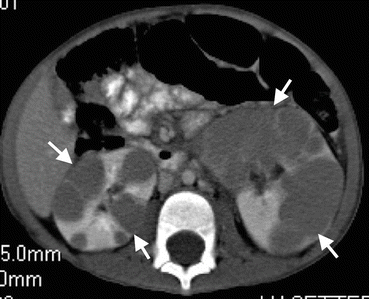

Fig. 1.18
Renal lymphoma. Axial contrast-enhanced CT demonstrates bilateral multiple focal renal parenchymal masses (arrows) suggesting lymphomatous involvement of the kidneys
Primary Renal Mesenchymal Tumors
Primary renal mesenchymal tumors are rare and include some imaging findings that can be helpful for diagnosis for these tumors. These tumors consist of leiomyosarcoma, liposarcoma, fibrosarcoma, malignant fibrous histiocytoma, rhabdomyosarcoma, osteosarcoma, chondrosarcoma, malignant peripheral nerve sheath tumor, synovial sarcoma, and angiosarcoma [41].
Renal sarcomas arise from the peripheral part of the kidney, mostly renal capsule, and present as a peripherally extending, large, heterogeneous mass rather than parenchymal mass (Fig. 1.19). A smooth interface between sarcomas and renal parenchyma is usually visualized on CT or MRI. Necrosis with large area is more frequently encountered in sarcomas than RCC. Liposarcomas as one of the most frequently encountered mesenchymal tumors of the kidney should be differentiated from angiomyolipomas (AMLs) since both of these lesions contain large amount of fat tissue. Most characteristic differentiating imaging feature between these entities is the presence of renal parenchymal defect at the site of the AML’s origin. It may be difficult to define the parenchymal defect in large AMLs. In this setting, the presence of intratumoral hemorrhage, the smaller oversize of the lesion, and the presence of other AMLs in the renal parenchyma may be helpful in distinguishing AML from liposarcoma.
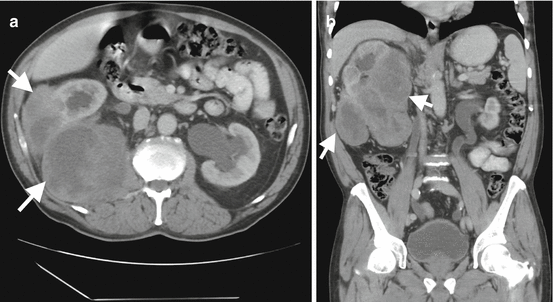

Fig. 1.19
Perirenal sarcoma. Axial (a) and coronal (b) contrast-enhanced CT images demonstrate large soft tissue mass (arrows) arising from renal capsule and extending to the perirenal area
1.2.3 Staging of Renal Tumors
Staging of renal tumors is conducted through TNM system. Preoperative planning and prognosis of renal cancers are associated with accurate staging. In renal cancer staging, it is important to determine perirenal tumor extension. Although perirenal tumor spread does not affect the treatment plan, it is a prognostic factor. Perirenal stranding which may be suggested as an indicator of perirenal tumoral spread on CT and MRI is not a reliable finding since 50% of renal tumors confined in the renal capsule was reported to present with perirenal stranding [48]. A pseudocapsule that is composed of compressed renal parenchyma and fibrosis envelopes renal tumors. An intact pseudocapsule which can be well demonstrated on T2-W MR images as hypointense linear structure may represent absence of perirenal tumor spread [49]. Involvement of renal capsule or Gerota fascia can be better evaluated by MRI than CT due to superiority of MRI in depicting perirenal fat invasion and fat planes with its high contrast resolution (Fig. 1.20) [50].
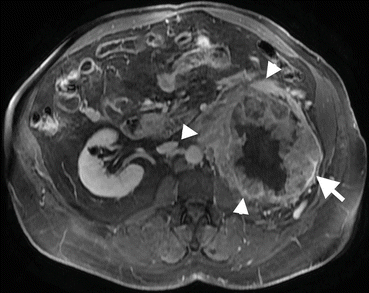

Fig. 1.20
Perirenal invasion of renal cancer. Axial fat-suppressed contrast-enhanced T1-W image shows tumoral mass (arrows) arising from the left kidney and invading perirenal fat tissue (arrowheads)
Staging of renal tumors should include interrogation of venous extension of the tumors. Since patients with renal malignancy may be prone to venous thromboembolism, it is important to distinguish bland thrombus and tumoral thrombus in the setting of renal venous and/or IVC thrombosis. Bland thrombus of the venous system presents with nonenhanced filling defect confined to venous vessel, while tumoral thrombus usually appears as contrast enhanced, vessel expanding, and usually upward projected into the IVC on CT or MRI. MR imaging has been assumed as more capable than CT in evaluation of vascular extension, differentiation of perihilar lymph nodes from hilar vessels, and assessment of direct invasion of renal tumors to the adjacent tissues [21].
Renal cancers mostly metastasize to the lung, bone, brain, liver, and mediastinum [20]. Chest radiograph is the first step in the evaluation of lung metastases; however chest CT may be required in the presence of abnormal chest radiography findings.
Liver metastases can be detected on US examination. Solid or cystic lesions detected on US and suspected as metastatic lesions may be evaluated with CT or MRI. Renal cancer metastasis originated particularly from clear cell RCC manifest as hypervascular liver metastases.
1.2.4 Intervention in Renal Masses
The biopsy of renal masses is not usually required for management. Limited indications of renal mass biopsy include assessment of patients for percutaneous ablative treatment, high suspicion of renal metastasis from other tumors or lymphomatous involvement, suspected nephroblastoma in a young adult, and non-negligible probability of a benign histology with imaging features suggesting oncocytoma or low-fat angiomyolipoma [21].
Thermal ablation techniques including radio frequency ablation (RF) , cryoablation , microwaves, laser, and focused ultrasound ablation have become generally well-known treatment alternatives for renal tumors in surgically at-risk patients. Since nearly 50% of renal tumors are detected incidentally and these tumors are usually at small size without advanced-stage treatment, strategy of these tumors may involve radiologically guided thermal ablation techniques [51]. Percutaneous ablation of renal tumors can be performed under the guidance of US, CT, or MRI. Percutaneous route has the advantages of less pain, immediate verification of ablation efficiency, shorter period of hospitalization, and reduced overall cost [52]. Thermal ablation techniques are usually used percutaneously; however laparoscopic thermal ablation may also be used in anteriorly positioned renal tumors. A meta-analysis study revealed overall complication rates of laparoscopic and percutaneous radio frequency techniques as 7.4% and 3.1%, respectively [52].
US guidance in renal tumor ablation enables fast and accurate positioning of the applicators. However formation of hyperechoic gas bubbles after RF ablation and ice crystals after cryotherapy may prevent visualization of posttreatment changes at the tumor site [53]. CT is the best guidance method for percutaneous ablation of renal tumors for localizing the tumor, controlling the procedure, and diagnosing immediate complications.
RF ablation is effective in renal tumors less than 4 cm, while cryoablation and microwave ablation techniques can be used in larger tumors. Local recurrence-free survival at 5 years after RF ablation was reported as 89–92% [54, 55]. Most recurrences after RF ablation occur during the first year [56]. Technical failure of this technique increases with size increase (>4 cm) and sinus extension of the tumor [57].
Cryotherapy is characterized by destruction of tumor cells using freeze/thaw cycles [53]. The freezing cycle produces ice crystals which cause denaturation of intracellular proteins, destruction of cell structures, and modification of cell membrane function. This cycle permits inflow of water into the intracellular compartment resulting in burst tumor cells. Cryoablation allows monitoring the ablation zone in real time which is important to visualize the tissue changes close to the adjacent sensitive organs. Central renal tumors are more available for cryotherapy as this technique does not damage the urothelium [53]. Cryotherapy has lower rates of reoperation (1.3%), tumor progression (5.2%), and frequency of metastases (1%) compared to RF with corresponding rates of 8.5%, 12.9%, and 2.5%, respectively [58].
In microwave ablation technique, larger tumors can be treated in less time with uniform cell death in the ablation zone since ablation is not limited by desiccation, carbonization, or thermal convection [59].
Complications of renal tumor ablation consist of bleeding (0–30%), pneumothorax (1–2%), pain (4.5%), thermal injuries of the digestive tract (0–1%) and urinary tract (less than 4%), infection (0–2%), and tumor dissemination [53].
Follow-up of patients with renal tumor ablation should be performed 2, 6, and 12 months after ablation with US, CT, or MRI in the first year, and annual follow-up is required in the following 5 years [53]. Necrotic and hemorrhagic changes in ablation zone may mimic recurrence with increased signal intensity on T1-W MR images. In the setting of this circumstance, subtraction MR images can reveal true unenhanced or enhanced area in the ablation zone.
1.3 Bladder Cancer
1.3.1 General Information
Bladder cancer is the sixth most commonly diagnosed malignancy in the United States [60]. Main purpose of imaging in bladder cancer is optimized pretreatment staging for guiding appropriate treatment. Staging of bladder cancer should include assessment of bladder wall involvement and local, regional, nodal, or distant visceral spread of the tumor. Bladder cancers most frequently manifest as non-muscle-invasive bladder cancer (NMIBC). As this form of bladder cancer has tendency to recur, close surveillance with imaging techniques is necessary. One quarter of patients with bladder cancer present as muscle-invasive bladder cancer (MIBC) [60]. Since radical cystectomy is required in the treatment of MIBC, local/regional extravesical tumor invasion and distant metastasis should be interrogated with CT or MRI.
Transitional cell carcinomas (TCCs) are the most frequently encountered bladder cancer. TCCs can be seen as papillary masses protruding to the bladder lumen or infiltrating mass causing focal or diffuse thickening of the bladder wall. Calcification rarely occurs in TCC. Squamous cell carcinomas are characterized by mass-like, aggressive, frequently calcified tumors often associated with chronic bladder wall inflammation or schistosomiasis. Adenocarcinomas mostly occur in patients with bladder exstrophy and urachal remnants usually localized in anterior and superior aspect of the bladder [61].
1.3.2 Imaging Features
1.3.2.1 Ultrasonography
Adequate distention of the bladder is essential for sonographic assessment of patients with suspicion of bladder cancer. Bladder cancers present as hypo- or isoechoic polypoid solid lesions protruding into the bladder lumen or sessile asymmetric thickening of bladder wall. CDUS usually demonstrates blood flow within the bladder cancer (Fig. 1.21). US has a sensitivity of 61–84% for polypoid bladder cancer larger than 5 mm [62]. Small polypoid tumors (<5 mm) can be easily missed on US. Hematomas can be differentiated from bladder tumors by visualizing mobility of hematomas with patient movement, absence of blood flow on CDUS, and fragmentation of solid-appearing mass by applying pressure by US transducer. US can reveal the number, size, and appearance (sessile or pedicled) of bladder cancer and their topography relative to the prostatic urethra and to the ureteral meatus [63]. US can be more helpful in bladder cancer localized in a bladder diverticulum where cystoscopy may be insufficient for evaluation [64]. Three-dimensional (3D) virtual sonography combined with 2D sonography has a sensitivity of 96.4%, specificity of 88.8%, a positive predictive value (PPV) of 97.6%, and a negative predictive value (NPV) of 84.2% for detection of bladder cancer [65]. CEUS has higher sensitivity (88.5%) and specificity (88.9%) values for detection of bladder cancer compared to grayscale US [66].
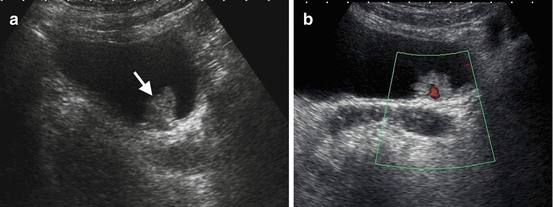

Fig. 1.21
Bladder cancer. (a) Grayscale US demonstrates solid papillary echogenic mass (arrow) arising from posterior wall of the bladder and protruding to the bladder lumen. (b) Power Doppler US reveals blood flow signal within the mass
1.3.2.2 Computed Tomography
CT is one of the most frequently used imaging techniques in detection, staging, and surveillance of the bladder cancer. American College of Radiology (ACR) appropriateness criteria refer CTU as the best initial imaging examination technique for the evaluation of hematuria [67]. CTU series generally include precontrast images and enhanced images at nephrographic phase and excretory phase. 3D reformatted images of the excretory phase of CTU demonstrate the entire urinary tract by delineating the tract with iodinated contrast agent. In order to reduce radiation dose during CTU, some institutions use split-bolus technique that refers to acquisition of nephrographic phase images and excretory phase images at same scanning time to demonstrate contrast-enhanced renal parenchyma and contrast agent-filled renal collecting system, ureters, and bladder in the same image series. This technique reduces the radiation dose of CTU; however contrast resolution of images may be diminished secondary to dilution of contrast agent in the urinary tract. Split-bolus technique reduces radiation dose and is comparable to that of intravenous urography (IVU) [65].
Stage T1 bladder cancers appear as pedunculated polypoid lesions or asymmetric thickening of the bladder wall on CT (Fig. 1.22). T2 tumors usually present as sessile lesions (Fig. 1.23). MDCT including excretory phase has 96% sensitivity and 99% specificity for detection of polypoid bladder cancers between 5 and 10 mm, 89% sensitivity for polypoid lesions smaller than 5 mm, and 40% sensitivity for polypoid lesions smaller than 3 mm [68]. The specificity and NPV of CTU for detection of bladder cancer are higher in patients with hematuria than in patients without hematuria [69].
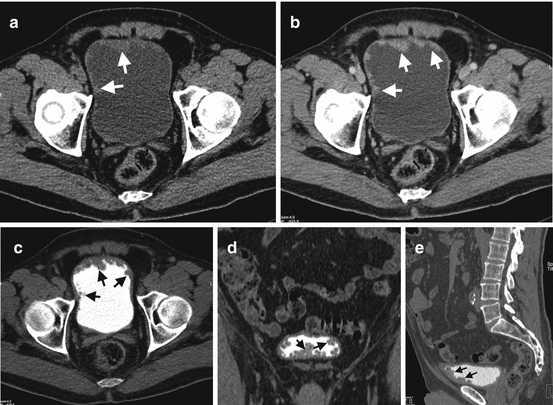
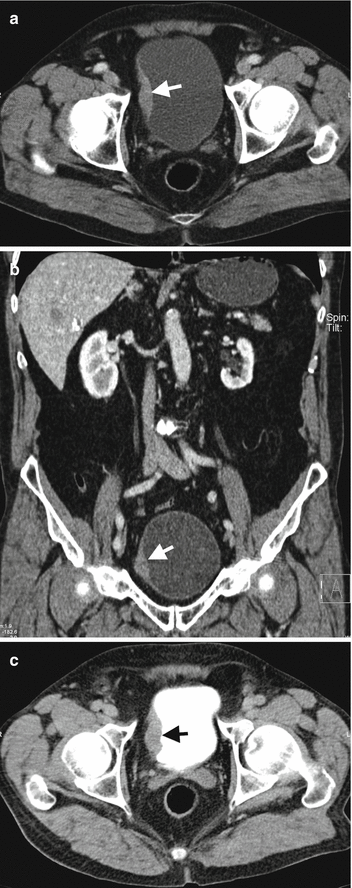

Fig. 1.22
Bladder cancer on CTU. (a) Axial precontrast CT image reveals thickening of anterior bladder wall with mild hyperdense appearance (arrows). (b) Axial contrast-enhanced CT image at venous phase demonstrates enhancement of the irregularly thickened anterior bladder wall (arrows). (c) Axial (d) coronal and (e) sagittal contrast-enhanced CT images at excretory phase reveal irregular filling defect in the anterior and inferior bladder wall (arrows) representing bladder cancer

Fig. 1.23
Muscle-invasive bladder cancer on CTU. Axial (a) and coronal (b) contrast-enhanced CT images at venous phase reveal enhancing sessile mass (arrow) at the right bladder wall. (c) CTU image at excretory phase reveals filling defect (arrow) in the right bladder wall
It should be kept in mind that the diagnostic efficiency of CT for detection of bladder cancer may be decreased when CT examination is performed shortly after bladder interventions such as biopsy or transurethral resection of the bladder (TURB). A study which compared the frequency of concordance between CT findings and histologic examinations showed that CT examinations performed 7 days after the bladder intervention were more in concordance with the histopathological results than CT examinations performed in the following 7 days after TURB [70].
CTU is frequently used in NMIBC patients to demonstrate involvement of upper urinary tract. CTU overweighs MRI in the evaluation of tumoral involvement in upper urinary tract owing to its higher spatial resolution [64]. Occult intramural or transmural extension of tumor and measurable pelvic lymphadenopathy suggestive of local spread of bladder cancer can be diagnosed with CT. Perivesical fat infiltration can be detected on CT with 89% sensitivity and 95% specificity values [68, 70]. Bladder tumors arising in the bladder diverticulum should be rigorously assessed in terms of perivesical fat invasion since muscularis mucosa layer is absent in the bladder diverticula (Fig. 1.24). Infiltration of prostate and seminal vesicles by bladder cancer can be detected on CT only when these organs were massively infiltrated. CT is helpful to assess possible invasion of digestive tract such as sigmoid colon or loops of the small intestine [68]. Distant metastasis including peritoneal carcinomatosis can also be detected with CT [71]. Multiplanar imaging capability of CT with thin slices provides 3D visualization of the entire urinary tract resembling IVU images. These 3D images may be easy to evaluate the urinary tract; however abnormalities visualized in 3D reconstructed images should be confirmed on axial images. In one study, 21 of 27 upper urinary tract neoplasms were missed using the 3D reconstructed images alone [72].
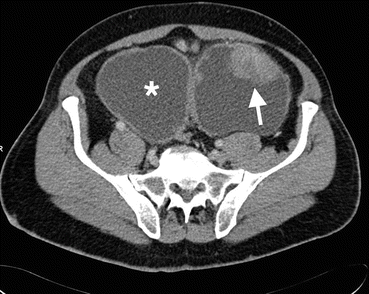

Fig. 1.24
Bladder cancer in diverticulum. Axial contrast-enhanced CT image demonstrates solid enhancing mass (arrow) arising from superior wall of the bladder diverticula (asterisk, bladder)
For monitoring NIMBC, CT urography is recommended every 2 years; however CT urography can be performed in the presence of positive cytology or any symptom indicating upper urinary tract involvement [68]. In monitoring patients with MIBC, CT urography should be performed every 6 months for 2 years after radical cystectomy followed by annual CT scanning [73].
Stay updated, free articles. Join our Telegram channel

Full access? Get Clinical Tree


