Highlights
- •
In the absence of evidence from randomized controlled trials, Trimodal Therapy (TMT) for muscle-invasive bladder cancer (MIBC) is usually reserved to patients with poor overall health status.
- •
We developed a novel approach by matching patients based on their calculated other-cause mortality (OCM) risk as a proxy of comorbidities indicator.
- •
In this matched cohort of MIBC patients with equivalent OCM risk, radical cystectomy yielded better cancer-specific survival over TMT for cT2 MIBC patients. Conversely, no cancer-specific survival difference was shown for cT3-T4 disease, regardless of treatment.
Abstract
Objective
Comparative effectiveness studies comparing trimodal therapy (TMT) to radical cystectomy (RC) are typically hindered by selection bias where TMT is usually reserved to patients with poor overall health status. We developed a novel approach by matching patients based on their calculated other-cause mortality (OCM) risk. Using this homogeneous cohort, we tested the impact of TMT vs RC on cancer-specific mortality (CSM).
Materials and Methods
The Surveillance, Epidemiology and End Results (SEER) 2004-2018 database was queried to identify patients diagnosed with cT2-4N0M0 muscle-invasive bladder cancer (MIBC). A Fine-Gray competing-risk regression model calculating the 5-year OCM risk was used to create a 1:1 propensity-score matched-cohort of patients treated with RC or TMT. Cumulative incidence and competing-risk regression analyses tested the impact of treatment type (RC vs TMT) on CSM. Patients were further stratified according to clinical T stage (cT2 vs cT3-4) in sensitivity analyses.
Results
We identified 6,587 patients (76%) treated with RC and 2,057 (24%) with TMT. The median follow-up was 3.0 years. In the unmatched-cohort, 5-year OCM and CSM rates were 14% and 40% for RC vs 23% and 47% in TMT group, respectively (all P < 0.001). Our matched-cohort included 4,074 patients, equally distributed for treatment type, with no difference in 5-year OCM (HR: 0.98, 95% CI: 0.86–1.11, P = 0.714). In clinical-stage specific sensitivity analyses, 5-year CSM rate was significantly worse for cT2N0M0 patients treated with TMT (HR: 1.52, 95% CI: 1.21–1.91, P < 0.001) than those treated with RC. For cT3-4N0M0 patients, there was no difference in CSM among the 2 approaches (HR: 0.98, 95% CI: 0.63–1.52, P = 0.900).
Conclusions
Our findings demonstrate an oncologic advantage of RC over TMT for cT2 MIBC patients. Conversely, we did not find a cancer-specific survival difference for cT3-T4 MIBC patients, regardless of treatment.
1
Introduction
Bladder cancer (BCa) ranks as the sixth most common cancer in the United States, and contributed to over 16,000 cancer-associated deaths in 2022 [ ]. Approximately 25% of new cases are diagnosed at the muscle-invasive stage, for which the gold standard treatment is radical cystectomy (RC) and neoadjuvant chemotherapy [ ]. Despite improvements in surgical technique and the perioperative management of these patients, RC remains associated with high comorbidity rates and detrimental quality-of-life changes, with perioperative complication rates estimated to range from 50% to 70% [ ].
Thus, several bladder-sparing options have been proposed for patients who are strongly motivated to preserve their bladder or are ineligible for radical surgery. Among these alternatives, trimodal therapy (TMT), achieved through a combination of maximal transurethral resection of the bladder tumor (TURBT) with concurrent chemoradiation, has gained support, given its efficacy and safety [ ]. However, no randomized controlled trials have conclusively assessed whether TMT can offer comparable oncological efficacy to RC [ ]. Therefore, although TMT is now accepted for well-selected patients with muscle-invasive bladder cancer (MIBC), in clinical practice, it is often reserved for patients in whom surgery is not a feasible option. This is primarily due to existence of conflicting literature on the subject. For instance, data from a large multicentric cohort [ ], along with other smaller single institutional cohorts [ , ], have shown that TMT yields similar oncological outcomes compared to RC. In contrast to these findings, previous large population-level studies have shown RC to be superior [ ]. However, all these reports have consistently suffered from selection bias, indicated by significantly higher rates of other-cause mortality (OCM) among TMT patients, regardless of propensity-score matching or adjustments. This suggests that patients referred to TMT generally had poorer health status and a higher risk of death from other causes.
To overcome this limitation and investigate whether TMT and RC are truly oncologically equally efficacious, we designed the current study utilizing a novel approach of matching patients based on their calculated 5-year OCM risk. The objective was to create a more homogeneous cohort of MIBC patients treated with RC versus TMT, who had similar OCM risk, and evaluate the impact of treatment (RC vs TMT) on cancer-specific mortality (CSM). We hypothesized that in patients with similar health status, TMT and RC would yield similar oncological outcomes.
2
Materials and methods
2.1
Data source
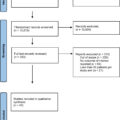
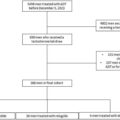
The Surveillance, Epidemiology and End Results (SEER) database [ ] was queried to identify patients aged 18 years or older diagnosed with MIBC, between 2004 and 2018 (n = 246,591). Exclusion criteria were: presence of histological variant of BCa (14,222 excluded), clinical evidence of distant metastasis (10,728), previous cancer diagnoses (13,637), missing data observed among co-variables or at follow-up (254). The final cohort consisted of 8,644 patients with clinical T2-T4 N0 M0 stage (181,466 excluded for non-MIBC) who were treated either with RC or TMT (13,637 excluded for other treatments, Supplementary Fig. 1 ). TMT was defined as the receipt of TURBT, chemotherapy and radiation therapy (RT) based on SEER site-specific codes. We included only patients who received RT and chemotherapy within 180 days post-TURBT diagnosis, excluding those who underwent radical cystectomy or partial cystectomy. On the other hand, RC patients were included regardless of chemotherapy receipt.
2.2
Variables
The following covariates were extracted for all patients: age, race, marital status, median household income (inflation adjusted), SEER registry, rural/urban indicator, years of diagnosis. SEER variable “CS Extension – clinical extensions” was used to determine the clinical T stage [ ]. Treatment type (RC vs TMT) was identified using SEER site specific coding modules, which include Primary Sites codes for surgery, chemotherapy, and RT [ ].
2.3
Endpoints
Our main endpoint was cancer-specific mortality, defined by SEER as death due to BCa (ICD-10 C619 or ICD-9185.9). Mortality due to all other causes was coded as OCM [ ].
2.4
Statistical analysis
Median and interquartile range (IQR) were used to describe continuous variables, while percentage and proportion were used for categorical variables. We primarily stratified patients by initial treatment type (RC vs TMT) and the 2 groups were compared by Mann-Whitney U test and chi-square tests for continuous and categorical variables, respectively.
Our statistical analyses consisted of several steps. First, we used a Fine-Gray competing-risk regression model to calculate 5-year OCM risk based on all available clinico-pathologic covariates, including treatment type (RC vs TMT) and chemotherapy receipt ( Table 1 ). Second, the calculated 5-year OCM risk model was used to create a 1:1 propensity-score matched (PSM) cohort of patients treated with RC vs TMT. Greedy nearest neighbor matching with a caliper of 0.1 was used to create the matched-cohort. Standardized mean differences (SMD) were calculated to assess the quality of matching with an SMD less than 0.25 considered well matched [ ]. Third, cumulative incidence curves were used to depict CSM and OCM estimates in the matched-cohort, using Gray’s test to compare the RC arm to the TMT arm. Fourth, competing-risk regression was then used to test the impact of treatment type (RC vs TMT) on CSM in the matched-cohort, adjusting to all available covariates. Finally, to address the persistent imbalance in T stage between the 2 treatments, we performed sensitivity analyses based on clinical T stage: cT2 vs cT3-4. The PSM based on calculated OCM risk was repeated to create 2 separate cohorts for each T stage group: RC plus chemotherapy vs TMT and RC without chemotherapy vs TMT. Cumulative curves were again repeated to test the impact of surgery, with or without chemotherapy, versus TMT on CSM. Similarly, competing-risk regression analysis re-tested the impact of RC vs TMT (adjusted for perioperative chemotherapy status) in the clinical T stage sub-cohorts.
| Follow-up Time (Years) | ||||
|---|---|---|---|---|
| Covariate | Level | Hazard Ratio | HR P -value | Type3 P -value |
| Treatment | Radical Cystectomy No Chemo | 1.05 (0.94–1.18) | 0.408 | <0.001 |
| Radical Cystectomy With Chemo | 0.68 (0.59–0.78) | <0.001 | ||
| Trimodal Therapy | – | – | ||
| T Stage | T3 | 0.97 (0.88–1.09) | 0.639 | 0.322 |
| T4 | 1.09 (0.95–1.24) | 0.214 | ||
| T2 | – | – | ||
| Age | 1.03 (1.03–1.04) | <0.001 | <0.001 | |
| Sex | Female | 0.79 (0.71–0.88) | <0.001 | <0.001 |
| Male | – | – | ||
| Race | American Indian/Alaska Native | 0.53 (0.17–1.68) | 0.281 | 0.811 |
| Asian or Pacific Islander | 0.96 (0.77–1.20) | 0.735 | ||
| Black | 1.04 (0.86–1.26) | 0.675 | ||
| Unknown | 1.24 (0.38–4.04) | 0.717 | ||
| White | – | – | ||
| Marriage | Married | 0.80 (0.69–0.92) | 0.002 | 0.002 |
| Single (Previously Married) | 0.91 (0.78–1.06) | 0.230 | ||
| Single (Never Married) | – | – | ||
| SEER Registry | California | 0.73 (0.53–1.00) | 0.051 | 0.003 |
| Connecticut | 0.93 (0.65–1.33) | 0.700 | ||
| Georgia | 0.82 (0.58–1.17) | 0.274 | ||
| Hawaii | 1.12 (0.72–1.75) | 0.611 | ||
| Iowa | 0.78 (0.53–1.15) | 0.211 | ||
| Kentucky | 1.01 (0.70–1.45) | 0.973 | ||
| Louisiana | 1.02 (0.70–1.47) | 0.929 | ||
| New Jersey | 0.85 (0.60–1.19) | 0.345 | ||
| New Mexico | 0.78 (0.50–1.21) | 0.269 | ||
| Seattle (Puget Sound) | 0.78 (0.55–1.11) | 0.164 | ||
| Utah | – | – | ||
| Rural/Urban Indicator | Counties in metropolitan areas ge 1 million pop | 1.06 (0.80–1.40) | 0.686 | 0.107 |
| Counties in metropolitan areas of 250,000 to 1 million pop | 0.91 (0.70–1.19) | 0.496 | ||
| Counties in metropolitan areas of lt 250 thousand pop | 1.08 (0.82–1.42) | 0.588 | ||
| Nonmetropolitan counties adjacent to a metropolitan area | 1.13 (0.88–1.46) | 0.337 | ||
| Nonmetropolitan counties not adjacent to a metropolitan area | – | – | ||
| Median Household Income (Inflation Adjusted) | $35,000–$39,999 | 1.08 (0.62–1.88) | 0.793 | 0.601 |
| $40,000–$44,999 | 0.94 (0.55–1.60) | 0.812 | ||
| $45,000–$49,999 | 0.90 (0.54–1.49) | 0.681 | ||
| $50,000–$54,999 | 0.82 (0.49–1.38) | 0.455 | ||
| $55,000–$59,999 | 0.94 (0.56–1.58) | 0.818 | ||
| $60,000–$64,999 | 1.02 (0.60–1.72) | 0.953 | ||
| $65,000–$69,999 | 0.86 (0.50–1.48) | 0.591 | ||
| $70,000–$74,999 | 0.81 (0.47–1.40) | 0.450 | ||
| $75,000+ | 0.87 (0.51–1.50) | 0.623 | ||
| <$35,000 | – | – | ||
All statistical analyses were performed using SAS 9.4 (SAS Institute, Cary, North Carolina) and all tests were 2-sided with a statistical significance defined as P -value <0.05. In order to adjust for multiple testing, the Benjamini-Hochberg procedure was used on analyses with multiple comparisons. To avoid potential misinterpretation of numerous adjusted effects in multiple comparisons, we provided only the hazard ratios for the primary outcome of interest (RC vs TMT: see Table 3 ). Statistically significant P -values are bolded. E-values for median estimate and 95% confidence interval were also computed to evaluate the impact of unmeasured confounders on our study findings, which could potentially explain away the treatment-outcome association [ ].
3
Results
3.1
Baseline characteristics
We identified 8,644 patients treated with nonmetastatic cT2-T4 MIBC treated between 2004 and 2018. About 6,587 patients (76%) underwent RC and 2,057 (24%) TMT. Clinico-pathological characteristics of the whole cohort are described in Table 2 . Overall, TMT patients were older (median age: 76 vs 66 years, P < 0.001) and less often married (55% vs 59%, P < 0.001). TMT patients had lower rate of cT3/4 tumor compared to RC patients (16.8% vs 54.1%, P < 0.001).
| Whole Group | Matched Group | |||||
|---|---|---|---|---|---|---|
| Treatment | Treatment | |||||
| Radical Cystectomy (N = 6,587) | Trimodal Therapy (N = 2,057) | Total (N = 8,644) | Radical Cystectomy (N = 2,037) | Trimodal Therapy (N = 2,037) | SMD a | |
| Status, n (%) | ||||||
| Alive | 2,484 (37.7%) | 456 (22.2%) | 2,940 (34.0%) | 560 (27.5%) | 452 (22.2%) | |
| Prostate Cancer Specific Mortality | 2,733 (41.5%) | 1,017 (49.4%) | 3,750 (43.4%) | 880 (43.2%) | 1,010 (49.6%) | |
| Other Cause Mortality | 1,370 (20.8%) | 584 (28.4%) | 1,954 (22.6%) | 597 (29.3%) | 575 (28.2%) | |
| 5-Year OCM Risk | 0.0142 | |||||
| N (Missing) | 6,587 (0) | 2,057 (0) | 8,644 (0) | 2,037 (0) | 2,037 (0) | |
| Mean (SD) | 14.3 (6.41) | 20.7 (6.41) | 15.9 (6.97) | 20.5 (6.13) | 20.6 (6.23) | |
| Median (IQR) | 13.1 (9.5, 18.2) | 20.6 (16.0, 24.8) | 14.8 (10.3, 20.5) | 20.5 (16.0, 24.7) | 20.5 (16.0, 24.6) | |
| Follow-up (Years) | ||||||
| N (Missing) | 6,587 (0) | 2,057 (0) | 8,644 (0) | 2,037 (0) | 2,037 (0) | |
| Mean (SD) | 4.8 (4.40) | 3.2 (3.09) | 4.4 (4.18) | 4.2 (4.18) | 3.2 (3.10) | |
| Median (IQR) | 3.4 (1.2, 7.4) | 2.1 (0.9, 4.5) | 3.0 (1.1, 6.7) | 2.6 (0.8, 6.4) | 2.2 (0.9, 4.6) | |
| Age | 0.0718 | |||||
| N (Missing) | 6,587 (0) | 2,057 (0) | 8,644 (0) | 2,037 (0) | 2,037 (0) | |
| Mean (SD) | 66.1 (10.67) | 74.6 (10.20) | 68.1 (11.16) | 73.8 (8.68) | 74.4 (10.16) | |
| Median (IQR) | 66.0 (59.0, 74.0) | 76.0 (68.0, 82.0) | 68.0 (60.0, 77.0) | 75.0 (68.0, 80.0) | 76.0 (68.0, 82.0) | |
| Sex, n (%) | 0.0844 | |||||
| Female | 2,109 (32.0%) | 530 (25.8%) | 2,639 (30.5%) | 605 (29.7%) | 528 (25.9%) | |
| Male | 4,478 (68.0%) | 1,527 (74.2%) | 6,005 (69.5%) | 1,432 (70.3%) | 1,509 (74.1%) | |
| Race, n (%) | 0.0381 | |||||
| American Indian/Alaska Native | 33 (0.5%) | 5 (0.2%) | 38 (0.4%) | 1 (0.0%) | 5 (0.2%) | |
| Asian or Pacific Islander | 358 (5.4%) | 101 (4.9%) | 459 (5.3%) | 103 (5.1%) | 99 (4.9%) | |
| Black | 407 (6.2%) | 154 (7.5%) | 561 (6.5%) | 134 (6.6%) | 153 (7.5%) | |
| Unknown | 13 (0.2%) | 1 (0.0%) | 14 (0.2%) | 9 (0.4%) | 1 (0.0%) | |
| White | 5,776 (87.7%) | 1,796 (87.3%) | 7,572 (87.6%) | 1,790 (87.9%) | 1,779 (87.3%) | |
| Clinical T Stage, n (%) | ||||||
| T2 | 3,022 (45.9%) | 1,712 (83.2%) | 4,734 (54.8%) | 899 (44.1%) | 1,699 (83.4%) | 0.9089 |
| T3 | 2,391 (36.3%) | 176 (8.6%) | 2,567 (29.7%) | 745 (36.6%) | 172 (8.4%) | |
| T4 | 1,174 (17.8%) | 169 (8.2%) | 1,343 (15.5%) | 393 (19.3%) | 166 (8.1%) | |
| Chemotherapy n, (%) | ||||||
| No/Unknown | 3,381 (51.3%) | 0 (0.0%) | 3,381 (39.1%) | 1,613 (79.2%) | 0 (0.0%) | |
| Yes | 3,206 (48.7%) | 2,057 (100.0%) | 5,263 (60.9%) | 424 (20.8%) | 2,037 (100.0%) | |
| Marriage, n (%) | ||||||
| Married | 3,899 (59.2%) | 1,137 (55.3%) | 5,036 (58.3%) | 1,020 (50.1%) | 1,129 (55.4%) | 0.1005 |
| Single (Never Married) | 860 (13.1%) | 220 (10.7%) | 1,080 (12.5%) | 245 (12.0%) | 220 (10.8%) | |
| Single (Previously Married) | 1,828 (27.8%) | 700 (34.0%) | 2,528 (29.2%) | 772 (37.9%) | 688 (33.8%) | |
| SEER Registry, n (%) | ||||||
| California | 2,705 (41.1%) | 790 (38.4%) | 3,495 (40.4%) | 685 (33.6%) | 788 (38.7%) | 0.4354 |
| Connecticut | 365 (5.5%) | 124 (6.0%) | 489 (5.7%) | 121 (5.9%) | 123 (6.0%) | |
| Georgia | 650 (9.9%) | 270 (13.1%) | 920 (10.6%) | 201 (9.9%) | 266 (13.1%) | |
| Hawaii | 141 (2.1%) | 30 (1.5%) | 171 (2.0%) | 78 (3.8%) | 28 (1.4%) | |
| Iowa | 330 (5.0%) | 98 (4.8%) | 428 (5.0%) | 84 (4.1%) | 97 (4.8%) | |
| Kentucky | 476 (7.2%) | 114 (5.5%) | 590 (6.8%) | 207 (10.2%) | 108 (5.3%) | |
| Louisiana | 430 (6.5%) | 88 (4.3%) | 518 (6.0%) | 192 (9.4%) | 87 (4.3%) | |
| New Jersey | 818 (12.4%) | 220 (10.7%) | 1,038 (12.0%) | 262 (12.9%) | 217 (10.7%) | |
| New Mexico | 156 (2.4%) | 32 (1.6%) | 188 (2.2%) | 54 (2.7%) | 32 (1.6%) | |
| Seattle (Puget Sound) | 404 (6.1%) | 232 (11.3%) | 636 (7.4%) | 110 (5.4%) | 232 (11.4%) | |
| Utah | 112 (1.7%) | 59 (2.9%) | 171 (2.0%) | 43 (2.1%) | 59 (2.9%) | |
| Rural/Urban Indicator, n (%) | 0.1618 | |||||
| Counties in metropolitan areas ge 1 million pop | 3,861 (58.6%) | 1,078 (52.4%) | 4,939 (57.1%) | 1,146 (56.3%) | 1,068 (52.4%) | |
| Counties in metropolitan areas of 250,000 to 1 million pop | 1,387 (21.1%) | 521 (25.3%) | 1,908 (22.1%) | 387 (19.0%) | 518 (25.4%) | |
| Counties in metropolitan areas of lt 250 thousand pop | 499 (7.6%) | 183 (8.9%) | 682 (7.9%) | 186 (9.1%) | 179 (8.8%) | |
| Nonmetropolitan counties adjacent to a metropolitan area | 460 (7.0%) | 178 (8.7%) | 638 (7.4%) | 177 (8.7%) | 177 (8.7%) | |
| Nonmetropolitan counties not adjacent to a metropolitan area | 380 (5.8%) | 97 (4.7%) | 477 (5.5%) | 141 (6.9%) | 95 (4.7%) | |
| Median Household Income (Inflation Adjusted), n (%) | 0.2141 | |||||
| $35,000–$39,999 | 88 (1.3%) | 42 (2.0%) | 130 (1.5%) | 41 (2.0%) | 39 (1.9%) | |
| $40,000–$44,999 | 187 (2.8%) | 67 (3.3%) | 254 (2.9%) | 66 (3.2%) | 67 (3.3%) | |
| $45,000–$49,999 | 340 (5.2%) | 113 (5.5%) | 453 (5.2%) | 129 (6.3%) | 112 (5.5%) | |
| $50,000–$54,999 | 396 (6.0%) | 144 (7.0%) | 540 (6.2%) | 115 (5.6%) | 144 (7.1%) | |
| $55,000–$59,999 | 569 (8.6%) | 181 (8.8%) | 750 (8.7%) | 207 (10.2%) | 177 (8.7%) | |
| $60,000–$64,999 | 590 (9.0%) | 164 (8.0%) | 754 (8.7%) | 233 (11.4%) | 157 (7.7%) | |
| $65,000–$69,999 | 1,131 (17.2%) | 277 (13.5%) | 1,408 (16.3%) | 306 (15.0%) | 275 (13.5%) | |
| $70,000–$74,999 | 721 (10.9%) | 267 (13.0%) | 988 (11.4%) | 167 (8.2%) | 267 (13.1%) | |
| $75,000+ | 2,510 (38.1%) | 787 (38.3%) | 3,297 (38.1%) | 746 (36.6%) | 784 (38.5%) | |
| < $35,000 | 55 (0.8%) | 15 (0.7%) | 70 (0.8%) | 27 (1.3%) | 15 (0.7%) | |
Related posts:
 A systematic review of family history, race/ethnicity, and genetic risk on prostate cancer detection and outcomes: Considerations in PSA-based screening
 Comparison of outcomes between single-port and multiport retroperitoneal robotic partial nephrectomy
 Trends in the use of immediate postoperative intravesical chemotherapy following transurethral resection of bladder tumors
 Prevalence and management of castration-resistant prostate cancer of unknown metastatic status in the real-world setting: The AfroDiTA study
 Testosterone recovery after androgen deprivation therapy
 Testicular cancer malpractice trends
Stay updated, free articles. Join our Telegram channel

Full access? Get Clinical Tree


