Fig. 10.1
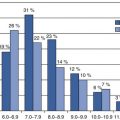
Modifiable and non-modifiable cardiometabolic risk factors (Reprinted by permission from Macmillan Publishers Ltd.: Vlasakakis et al. [3], copyright 2013)
In pharmacotherapy, there is often an apparent disconnect between physicochemical, biological (e.g., protein targets, transporters, enzymes, and pathways), system/patient-specific properties, treatment effects, and long-term clinical outcome. In order to overcome this limitation and to enable optimal treatment for each individual patient, it is important to integrate these different pieces of information into a harmonized approach [4]. Patient safety should here be of utmost priority provided that numerous observational studies have reported that adverse drug events (ADEs) account for a significant percentage of patient hospitalizations and inpatient morbidity and mortality, and they add a significant financial burden to healthcare costs [4]. Adverse drug reactions are often not discovered until late in the drug development process, particularly during phase 3 pivotal clinical trials. Attrition due to drug safety at this stage of development is a multimillion dollar loss to the company but also significantly contributes to the cost of new medicines or therapies to the patient. Even in the case of regulatory approval, ADEs may limit the clinical use of an otherwise efficacious medicine in either parts or the entire patient population. Pharmaceutical companies and regulatory agencies are consequently increasingly challenged to improve their risk-assessment strategies for novel and existing medicines. Mathematical and experimental models support this effort by establishing a strictly quantitative link between drug administration and effect at various levels of biological/organizational complexity (Fig. 10.2), using either a “reductionist” (top-down) or an “integrative” (bottom-up) approach. Top-down approaches usually start at a high level of organization (e.g., the patient level) and become increasingly more complex in order to better understand and characterize the underlying biological system. In contrast, bottom-up approaches start with the “bottom” elements of the organism (e.g., genes or proteins and their known interactions) and work their way up to the patient-phenotype level. Both of these approaches have advantages and limitations. Top-down approaches have usually a drug- and/or patient-centric focus and evaluate exposure-response relationships, i.e., dose/response or pharmacokinetics (PK)/pharmacodynamics (PD), which are then used to define exposure limits, both in terms of efficacy and safety, for acceptable benefit/risk profiles in different patient cohorts. The main limitation of the top-down approach is that the clinical studies used to inform it typically focus only on one or few covariate(s) at a time and thus represent a methodological reductionist approach. Completely mechanistic bottom-up approaches, on the other hand, are network or pathway centric and may face problems with the translation of the vast amounts of data generated into clinically actionable strategies. The advantages and limitations of both approaches have given rise to mechanism-based hybrid approaches, which represent a compromise between the “reductionist view” of the top-down approach and the “elementary view” of the bottom-up approach. They also serve as a link (“link models”) between the next lower and next higher levels of structural complexity and, thus, enable a bidirectional, quantitative flow of information between the different stages of drug development.
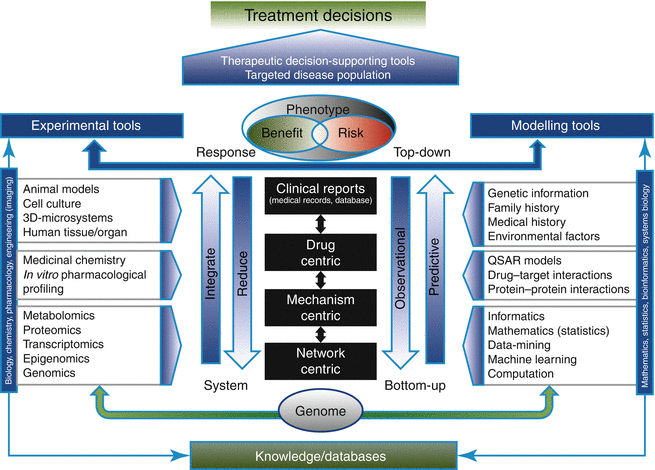

Fig. 10.2
Framework of the vertical integration of top-down and bottom-up approaches and the various levels at which different types of quantitative approaches could be applied (Reprinted by permission from Macmillan Publishers Ltd: Lesko et al. [4], copyright 2013)
Overview of Translational Research
The National Institutes of Health (NIH) defines translational research as the process of applying discoveries generated during research in the laboratory and preclinical studies to the development of trials and studies in humans. This research is directed toward enhancing the adoption of best practices in the community and, thus, toward enhancing the cost-effectiveness of prevention and therapeutic strategies [5]. In simple terms research findings are moved from “bench to bedside” to ultimately support the translation of preclinical and clinical study results into everyday clinical practice and decision making [6]. The importance of translational research is evident from the NIH design centres of translational research, as well as the NIH’s initiation of the Clinical and Translational Science Institute (CTSI) Award program [6]. Translational research enables exchange of ideas and scientific knowledge between disciplines, such as biochemistry, cell biology, genetics, and immunology, as well as between scientists of different backgrounds to further the development of novel and effective therapies. Thus, translational research in essence, can be described as a triad feedback loop between research, investigation, and discovery, clinical trials and finally with medical treatment (Fig. 10.3).
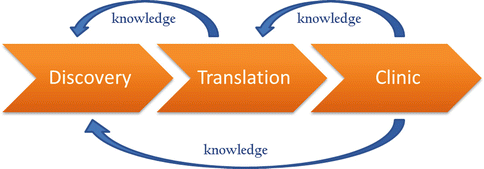

Fig. 10.3
Translational research triad
The American Diabetes Association (ADA) recently published a report on the Standard of Care in Diabetes [7], which focuses on a patient-centred approach balancing choice of pharmacological agents with respect to efficacy, cost, and potential impact on cardiovascular disease. In a separate document, Jain and colleagues [8] reviewed labeling summaries of a vast number of therapeutic products to determine if obesity is a factor that affects drug PK, PD, efficacy, or safety (Table 10.1). Improving the treatment and management of diabetes, its comorbidities and associated complications, is an important focus of pharmaceutical research and development (R&D). Additionally, the assessment of benefit and risk must be the goal when developing a plan for therapeutic interventions [9].
Table 10.1
Review of pharmaceutical product labels listing link with obesity
Description | Drugs |
|---|---|
Obesity listed as a risk factor for cardiovascular adverse events such as CAD, hypertension, MI, and thromboembolic events | Dalteparin, estradiol, estrone, follitropin, fondaparinux, frovatriptan, iloperidone, naratriptan, progesterone, rizatriptan, sumatriptan, synthetic conjugated estrogens, zolmitriptan, FDC (drospirenone, levonorgestrel/ethinyl estradiol, norelgestromin/estradiol, sumatriptan/naproxen), others (etonogestrel implant, conjugated estrogen vaginal cream, ring delivers) |
Obesity listed as risk factor for lactic acidosis | Abacavir, adefovir, emtricitabine, entecavir, lamivudine, metformin, tenofovir, zidovudine, FDC (abacavir/lamivudine, abacavir/lamivudine/zidovudine, lamivudine/zidovudine, pioglitazone/metformin, rosiglitazone/metformin, sitagliptin/metformin, tenofovir/emtricitabine) |
Obesity listed as an adverse event | Atazanavir, dexlansoprazole, efavirenz, fosamprenavir, paroxetine, ritonavir, FDC (crixivan/indinavir, lopinavir/ritonavir) |
Obesity listed as a risk factor for diabetes | Acitretin, asenapine, paliperidone, quetiapine, risperidone, somatropin, ziprasidone |
Impact of obesity or BMI on PK or PK/PD | Cisatracurium, insulin aspart, insulin glulisine, FDC (quinupristin/dalfopristin, insulin lispro [MIX50/50]) |
Obesity listed as a caution without any specifics | Oxymorphone, tapentadol |
Obesity does not change efficacy | Atorvastatin, FDC (amlodipine/atorvastatin) |
Obesity does not change efficacy and safety | Insulin glargine |
Dosage and administration for obesity | Rocuronium |
Obesity listed as a miscellaneous risk factor (i.e., respiratory depression, apnea) | Aripiprazole, buprenorphine (transdermal), somatropin |
Obesity listed as miscellaneous information | Rosuvastatin, valsartan, levothyroxine, sibutramine, thyroid, liothyronine, octreotide |
This chapter presents an overview on the use of quantitative analysis tools for assessing drug efficacy and safety during drug development and regulatory decision-making. Examples of specific model applications at different stages of the development process are also provided.
Role of Quantifiable and Accurate Biomarkers
The predictive performance of the earlier mentioned hybrid models relies to a large extent on the use of biomarkers. The Biomarkers Definitions Working Group (BDWG) defined a biomarker as a characteristic that is objectively measured and evaluated as an indicator of normal biological processes, pathogenic processes, or pharmacological responses to a therapeutic intervention [9]. Thus, a biomarker is a laboratory measurement or clinical phenotype that reflects the activity of a disease process. These markers quantitatively correlate (either directly or inversely) with disease progression. Surrogate endpoints are a subset of biomarkers that are used to establish therapeutic efficacy in registration trials. It is defined as a biomarker that is intended to substitute for a clinical endpoint and is expected to predict clinical benefit or harm or lack of benefit or harm – based on epidemiological, therapeutic, pathophysiological, or other scientific evidence [9].
Further, intermediate biomarkers are routinely used at different stages of the drug development process [10] (Fig. 10.4). For practical implementation of this biomarker classification system, some of the biomarker types may be combined in the context of risk assessment in order to appropriately reflect their position in the causal chain between drug administration and effect. For example, types 2 and 3 are largely reflective of target occupancy and upstream transduction, whereas types 4–6 are reflective of downstream events.


Fig. 10.4
Schematic of in vivo drug effects on the basis of intermediary biomarker responses (With kind permission from Springer Science+Business Media: Danhof et al. [10])
Specifically, biomarkers for diabetes can be categorized according to their turnover half-lives as fast (minutes–hours), intermediate (hours–days), or slow biomarkers (days–weeks). Plasma glucose, C-peptide, and insulin are examples for fast biomarkers, whereas glycated haemoglobin [HbA1c] is considered a slow biomarker. The latter also serves as the clinical surrogate endpoint for glucose-lowering drugs due to its proximity to clinical outcome relative to plasma glucose. Other biomarkers, such as glucagon, dipeptidyl peptidase (DPP)-4 enzyme inhibition, glucagon-like peptide-1 (GLP-1), glucose-dependent insulinotropic peptide (GIP), and other hormones may also be used to make inferences about drug-target engagement. It should be noted at this point that drug-centric models frequently rely on measures of one or few biomarkers, whereas systems pharmacology/network-based models attempt to link biomarkers at different temporal and spatial levels (e.g. plasma cholesterol, fatty acids, blood pressure, heart rate) on a mechanistic/physiological basis.
Role of Quantitative Approaches in Various Stages of Drug Development
Quantitative approaches are a set of particularly valuable tools within the translational medicine arena as they combine computational with experimental methods to elucidate, validate, and apply new pharmacological concepts to the development and use of small molecule and biologic drugs [11]. They also enable the integration of information on a systems level to determine the mechanisms of action of new and existing drugs in preclinical and animal models and to subsequently apply this knowledge to patients.
The drug development process can generally be divided into preclinical and clinical stages. These stages are tightly interlinked as the information gathered during one phase is carried forward into the next to gain confidence in the drug’s ability to treat a certain disease, in other words to de-risk the drug for the patient by reducing uncertainty. Despite the fact that a drug typically passes through one development phase at a time, the process of “learning and confirming” is by no means linear. Lessons learned during one phase may feed back into the development stream to inform the next steps to be taken for the drug(s) in the development pipeline. Mathematical and statistical models are ideally suited to serve as the knowledge platform for this “learn, confirm, and apply” cycle as they allow the integration of the available information into a single, unifying approach [12] (Fig. 10.5). To avoid late-stage development failures in large and expensive clinical trials, it is imperative to learn as much as possible about a particular drug candidate as early as possible in the discovery and development process. The identification of the correct target for a given disease is consequently critical, followed by the optimization of lead compounds as well as preclinical proof of concept, PK/PD, and safety-toxicity studies. As a drug candidate traverses from preclinical to clinical stages (see Fig. 10.5), there is a high degree of uncertainty surrounding the probability of success at the preclinical stage. Very little is known about the drug and its potential effect in the disease area at this point. To build the knowledge base and enhance predictability at each step of the drug development process, quantitative tools are employed to analyze and interpret experimental data. System, (semi-)mechanistic, empirical, and trial-outcome models are developed to describe various aspects of the physiology, sites, and mechanisms of drug action and probability of success of a clinical trial, as well as treatment outcomes and patient-benefit analysis.
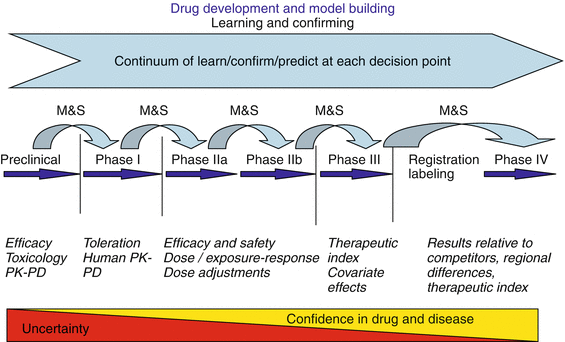

Fig. 10.5
Predictive model-guided preclinical and clinical drug development (M&S: Modelling and Simulation) (Reprinted by permission from Macmillan Publishers Ltd: LaLonde et al. [12])
Within the purview of translational research, physiologically and mechanism-based models have gained momentum in the pharmaceutical drug development arena. During the translational phase of development, the choice of animal models for a particular disease is important. This is often dependent on the mechanism of action of the pharmacological agent and known interspecies differences in target expression and biomarker response [13, 14]. Disease progression models, for example, enable the understanding of the pathophysiology of the disease and the impact of treatment interventions. Alternatively, disease processes can also be characterized based on a complete mechanistic description of the biological system, starting at the molecular/tissue level [15, 16].
System-Centric Modelling
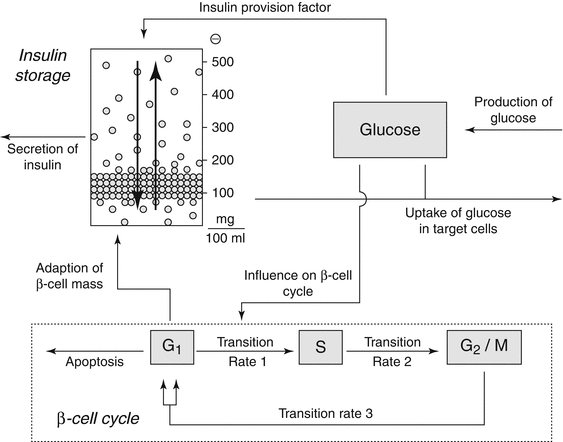
In diabetes drug development, quantitative approaches have been applied to identify the relationship between glucose, insulin, glucagon, β-cell cycle dynamics, incretin-responsive insulin secretion, homeostatic feedback conversion of glycogen and glucose in the liver, with the interplay between different organs at the whole-body level. To this end, a system-centric model was developed to describe the pancreatic β-cell cycle and impact of glucose challenge on insulin production as shown in Fig. 10.6 [17]. In this model, the β-cell cycle is characterized by a three-compartment model,
![$$ \begin{array}{c}{G}_1(t)=2p3{G}_2/M(t)\\ {}\hbox{--} \left[p1\left[1+p5G(t)\right]+p4\right]\times {G}_1(t)\end{array} $$](/wp-content/uploads/2016/10/A309434_1_En_10_Chapter_Equ1.gif)
![$$ S(t)=p1\left[1+p5G(t)\right]{G}_1(t)-p2S(t) $$](/wp-content/uploads/2016/10/A309434_1_En_10_Chapter_Equ2.gif)

where the factor 2 in Eq. 10.1 accounts for cell division in the transition from G 2 /M to G 1-phase. Under physiological conditions, the β-cell cycle is very slow in adults but can adjust to metabolic demands. Changes in glucose levels (Eq. 10.2) drive the transition rate p1 from G 1– to S-phase and, thus, regulate the β-cell cycle. The way glucose stimuli are handled here has wide-ranging implications on the overall system. For example, if the system is triggered by increased glucose concentrations, and neither immediate release of stored insulin nor enhanced insulin provision is able to normalize blood glucose levels, it will respond by accelerating the cell cycle.

Fig. 10.6
Schematic concept of Gallenberger et al. [17] model. Glucose enters the system at a constant production rate mainly by the liver. Elevated blood glucose levels lead to immediate release of stored insulin and an enhanced provision of insulin. Also, glucose influences the transition rate between phases G1 and S of the cell cycle. Insulin regulates the uptake of glucose in target cells. The molecules are stored in packets with different release thresholds. These packets can be redistributed within the storage (Reprinted with permission from Gallenberger et al. [17]. This is an open access article distributed under the terms of the Creative Commons Attribution License (http://creativecommon.org/licenses/by/2.0), which permits unrestricted use, distribution, and reproduction in any medium, provided original work is properly cited)
![$$ \begin{array}{c}{G}_1(t)=2p3{G}_2/M(t)\\ {}\hbox{--} \left[p1\left[1+p5G(t)\right]+p4\right]\times {G}_1(t)\end{array} $$](/wp-content/uploads/2016/10/A309434_1_En_10_Chapter_Equ1.gif)
(10.1)
![$$ S(t)=p1\left[1+p5G(t)\right]{G}_1(t)-p2S(t) $$](/wp-content/uploads/2016/10/A309434_1_En_10_Chapter_Equ2.gif)
(10.2)

(10.3)
Similarly, glucose transport in pancreatic islet β-cells is thought to set metabolic thresholds and serves as a therapeutic target in diabetes as shown in Fig. 10.7 [18]. Under normal conditions, there is limited glucose transport across the plasma membrane of β-cells. The model identified a metabolic threshold that limits intracellular glucose-6-phosphate production by glucokinase. Thresholds are of general importance in disease systems analysis because they allow a system to maintain balance and function properly within certain physiological limits. The maintenance of these thresholds is typically accomplished via homeostatic feedback control. Once a system becomes unresponsive to a stimulus, such as elevated glucose concentrations even with the release of insulin, it progressively spins out of control resulting in β-cell dysfunction and loss of glucose-stimulated insulin secretion.
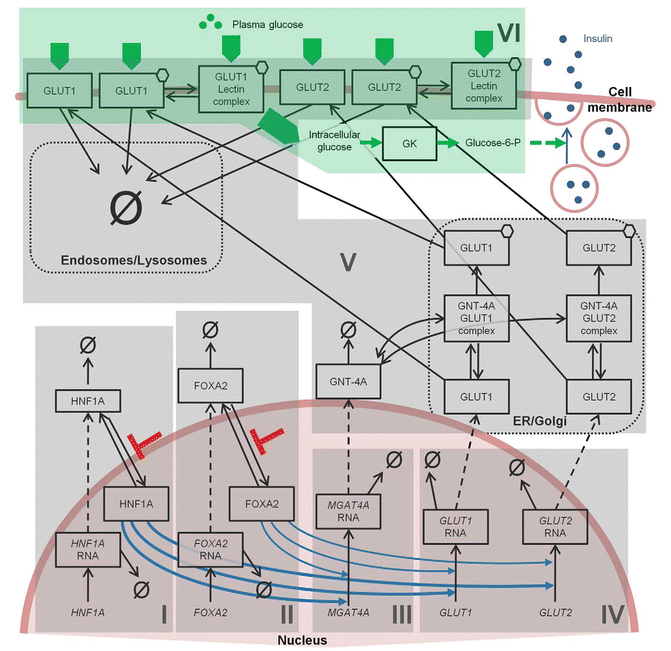

Fig. 10.7
Conceptual model by Luni et al. [18] depicting the various signaling steps involved in the secretion of insulin at the cellular level (Reprinted with permission from Luni et al. [18]. Copyright: 2012 Luni et al. This is an open access article distributed under the terms of the Creative Commons Attribution License, which permits unrestricted use, distribution, and reproduction in any medium, provided the original author and source are credited)
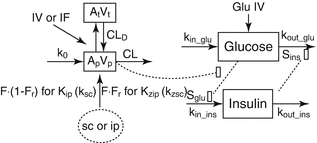
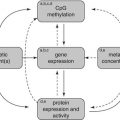
Figures 10.8 [19] and 10.9 [20] present further examples of system-centric models that are intended to describe a network of processes responsible for maintaining glucose homeostasis. The model presented in Fig. 10.8 developed by Jauslin et al. [19] represents an integrated glucose-insulin model that integrates the sequence of insulin secretion, glucose-insulin feedback, and natural control mechanisms (see Fig. 10.8), whereas Fig. 10.9 focuses on the various physiological processes contributing to glucose homeostasis on a cell and organ level. In this spatial representation of glucose homeostasis, green arrows depict pathways that have already been incorporated into currently available models, whereas red arrows pinpoint to pathways where these models could be expanded. While Figs. 10.8 and 10.9 focus either on the temporal or spatial characterization of the system, Fig. 10.10 represents a combination of the two [21]. This model places the mechanisms responsible for glucose homeostasis in a whole-body context, which then allows to accounting for the route of intake as well as elimination of glucose. Ultimately, these models are intended to reflect the clinical situation as close as possible and may serve as a virtual patient for hypothesis testing and generation in the future.
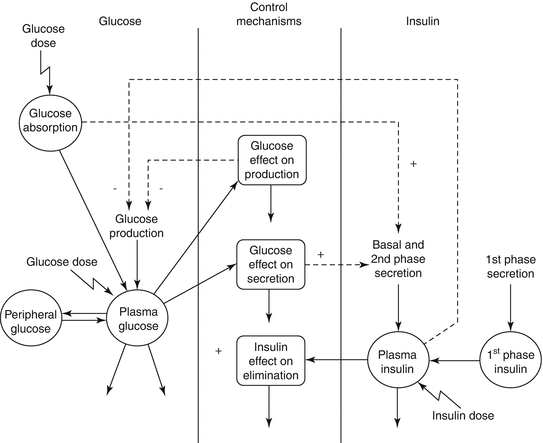
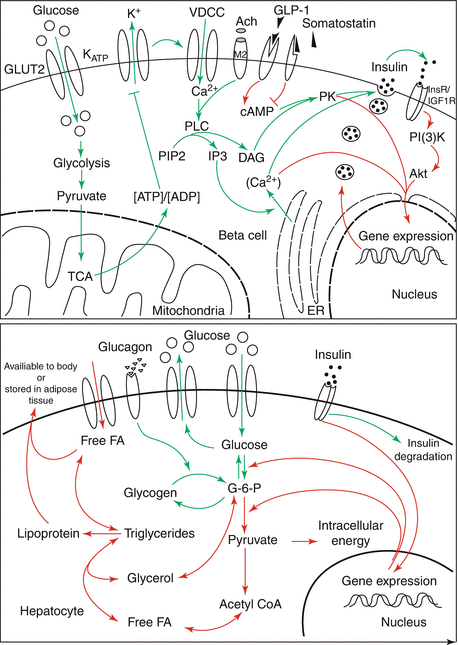
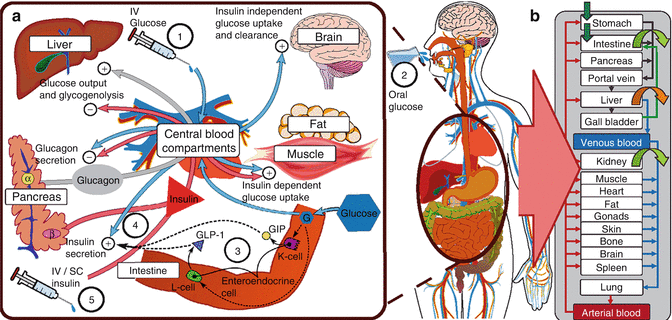


Fig. 10.9
Schematic representing the current stage of quantitative modelling to describe the various signalling mechanisms (Reprinted with permission from Ajmera et al. [20]. Copyright © 2013 American Society for Clinical Pharmacology and Therapeutics)

Fig. 10.10
(a) Multi-organ pharmacodynamic interaction of glucose and insulin (b) Whole-body physiological modelling with organ-level integration. IV intravenous, SC subcutaneous, GLP glucagon-like peptide, GIP glucagon inhibitory peptide (Reprinted with permission from Schaller et al. [21]. Copyright © 2013 American Society for Clinical Pharmacology and Therapeutics)
Mechanism-Centric Modelling
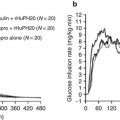
Once the mechanism and site of drug action is determined, the focus of preclinical modeling and simulation shifts toward gaining confidence in the drug effect(s), both in terms of efficacy and safety, and the establishment of a dose-response relationship. Once established and qualified, such mechanism-centric models allow for comparing and contrasting multiple drug candidates within the same drug class or with similar mechanisms of action. This enables the identification of lead compound with desirable therapeutic properties alongside with an opportunity to identify key rate-limiting steps, which aids decision making at the next juncture in the development process, e.g., when switching from preclinical to clinical development. In addition, these models are frequently used to evaluate the impact of disease progression on the underlying biological system and its ability to respond to therapeutic interventions. Cao et al. [22] developed a mathematical model to describe the PK and PD of a GLP-1 agonist following parenteral route of administration. GLP-1 agonists are incretin mimetics that enhance glucose-dependent insulin secretion (Fig. 10.11). Models like these can be beneficial not only to characterize the drug effect but also to evaluate the impact of factors such as routes of administration, formulation, organ impairment, etc. on the PK/PD of the drug.

