9.1 Introduction
Principles of the assessment of overnutrition
Overnutrition can apply to energy, the individual components of energy and the micronutrients. In the case of individual components of energy, some are considered in the present chapter (sugar and fat), while others are considered elsewhere in this book in relation to diseases such as cancer (Chapter 21) and cardiovascular disease (CVD; Chapter 19). The public health impact of overnutrition in relation to micronutrients is generally confined to voluntary or mandatory fortification of foods or the use of food supplements (see Chapter 16 in Nutrition and Metabolism). The primary dietary interest is energy overnutrition and that is the focus of this chapter.
In practice, it is much easier to measure the degree of weight gain and excess weight and the health consequences thereof than to measure directly energy intake in relation to energy expenditure. This is because the methods to assess total daily energy intake and expenditure are usually crude and subject to many forms of bias (see Chapter 10 in Introduction to Human Nutrition). Therefore, the degree of overnutrition is usually defined by the degree of overweight or obesity in an individual. Obesity refers to a state where excess fat is stored in adipose tissue but, again, in public health settings this is usually impossible to measure directly and so relatively crude anthropometric measures must be used.
Anthropometric measures are the most commonly used to classify body weight. Alternatives to anthropometry, such as biological impedance measurements or dual-energy X-ray absorptiometry, are sometimes used in population studies and these allow for the measurement of components of body composition such as fat mass and fat-free mass (see Chapter 2 in Introduction to Human Nutrition). However, these procedures are certainly not carried out routinely, and internationally accepted criteria for the classification of the degree of obesity measured by these methods do not exist.
Principles of anthropometric classification of overweight and abdominal fatness
International classifications for the degree of overweight are based on the body mass index (BMI) or Quetelet’s index (Table 9.1). This measure is calculated by dividing weight (in kilograms) by height squared (height in meters). Definitions of the degree of overweight and obesity allow international comparisons of prevalence rates. Minimal mortality rates are mostly seen in the healthy range of BMI until the age of 60 years. Overweight subjects are at increased risk of morbidity and should avoid further weight gain. Weight loss in this category is recommended when other risk factors for disease are present. Severely overweight or obese subjects are at increased risk of disease irrespective of the presence of other risk factors and weight loss is recommended for all. From an international perspective, it should be noted that the health implications of a given level of BMI with respect to body fatness and fat distribution may vary across populations. Asian populations, for instance, have a higher absolute risk for the onset of type 2 diabetes mellitus than Caucasian populations at the same level of BMI. Therefore, population-specific interpretations of the definitions for obesity remain a possibility.
Other anthropometric measures, based on body circumferences, are also used in this area. One of these measures is the ratio of waist circumference to hip circumference, the waist/hip ratio (WHR), which is an indicator of fat distribution rather than the amount of total body fat. The WHR seems to be difficult to interpret, particularly in the elderly population. A high WHR in the elderly could reflect a high waist circumference but also a decreased hip circumference. The hip circumference could decrease as a consequence of the decreased lean body mass that is often seen with aging. The WHR is often misinterpreted as a measure of abdominal fat only. The amount of abdominal fat is estimated with greater precision by the waist circumference alone. Some researchers have suggested action levels for large waist circumference to replace BMI and WHR (Table 9.1). The waist circumference is measured at the level midway between the lower rib margin and the iliac crest (lateral, upper part of the pelvic bone) with participants in a standing position. The correlation between waist circumference and stature is low enough to ignore adjustment for body height in the age category 20–60 years. The action levels appear to be appropriate for identifying subjects who have cardiovascular risk factors, type 2 diabetes or shortness of breath when walking upstairs. However, others have noted that the criteria underlying the waist action levels have been based on arbitrary levels of the WHR, and that the evaluations with respect to risk have been based on cross-sectional data. Therefore, the cut-off points (or action levels) for the classification of waist circumference are still under debate. Ideally, consensus regarding action levels should be reached by the use of longitudinal data relating waist circumference levels to minimal mortality, morbidity and disability rates. Owing to the relatively recent introduction of the possible use of the waist circumference, such analyses are not widely available.
Table 9.1 Definitions of body mass index (BMI)a and waist circumferenceb categories
| BMI (kg/m2) | ||
| Underweight | <18.5 | |
| Normal weight | 18.5–24.9 | |
| Moderate overweight | 25.0–29.9 | |
| Overweight | ≥25.0 | |
| Preobese | 25–29.9 | |
| Obesity | ≥30.0 | |
| Obese class I | 30–34.9 | |
| Obese class II | 35–39.9 | |
| Obese class III | ≥40.0 | |
| Waist circumference | ||
| Men | Women | |
| Above action level 1 | ≥80 cm (~32 inch) | ≥94cm (~37 inch) |
| Above action level 2 | ≥88cm (~35 inch) | ≥30cm (~40 inch) |
a BMI categories are defined according to the WHO guidelines.
b Waist circumference categories are suggested by Lean et al.
Prevalence of and trends in overweight
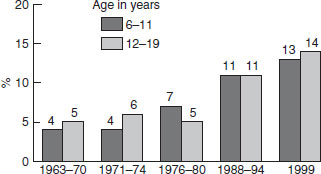
Secular trends in obesity worldwide (BMI ≥30) are given in Table 9.2. In every geographical location for which there are data, a rise in the incidence of obesity has been observed. The rise has affected both men and women, and is evident at the extremes such as Japan and China with relatively low levels of obesity and western Samoa with high levels of obesity. Some 10% of women in sub-Saharan Africa are overweight, rising to over 40% in the former Eastern European states and in the Middle East. The extent of overweight and obesity in 10-year-old children in selected European countries is shown in Figure 9.1. The secular rise in obesity in US children aged 6–11 and 12–19 years is shown in Figure 9.2. In the 25 year period between 1976 and 1999, overweight doubled in 6–11-year-olds and trebled in the adolescent years. It is clear from all these data that rising obesity is a global issue.
Table 9.2 Secular trends in obesitya worldwide (%)
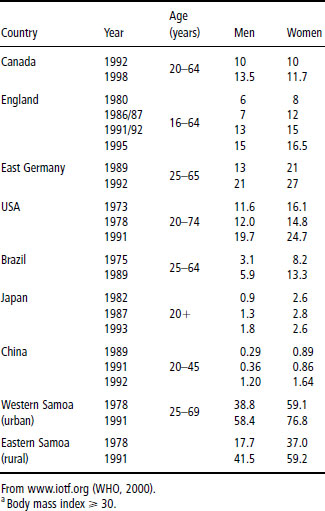
Figure 9.1 Prevalence of overweight and obesity in 10-year-olds in selected European countries. Data collected by International Obesity Task Force (IOTF) from recent surveys. Reproduced with permission from the IOTF (www.iotf.org).
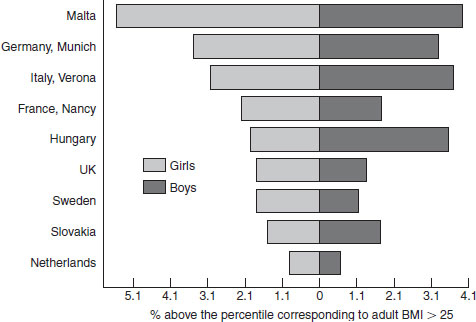
Figure 9.2 Secular trends in overweight in children (6–11 years) and adolescents (12–19 years) in the USA from the early 1960s to the late 1990s. Excludes pregnant women starting with 1971–74. Pregnancy status not available for 1963–65 and 1966–70. Data for 1983–85 are for children 6–11 years of age; data for 1966–70 are for adolescents 12–17 years of age, not 12–19 years. Source: CDC/NCHS, NHES and NHANES. From www.aos.org. Reproduced with permission from Annals of the New York Academy of Science.
9.2 Macronutrients, excess energy intake and overweight
Fat intake
Obesity results from an imbalance between energy intake and energy expenditure. Relative excessive energy intake can result from excess fat intake. Fat yields more energy per gram (38 kJ/g) than carbohydrate (17 kJ/g) or protein (17 kJ/g). Because diets high in fat are usually energy dense and palatable, a diet relatively high in fat usually leads to a passive increase in energy intake. In addition, it has been proposed that fat intake is less well metabolically regulated than carbohydrate intake. During the past few decades much emphasis has been placed on decreasing dietary fat intake in an attempt to reduce the obesity epidemic. More recently, this has led to a debate on the merits of reducing fat intake in the management of obesity. The arguments are as follows.
- There seems to be a consensus, that total energy intake is the most important determinant of body weight, together with total energy expenditure.
- Dietary fat is a very rich source of dietary energy and consequently a high intake of dietary fat intake is likely to increase body weight by passive overconsumption of energy.
- It has been argued that storage of fat is very efficient, supporting the important role of fat intake in increasing body weight.
However, two other issues should be discussed.
- Isocaloric/ad libitum trials: trials in which high-fat diets were substituted by low-fat diets while total energy intake remained constant (isocaloric trials) suggest that such substitutions do not lead to additional weight loss. However, most ad libitum studies in which subjects were allowed to vary total energy intake did show beneficial effects on body weight when the percentage of energy from fat was reduced. A metaanalysis on 10 ad libitum trials showed that an average reduction of 10 energy percent from fat was associated with a weight loss of about 3 kg. It should be noted that ad libitum trials reflect the free-living situation more closely than do isocaloric trials.
- Intake of saturated fat versus unsaturated fats: studies in which subjects managed to decrease their dietary fat intake and decrease body weight have demonstrated unfavorable profiles of serum triacylglycerols and high-density lipoprotein (HDL)-cholesterol when unsaturated fat intake is too low. Based on this finding, changing the message of “decreasing fat intake” to “substituting saturated fat with unsaturated fat” seems warranted and may be important in improving the cardiovascular risk profile. However, as the energy content of saturated and unsaturated fats is the same, this advice is unlikely to reduce body weight. Long-term trials lasting for more than a year are lacking.
It can be concluded that body weight is likely to decrease when fat intake is replaced by carbohydrates, especially when these food products are rich in fiber. It is clear that this must be accompanied by sufficient levels of physical activity.
Carbohydrate type (sugar, glycemic index and fiber)
Sugar, glycemic index (GI) and fiber are considered in turn, although there is significant overlap between these factors within foods.
Sugar in foods
Related posts:

Stay updated, free articles. Join our Telegram channel

Full access? Get Clinical Tree


