Fig. 1
Normal prostate zonal anatomy demonstrated with FSE T2 weighted endorectal 3 T MRI. (a) Coronal image (the letters along with the arrows correspond to the level of slices used in images b–f), (b) axial image at the level of seminal vesicles, (c) the base of prostate (white arrows show ejaculatory ducts), (d) mid gland, (e) apex, (f) membranous urethra (g) parasagittal and (h) midsagittal. (i) T1 weighted image demonstrating a homogenous intermediate signal, white arrows point to neurovascular bundles. B urinary bladder, T transition zone, P peripheral zone, SV seminal vesicles, R rectum with endorectal coil, AFS anterior fibromuscular stroma, asterisk levator ani muscle, U urethra, PB pubic bone
Role of 3 T mp-eMRI inProstate Cancer
Multiparametric MRI of prostate using a high field strength magnet can provide pertinent information about location, volume, aggressiveness and staging of prostate cancer. These findings can then be used for biopsy guidance and can also help substantially in making informed decisions regarding the choice for optimal management of PCa.
Localization and Tumor Volume Estimation
Accurate detection of the exact location of cancer within the prostate contributes significantly to patient care. It has been found that using any two functional sequences in addition to T2WI improves detection; however the addition of a third functional sequence to improve prostate cancer detection is uncertain [30]. Using all three functional sequences (DWI, DCE-MRI and MRSI) in addition to T2WI has been shown to achieve a positive predictive value of 98 % in experienced hands [31] (Fig. 2).


Fig. 2
Localization of prostate cancer using multiparametric MRI combining T2WI, DWI and DCE. (a) T2 weighted image shows hypointense lesion in right peripheral zone (arrow). (b) Corresponding ADC map shows restricted diffusion with low ADC in tumor compared to normal peripheral zone. (c) A color coded map obtained with DCE-MRI overlaid on T2WI shows marked enhancement in the same region, as well as hypervascularity in central gland
While detection of prostate cancer using mp-MRI is mostly effective for large and high grade tumors, sensitivity for small Gleason 6 tumors as well as sparse tumors (malignant tissue intermixed with more than 50 % normal PZ tissue) has been shown to be lower [31, 32]. Moreover, careful interpretation of mp-MRI should be done in patients with multiple negative biopsies and increasing PSA levels for tumors in the TZ and those located anteriorly, as these areas are less frequently sampled during TRUS biopsy. T2WI findings supporting the presence of TZ tumors include homogenous low signal intensity, ill-defined margins, lack of capsule, interruption of surgical pseudocapsule (TZ to PZ boundary of low signal intensity), lenticular shape and invasion of the urethra or anterior fibromuscular stroma [33]. Nevertheless, for detection of TZ lesions the sensitivity and specificity of mp-MRI is 88 % and 86 %, respectively [35]. Tumor detection may be hampered by post-biopsy hemorrhage (Fig. 3), leading to over or underestimation of tumor presence and extent. A delay of 6–8 weeks is recommended between biopsy and MRI [35–37]. This prolonged hemorrhage may be attributed to high levels of citrate in the prostate, which has anticoagulant properties [38].
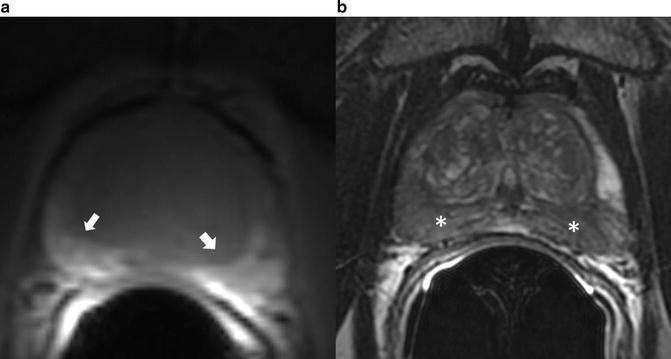

Fig. 3
Post-biopsy hemorrhage (a) T1 weighted image showing hyperintense areas (arrows) in the peripheral zone. (b) T2 weighted image shows hypointense (asterisk) lesions in the same region. This is indicative of post-biopsy hemorrhage
Also, tumor volume estimation by multiparametric MRI has been shown to closely correlate with histopathological findings following radical prostatectomy. Such information about the spatial location along with the tumor volume may become important for evolving concepts of focal treatments with directed brachytherapy.
Aggressiveness
Characterization of biological aggressiveness of detected lesions is ideal for clinical decision making. An inverse correlation has been widely reported between the Gleason score and ADC values from DWI. The ADC values in addition to characterization of aggressiveness can also be helpful in assessing interval change in a tumor. However, as there is substantial inter-patient variation in ADC values of normal PZ, it has been recently shown that when the background ADC values of benign PZ are taken into consideration, there is a significant improvement in the ability to discriminate among different Gleason scores.
DCE-MRI quantitative parameters have not been shown to correlate with tumor grade or vascular growth factor (VEGF) expression as a molecular marker of angiogenesis [39]. Meanwhile, MRSI has been found to have higher sensitivity of 89.5 % for detection of Gleason 8 and above tumors compared with a sensitivity of 44.4 % for Gleason 6 tumors [40].
Staging
The use of endorectal coil in conjunction with pelvic coil regardless of the magnetic field strength has been proven to be superior for the assessment of extraprostatic extension when compared to use of pelvic coil alone (Fig. 4). Criteria for detecting extraprostatic extension includes NVB asymmetry, gross tumor surrounding the NVB, a tumor-capsule interface of more than 1 cm, obliteration of the rectoprostatic angle, irregular or speculated margin and a breach of the capsule with direct evidence of tumor extension. Seminal vesicle invasion is demonstrated on T2WI as focal low signal-intensity seminal vesicle, enlarged low signal-intensity seminal vesicles or ejaculatory ducts, obliteration of the angle between the prostate and SV and direct extension of tumor from prostate base into the SV. Accuracy of MRI in prostate cancer staging has been shown to range from 54 to 93 %, which has led to concerns about inter-observer variability.
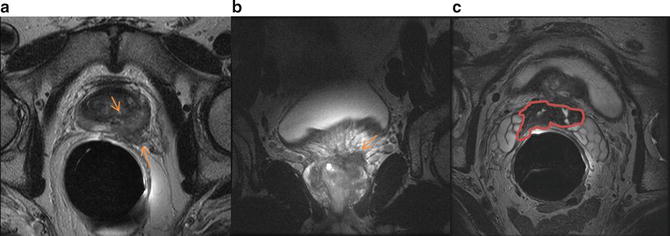

Fig. 4
Prostate cancer with extraprostatic extension. (a) Axial and (b) coronal T2 weighted images demonstrate extraprostatic extension in the left lateral base invading left neurovascular bundle. There is also seminal vesicle invasion (marked in red) as seen on axial T2WI obtained more superiorly (c)
MRI and CT have shown equivocal efficacy for lymph node metastasis, with both having low sensitivity. Recently, MRI with lymphotropic superparamagnetic iron oxide nanoparticles has shown considerable promise in occult lymph node metastases detection.
Prostate Biopsy: Current Status and Limitations
Grey scale TRUS guided systematic needle biopsy is currently the accepted standard for histologic prostate cancer diagnosis in men considered at high risk for prostate cancer on the basis of DRE and PSA findings. Hodge et al. first described the sextant prostate sampling technique using ultrasound, in which six samples were obtained, three from each left and right lobes in equally spaced regions from apex, mid and base along a parasagittal line drawn midway between the lateral border and the midline of the prostate gland [41]. To improve the diagnostic yield the sextant technique has undergone modifications with inclusion of more cores. Biopsies with 8, 10 or 12 cores from PZ have resulted in improved prostate cancer detection [42, 43]. The concept of increasing numbers of cores has been taken further with saturation biopsies, in which 20 or more cores are obtained. Saturation biopsy does not offer an additional benefit as an initial biopsy technique, but it may serve as a follow-up strategy in patients with negative initial biopsy findings and increasing PSA. Sampling of TZ has been controversial, with a few studies claiming benefit while others have concluded that it is of limited benefit [42, 44, 45].
The regular grey-scale TRUS biopsy has limited specificity and sensitivity for prostate cancer detection as it is unable to detect isoechoic neoplastic lesions. Therefore, grey scale US does not have the ability to differentiate a significant proportion of prostate cancers from normal-appearing parenchyma. Alternative US modalities and approaches have been employed to try to correct this defect in grey scale US imaging, including color Doppler, Power Doppler with and without intravenous contrast administration, and sonoelastography [46]. Advanced US techniques have been addressed in this book, including techniques such as quantitative US and sonoelastography. Many of these techniques are still limited in use and it is fair to say that none of these alternative techniques have demonstrated sufficient sensitivity in every day clinical use to justify its substitution for the standard technique [47].
The ability to perform US via a transrectal approach is an obvious advantage in terms of acquiring high resolution grey scale images. Prostate biopsy in patients who have undergone a complete proctocolectomy and diverting ileostomy must be done using alternative approaches. The most commonly used is the transperineal approach. Alternative approaches in this patient group include image-guided (computed tomography, ultrasound, or MRI) transperineal biopsy or transurethral resection of the prostate, with its limitation of obtaining tissue mostly from the TZ [48–50]. Transperineal prostate biopsy utilizing transrectal ultrasound guidance will be addressed later in the book in the chapter on Prostate Biopsy and Prostate Cancer Staging.
Limitations of Grey Scale Ultrasound and the Transrectal Approach to Prostate Biopsy
There are several factors which limit the effectiveness of prostate cancer diagnosis by TRUS biopsy.
1.
Serum PSA is one of the triggers for prostate biopsies, the other being positive DRE. PSA is an imperfect biomarker for the detection of prostate cancer and leads to unnecessary biopsies. Many benign conditions, such as benign prostatic hyperplasia, acute or chronic prostatitis, also cause elevation of PSA. Also, when the accepted threshold of 4 ng/mL is used for defining abnormal serum PSA, 15 % of cases are found to have prostate cancer with a serum PSA level of 4 ng/mL or less [52].
2.
TRUS biopsy has a low sensitivity ranging from 39 to 52 %, although its specificity is approximately 80 % [52]. Due to high false negative rates, repeat biopsies are required. The rate of prostate cancer detection ranges from 22 to 28 % on initial biopsy. This falls to 10–17 % at second biopsy and 5–15 % at third biopsy [52–54].
3.
Sampling errors and inability to localize clinically significant lesions by transrectal ultrasound results in inaccurate Gleason score following TRUS biopsy. Upgrading of Gleason score in prostatectomy specimens occurs in 25–42 %, while downgrading occurs in 14 % of cases [55].
4.
21 % of tumors are located in the anterior part of the prostate (Fig. 5) [56]. Utilization of transperineal approaches for biopsy has demonstrated that significant anterior based tumors may be diagnosed. The anterior part of the prostate is under sampled when biopsies are performed by a transrectal approach. In patients who underwent MRI guided biopsy after a previous negative TRUS guided biopsy, anterior tumors were found in 47–57 % of cases [54, 57]. Similarly, in patients undergoing transperineal prostate biopsy with TRUS guidance anterior tumors were found in 17 % of men who had undergone prior transrectal approaches [58].
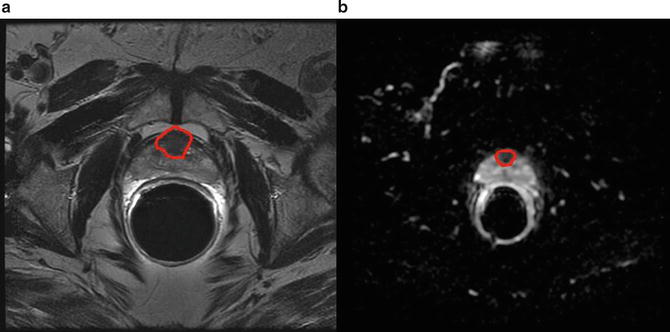

Fig. 5
Anterior tumor. (a) Homogenously hypointense lesion seen on T2 weighted image in the anterior portion of the central gland with (b) corresponding low ADC values as seen on ADC map
Use of MRI for Prostate Biopsy
The above listed limitations of TRUS guided biopsy accentuates the need for alternative image guided systems capable of detecting, localizing and targeted sampling of regions indicative of prostate cancer. Detection of prostate cancer utilizing mp-MRI, which has a sensitivity ranging from 60 to 96 %, offers a major improvement over transrectal ultrasound, which has a reported sensitivity of 39–52 % [52, 59]. The following are the different techniques used for MRI guided biopsies.
Cognitive Fusion
In a cognitive fusion biopsy, significant lesions that appear on previously reviewed MRI are targeted during TRUS guided biopsy. Such sampling of targeted lesions in addition to the systematic biopsy does appear to yield improved accuracy. However, it is subject to potential human error in overlaying MRI findings over real-time TRUS.
MRI Guided Biopsy
In MRI guided biopsy, targeted sampling of the prostate is done under real-time MRI. This has been made feasible due to the relative decrease in the time required to perform MRI, development of MRI-compatible biopsy needles and targeting mechanisms, and advanced visualization tools for guiding and verifying needle placement.
MRI guided biopsy is performed in low-field strength open systems or in closed-bore 1.5 or 3 T MRI [53, 54, 60, 61]. Low-field strength modalities offer easy access to the patient, while closed-bore systems have a higher SNR allowing increased spatial resolution. Transperineal and transgluteal approaches have been used utilizing the open MRI platform, while a transrectal approach has been used in most studies with a closed-bore MRI platform. Using MRI guidance for prostate cancer detection yields rates of cancer detection ranging from 38 to 59 % [52, 54, 61, 62]. The disadvantages of this method include increased expenses, as two MRI scans are required, and the time required; the reported duration has varied from 30 to 90 min [54].
Robot-assisted MRI guided biopsy is currently under evaluation for use in guided biopsies and it may increase the accuracy of needle placement in the prostate gland. The robot is constructed of nonmagnetic and dielectric materials, which allows it to be fully operational in a magnetic resonance imaging suite. In recent years, various MRI-compatible robotic intervention systems have been introduced. The first commercially available robot assisted MRI guided system (Innomotion; Innomedic, Herxheim, Germany) was recently evaluated in a cadaver study for MRI guided transgluteal biopsies [63].
MRI-US Fusion Biopsy
MRI-US fusion offers an alternative to targeted prostate biopsies. The fusion of two imaging modalities is due to advances in coregistration of previously acquired MRI and real-time TRUS. The techniques for fusion were primarily developed for brachytherapy. The early systems were limited by prostate motion, resulting in loss of accuracy. Since then other techniques have been developed to overcome this problem.
In MRI-Fusion biopsy, first a multiparametric endorectal MRI is done; the studies are then loaded into software that allows the radiologist to mark the prostate gland and the regions of interest for biopsy in different slices and views of the MRI, known as segmentation (Fig. 6). This information is then loaded onto the device. The second step involves real-time MRI-TRUS fusion to create a three-dimensional real-time reconstruction of the prostate on which the aiming and tracking of biopsy site is done. This technique can be done in an outpatient setting under local anesthesia within a few minutes. Currently five devices approved by the FDA are available for MRI-TRUS fusion biopsy. The Artemis device (Eigen, GrassValley, California, USA) has a mechanical arm with ultrasound transducer probe and is capable of tracking and recording biopsy locations.
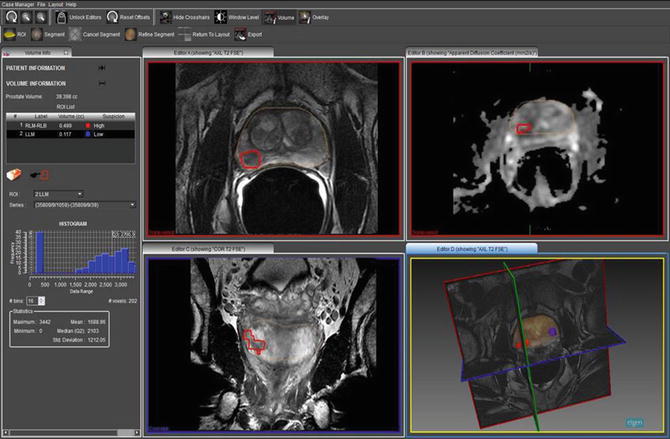

Fig. 6
A screenshot from ProFuse software showing a segmented prostate with a region of high suspicion for prostate cancer marked on the right base to mid gland showing restricted diffusion on the corresponding ADC map. Also a three dimensional model of the prostate with the regions marked is shown
The real-time fusion on Artemis steps are as follows:
1.
Scan—Using an ultrasound system connected to the Artemis, a 360° scan of the prostate is done. The Artemis converts the conventional two dimensional ultrasound scan into real-time 3D along with views in different planes—coronal, transverse, and sagittal. Image segmentation computes prostate gland boundaries and volume.
2.
Plan—The planning module allows any of the following plans:
(a)
MR-TRUS Fusion—Segmented data of the prostate gland obtained from MRI with marked regions of interest on multiparametric-MRI is loaded onto Artemis before the procedure. During the procedure non-rigid registration is done with mapping of regions of interests from MRI to TRUS and overlaid in real-time. Regions of interest to biopsy are selected.
(b)
Get Clinical Tree app for offline access

Conventional 6-core or 12-core plans are computed and fitted to gland shape (Fig. 7a).
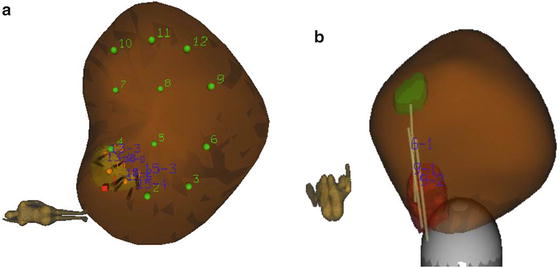

Fig. 7


Biopsy site planning and tracking (a) A brown colored three dimensional model of prostate created by fusion of MRI and US on Artemis and an automatically generated 12 core systematic biopsy plan is overlaid in addition to a region for targeted biopsy. (b) Recorded locations of targeted cores from two separate regions of interests are shown as light brown cylinders
Stay updated, free articles. Join our Telegram channel

Full access? Get Clinical Tree


