Principles of Screening in Older Adults: Introduction
This chapter focuses on the topic of screening, particularly the issues that need to be considered when making a decision to screen an older person for cancer. This decision highlights many of the special philosophical and practical challenges inherent in recommending preventive services to older persons. One obvious challenge to recommending cancer screening (and many other preventive services) to older adults is that few studies of preventive interventions have enrolled persons older than age 75 years. The absence of age-specific data requires clinicians to extrapolate data about the effectiveness of screening in younger persons and apply it to older persons. Furthermore, even if trials suggest that the effectiveness of screening is similar in younger and older populations, challenges remain about how to apply data from trials to an individual older person. Trials show the average effectiveness of an intervention, but they generally do not address individual patient characteristics, such as comorbid conditions or functional status, which may change the likelihood of receiving benefit or harm from screening. Given these challenges, the need to individualize screening decisions is especially important for older people, because individuals become increasingly unique in their particular combination of health, function, remaining life expectancy, and values with advancing age.
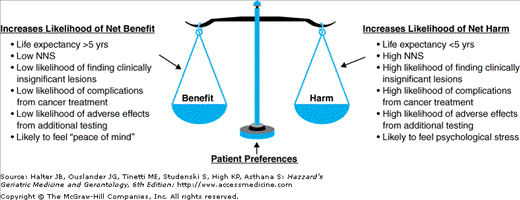
The important issues that need to be considered when making individualized screening decisions in elderly persons are not fully addressed by current guidelines. Although many screening guidelines that used to recommend upper age limits for stopping screening are now recommending screening an older person if the individual has a “reasonable life expectancy,” current guidelines offer little guidance about how to estimate life expectancy or how patient preferences should factor into screening decisions. This chapter outlines a systematic framework for individualizing cancer screening decisions in older adults that includes consideration of an individual’s life expectancy and the individual’s preferences regarding the potential benefits and harms of screening (Figure 14-1).
Figure 14-1.
The benefits and harms that need to be weighed when making informed cancer screening decisions. Patient preferences act like a moveable fulcrum of a scale to shift the magnitude of the benefits or harms needed to tip the decision toward recommending the screening test (net benefit likely) or recommending against the screening test (net harm likely). NNS, number needed to screen to prevent one cancer-specific death.
Like many medical decisions, informed screening decisions are best made by using quantitative estimates of life expectancy and screening outcomes to anchor decisions, tempered by qualitative consideration of how an older person values the potential benefits and harms of screening. While potential benefits of screening include increased survival, this should be balanced against the potential harms of screening, which encompass adverse effects on survival, comfort, function, and psychological well-being emanating from all procedures that result from screening. For older patients who are bothered by the discomfort and risks of screening tests, the decrease in quality of life in the present may outweigh the small chance of future benefit.
General Framework for Making Informed Cancer Screening Decisions
The first step in individualizing cancer screening recommendations is to estimate an older person’s life expectancy, because life expectancy affects the likelihood of receiving benefit versus harm from screening. For example, finding an asymptomatic cancer in a person who will die of something else before the cancer would become symptomatic does not benefit the person and may cause considerable harm. The risk of such a scenario depends upon the life expectancy of the individual and the age-specific mortality rate of the particular cancer. With advancing age, the mortality rates of most cancers increase, yet overall life expectancy decreases. The need to weigh these two opposing factors when estimating the likelihood that a person will die of a screen-detectable cancer makes cancer screening decisions in older people complex.
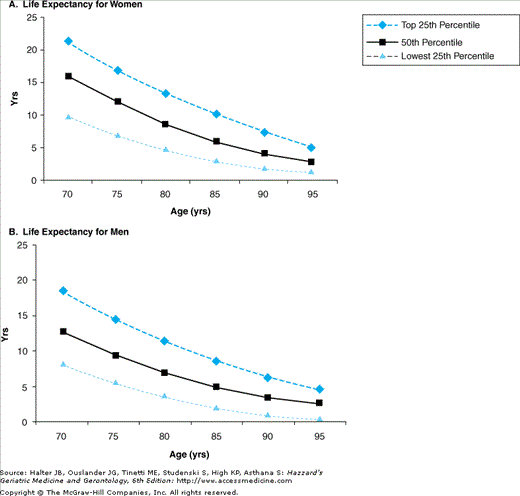
In estimating life expectancy, it is useful to have a general idea of the distribution of life expectancies at various ages. For example, when estimating the life expectancy of an 80-year-old woman, it is useful to know that approximately 25% of 80-year-old women will live more than 13 years, 50% will live at least 9 years, and 25% will live less than 5 years. Figure 14-2 presents the upper, middle, and lower quartiles of life expectancy for the U.S. population according to age and sex, and illustrates the substantial variability in life expectancy that exists at each age. Although it is impossible for clinicians to predict the exact life expectancy of an individual person, it is possible to make reasonable estimates of whether a person is likely to live substantially longer or shorter than an average person in his or her age cohort. Such estimates, while not perfect, would allow for better estimations of potential benefits and harms of screening than focusing on age alone.
Figure 14-2.
Upper, middle, and lower quartiles of life expectancy for women and men at selected ages. Data from the Life Tables of the United States, 2001. Adapted from Walter LC, Lewis CL, Barton MB. Screening for colorectal, breast, and cervical cancer in the elderly: a review of the evidence. Am J Med. 2005;118:1078.
There are many factors clinicians can use to estimate whether an older person is typical of someone at the middle of their age-sex cohort or is more like someone in the upper or lower quartiles. For example, the number and severity of comorbid conditions and functional impairments are much stronger predictors of mortality in older people than chronological age. Congestive heart failure, end-stage renal disease, oxygen-dependent chronic obstructive lung disease, severe dementia, or functional dependencies in several activities of daily living are examples of factors that would cause an elderly person to have a life expectancy substantially below the average for his or her age. The absence of significant comorbid conditions or presence of excellent functional status identifies older individuals who are likely to live longer than average.
The next step is to consider the potential benefits of screening. The main benefit of cancer screening is the reduction in cancer mortality experienced by a few people whose early-stage disease is detected and treated, which otherwise would have been lethal during their remaining lifetime. While the impact of cancer screening on quality of life or functional decline has not been studied, there is good evidence that mammography, fecal occult blood testing (FOBT), and Papanicolaou (Pap) smears are effective in reducing cancer-specific mortality. However, the strength of the evidence that these tests are effective in older adults is limited by the small number of older patients included in screening trials. In addition, even screening tests likely to be effective in older populations may not provide survival benefit to individuals with short life expectancies, because the benefit from screening is not immediate. For example, in the randomized controlled trials of FOBT and mammography, the cancer-specific mortality curves between the screened and unscreened groups do not separate significantly until at least 5 years after the start of screening. This period is likely even longer for persons older than 70 years of age because some evidence suggests that the length of time that a screen-detectable cancer remains clinically asymptomatic increases with advancing age for both breast and colorectal cancer. This suggests that older persons who have life expectancies of less than 5 years will not derive survival benefit from cancer screening.
For patients with estimated life expectancies greater than 5 years, it is important to have a general idea of the potential benefit of screening tests in absolute terms. The absolute benefit of a screening test can be conveyed by the absolute risk reduction (the absolute difference in proportions of persons with a given outcome from two treatments or actions), or more effectively by calculating the number needed to screen (NNS), which is the reciprocal of the absolute risk reduction. Considering older persons at average risk for developing cancer, the approximate NNS to prevent one cancer-specific death is listed in Table 14-1 for screening tests that have been shown to be effective in reducing cancer-specific mortality. All the numbers in Table 14-1 assume a 5-year delay between the onset of screening and survival benefit. The numbers are presented according to age and life expectancy because life expectancy defines the potential number of years available for screening. For example, 240 very healthy 80-year-old women would have to be screened with mammography during their remaining lifetime to prevent one death from breast cancer. Table 14-1 emphasizes the importance of considering life expectancy when making cancer screening decisions, as illustrated by the example that an 85-year-old woman in the upper quartile of life expectancy is more likely to benefit from screening than a 75-year-old woman in the lowest quartile. The precision of the estimates of life expectancy, and, in turn, number needed to benefit, is greatly enhanced by considering comorbidity rather than chronological age alone.
LIFE EXPECTANCY QUARTILE* | |||||||||||||||
|---|---|---|---|---|---|---|---|---|---|---|---|---|---|---|---|
Age 70 | Age 75 | Age 80 | Age 85 | Age 90 | |||||||||||
Upper Quartile | Middle Quartile | Lower Quartile | Upper Quartile | Middle Quartile | Lower Quartile | Upper Quartile | Middle Quartile | Lower Quartile | Upper Quartile | Middle Quartile | Lower Quartile | Upper Quartile | Middle Quartile | Lower Quartile | |
Women | |||||||||||||||
Screening Test | |||||||||||||||
Mammography | 142 | 242 | 642 | 176 | 330 | 1361 | 240 | 533 | — | 417 | 2131 | — | 1066 | — | — |
Pap smear | 934 | 1521 | 4070 | 1177 | 2113 | 8342 | 1694 | 3764 | — | 2946 | 15056 | — | 7528 | — | — |
Fecal occult blood | 178 | 340 | 1046 | 204 | 408 | 1805 |
|||||||||
