Method
Measurement
Advantages
Disadvantages
Value in drug development decisions
Thorax computed tomography (CT)
Yields Hounsfield unit images which can be segmented into types of fat, muscle, air, and bone; tissue volume in mm3 assessed
1. Absolute units can be calibrated against water standard
Some radiation exposure
Medium
2. Integral to PET scanners
Fluorodeoxyglucose positron-emission tomography (FDG-PET)
Metabolic rate in fat and muscle
1. Standardized metabolic measurement conditions
Radiation exposure
High
Complex quantification
2. Yields absolute metabolic rate in micromoles/100 g tissue/min
Metabolic quantification from aortic blood
Absolute metabolic rate, relative metabolic rate, standard uptake value (SUV), and ratio (SUVR) can be obtained to follow therapeutic trial
Arterial or arterialized blood samples not required
Limited to thorax scanning
High
Conclusions
The combination of FDG-PET and CT provides a tool for assessing brown and white fat metabolic activity and volume. These measurements can be used to assist in the monitoring of pharmacological interventions thereby informing the development of novel agents for obesity and diabetes.
Introduction
While increased body fat is associated with type 2 diabetes, the location and tissue type of fat are important aspects of the physiological concomitants of obesity. The location of fat in the truncal region in comparison to leg fat is an indicator of both the metabolic syndrome and mortality, even after statistical adjustment for body mass index (BMI) and waist circumference [1]. Visceral adipose tissue volume assessed by computed tomography (CT) scans is more highly associated with the metabolic syndrome than abdominal subcutaneous adipose tissue [2] and using specific regional fat location has been found to enhance the correlation between fat volume and response to experimental obesity interventions [3]. Adipose tissue type is also an important factor. White adipose tissue is involved in energy storage, while brown adipose tissue is thermogenic and may be an especially advantageous target for treatment intervention [4]. Brown and white fat can be regionally parcellated with x-ray computed tomography and the metabolic correlates of thermogenesis quantitatively assessed with positron-emission tomography as reviewed below. Thus, regional and adipose tissue type assessment of fat tissue for pharmaceutical trials of drugs which affect obesity and diabetes can be an important contributor to documenting drug activity, interpreting individual differences in drug efficacy, and characterizing the physiological effects of new compounds. This chapter reviews the imaging-based assessment of the metabolic rate of brown fat during thermogenesis. 18F-deoxyglucose (FDG) uptake measurement with positron-emission tomography (PET) and coregistered x-ray CT provides a methodology for this assessment.
Drug Action, Energy Expenditure, Thermogenesis, and Brown Fat
Increases in energy expenditure without corresponding caloric intake are associated with weight reduction. Drug treatment for obesity might reduce appetite, diminish food absorption, alter circadian rhythms, or enhance locomotor activity among multiple mechanisms, but enhancing energy expenditure is an attractive mechanism for drug action. As noted by Arch and Trayhurn in their reviews, thermogenesis may be an appropriate target in antidiabetic [5] and anti-obesity drug discovery [6, 7]. Targeting brown adipose tissue is an appealing therapeutic strategy because activation of brown adipocytes has the potential to safely improve metabolic control independent of defects in insulin production or sensitivity [8]. There may be as much as 0.2–1 % of body weight as brown fat [9] and capable of using as much as 20 % of caloric expenditure for cold exposure [9] (see review [10]). To advance new drug development, increasingly detailed assessments of body tissue function is necessary to capture relevant physiology, to increase tissue specificity, and to understand individual differences in response. Individual, personalized approaches to drug development may be especially important in conditions such as obesity where subtypes and mechanisms may differ widely. In obesity, degrees of insulin resistance, hyperlipidemias, genetic subtypes, and activity levels differ widely and may impact responsiveness to particular pharmacological interventions [11]. A drug to increase thermogenesis may not be found efficacious in individuals without a brown fat deficit in activity or volume, just as an anti-amyloid drug for Alzheimer’s disease may not be efficacious in a patient without excess brain amyloid.
Brown Fat Thermogenesis and Autonomic Regulation
The contribution of brown fat to thermal homeostasis begins with skin warm and cold receptors which stimulate neurons in the dorsal horn. These carry thermal information into a network of GABAergic and glutamatergic neurons in the preoptic area and the dorsomedial hypothalamus. Sympathetic activation of brown fat is then the output of this complex and multitransmitter circuit; for details see the insightful and detailed review of Tupone et al. [12]. Brown fat metabolic rates in rats [13–15] were measured with FDG-PET. To provide a quantitative measure, these and other investigators use the standard uptake value which is computed as the average FDG uptake within a volume of interest (in kBq/ml) divided by the administered amount of FDG (in MBq) multiplied by the body weight (in Kg). This corrects the observed uptake counts per unit volume for the amount of tissue in the whole body and the amount of FDG given. The standard uptake value (SUV) activity was enhanced fivefold in brown fat in response to treatment with the B-3 adrenoreceptor selective agonist CL316243 and to a lesser extent (twofold) in white fat and muscle. No significant differences were found in other body tissues. Of further interest is that in the rat the distribution of adrenergically activated fat was in the same infrascapular region that brown fat is found in man. The mechanism of thermogenesis, including the role of uncoupling protein-1, which is a unique marker for brown adipose tissue, is reviewed elsewhere [16–20].
Computed Tomography Quantitated Imaging of Body Tissue
Estimates of human body fat may be approximated by BMI, the ratio of height and weight; by skinfold thickness, anthropometric measurements, and electrical impedance; and by whole body counting techniques, but these techniques lack adipose tissue type specificity and anatomical exactness. In order to assess both brown and white fat in the infrascapular [21] regions, x-ray attenuation can be used as a potential differentiator to assess both brown fat and white fat. CT imaging was invented by Godfrey Hounsfield and Allan Cormack who combined electrical engineering and mathematical reconstruction algorithms to make the first CT scanner [22]. The initial clinical success of the first CT scanner was detecting a tumor in a patient in 1971, and CT scanners were subsequently widely adopted across the world. These images are quantitative, with type of fat tissue, muscle, bone, and air having different values. Hounsfield unit ratings are standardized with a value of 0 for distilled water and −1,000 for air. Fat typically has values from −250 to –50, muscle from 10 to 200, other soft tissue 150–300, and bone 700–300. The modern CT scanner produces a series of contiguous slice images, typically a matrix of 256 by 256 values for each horizontal slice of the body and 40–100 slices with each picture element or voxel containing a value for Hounsfield value. While quite narrow ranges of values can be obtained from pure postmortem materials or water-filled phantoms, in life, individual tissues have varied content of fat, water, blood, bone, marrow, and other tissue constituents so that neighboring voxels may have a range of values (Figs. 5.1 and 5.2). A low level of noise persists with water phantoms showing means close to 0 with a standard deviation (SD) in the 2–3 Hounsfield range. Nevertheless, tissues can be identified and the volumes of different tissues determined using computer programs.
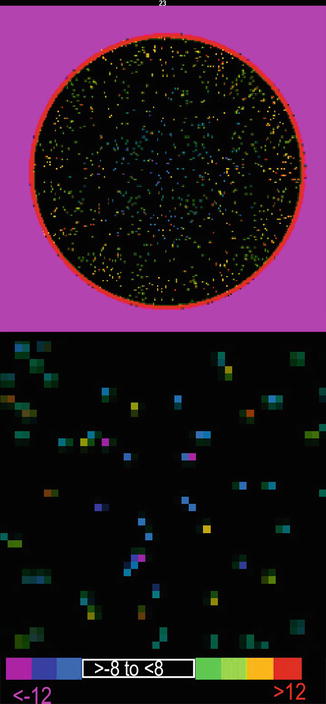
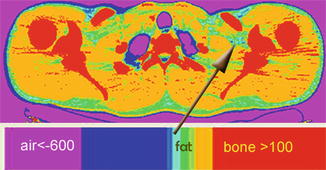

Fig. 5.1
Cylindrical water phantom for CT calibration shows values close to zero. Above: Display thresholded so that values from −8 to +8 are black and values below −8 and above +8 are shown on the lower color bar. Below: Magnified phantom to show scatter of values outside −8–8 limit. The mean value was 0.93 SD = 3.1 Hounsfield units and the modal value 0.07. The values show calibration deviates approximately only one part in 2000 from the data range from air to bone

Fig. 5.2
Axial CT image of the thorax showing tissues with Hounsfield number with discrete color bands. This illustration was created with Brainflow (Brainflow visualization program, http://code.google.com/p/brainflow/). The color bar extends from −600 to +600. Blue-green, aqua, green, and yellow-green narrow color bands correspond to −140 to −120, −120 to −100, −100 to −80, and −80 to −60 Hounsfield units, respectively. Air (lung) is less than −600 (cerise) and bone (red) >100
Interestingly, Hounsfield, an electrical engineer, used the inference that if a computer could identify printed characters, it could be used to compute the slice images [22]. However, early CT-based anatomical quantitative volumetric image analysis of the brain based on values of water was pioneered by two psychologists with Eve Johnstone’s [21] measurement of brain ventricular enlargement in schizophrenia and Terry Jernigan’s semi-automated brain cerebrospinal fluid quantification with numerical illustrations (presented at the 64th Annual Meeting of the Radiological Society of North America, November 26, 1978 and submitted as a paper on November 30, 1978) [23]. Jernigan’s paper includes statistical images showing the proportion of patients with CSF for each voxel and is the earliest voxel-by-voxel statistical brain image derived from CT so far located. The first quantitative voxel-value-based study of muscle (cited in the historical review of skeletal mass assessment [24]) was the work of J. A. Bulcke (submitted to the journal Neuroradiology on October 31, 1978, 1 month earlier than the Jernigan submission) [25]. Bulcke and coworkers gives means, standard deviations, and scatterplots for Hounsfield units in several muscles with the sternocleidomastoid muscle showing mean Hounsfield value = 68, SD = 16. This study relied on hand-drawn edges and does not present a statistical image, so the Jernigan paper remains the first to use computer algorithms for CT volumetric tissue analysis, a use apparently first anticipated by Hounsfield. However, the earlier 1978 study by Haggmark may deserve partial credit as the earliest voxel-based tissue CT volumetric study although they used printed pictures from the scanner and an Aristo planimeter to quantify area rather than computation from the actual digital record [26]. Similar methods were used to quantify photomicrographs of tissue cultures with a Keuffel and Esser polar planimeter [27] in one of the earliest quantitative tissue studies.
Qualitative and Quantitative CT-Based Anatomical Tissue Segmentation
Brown fat is located primarily in the neck and upper thorax. Visual inspection identified brown fat clusters in the supraclavicular region in 100 % of 38 lean women [28], in 70 % of 27 subjects [18], in 52 % of 31 unselected patients [29], and in 6.8 % of 4,842 patients [30]. Since brown fat is more metabolically active than white fat, especially if the patient was cold during the FDG uptake period, regions of brown fat, active muscle, and/or cancer-related metastatic regions have been found to be a potential source of ambiguity in FDG-PET scan evaluation of metastatic disease of the upper thorax and neck. The range of brown fat-positive patients reported on visual inspection range suggests the need for quantitative criteria based on anatomical and functional imaging. This may be especially important in pharmacological treatment studies of elderly men, patients with obesity, and/or patients with diabetes where brown fat may be less visually prominent.
The earliest quantitative image analysis of fat located is that of Borkan [31]. Eight men had their total fat area and total tissue area measured by examining abdominal image voxels; a bimodal distribution was observed with a peak at −110 interpreted as fat, a point of rarity at −50, and a second peak at 20, interpreted as lean tissue. Subcutaneous and abdominal fat was first differentiated by Grauer and coworkers with a wide Hounsfield unit bands for fat of −10 to −200 [32].
The introduction of FDG-PET with integral CT scanning made the evaluation of the Hounsfield unit values for areas of high uptake possible. Cohade [33] is the earliest located report demonstrating that patients displaying focally located regions of increased FDG uptake had CT density in the fat range (mean −76, SD = 24, 2SD range −124 to −48) and they hypothesized these to be foci of brown fat. In a similar approach [34], regions of high SUV on FDG-PET were defined as brown fat if the CT Hounsfield values were between −250 and −50. Criteria for brown fat based on both CT and FDG SUV were Hounsfield 30 to −150 and FDG uptake of >1.5 SUV [35] and Hounsfield −100 to –10 and SUV >1.0 [30]. Segmentation of a CT image into bands of Hounsfield values is shown in Fig. 5.2.
Season, Thermal Accommodation, and Brown Fat FDG Imaging
Since brown fat is thermogenic, one might hypothesize an increase in volume and/or activity during winter months. In individuals who had two FDG-PET scans months apart with one scan showing high SUV PET uptake (>3) and one scan with low SUV PET uptake (<2), a difference of Hounsfield units was found with predominantly winter month scans showing Hounsfield values of −71, SD = 18, and predominantly summer months showing a value of −104, SD = 17 [36], in Fukuoka (27 °C in August and 5 °C in December). However, the CT and FDG images were not reported as coregistered. Since the FDG regions of interest were selected as high on one occasion and low on a second (from a pool of 1,384 scans, 73 showed visually identified BAT and 23 had two scans, one high and one low), the FDG change cannot be unambiguously interpreted. Significantly, more subjects showed cold-activated brown fat (as determined by two trained observers) in winter- than summer-scanned patients [29] in Sapporo (26 °C in August and 0 °C in January). Brown fat was more likely to be visualized in patients scanned in winter than in summer in Los Angeles [37] suggesting a chronic effect of low-temperature exposure even in a narrow range of exposure (29.4 °C in August and 19.2 °C in December). Lean men exposed to 10 °C in water-cooled suits for 4 weeks of acclimation [35] showed an increase in tissue oxidative metabolism index ([11C] acetate k) in cervicothoracic brown fat before and after acclimation. Similarly, quantitative FDG showed an increase of approximately 40 nmoles/ml/min after acclimation but this was not statistically significant.
Brief Exposure to Cold and Warm Environments
Saito [29] acquired FDG-PET on eight subjects who showed clear FDG uptake following cold exposure (19 °C for 2 h) and rescanned them following warm exposure (27 °C) but does not report means or statistical tests comparing the experimentally exposed subjects. Virtanen [38] found marked increase in glucose metabolic rate assessed quantitatively using FDG-PET (Patlak-Gjedde method [39]) in five subjects exposed to cold (17–19 °C) and warm (ambient scanner temperature). Supraclavicular regions outlined on CT scan by visual inspection were associated with higher metabolic rates on the coregistered PET scan following cold exposure. However, associated Hounsfield unit values were not used to segment tissue in individuals who had two FDG-PET scans months apart with one scan showing high SUV PET uptake (>3) and one scan with low SUV PET uptake (<2); a difference of Hounsfield units was found with predominantly winter month scans showing Hounsfield values of −71, SD = 18, and predominantly summer months showing a value of −104, SD = 17 [36]. Again, however, CT and FDG images were not reported as coregistered. Since the FDG regions of interest were selected as high on one occasion and low on a second (from a pool of 1,384 scans, 73 showed visually identified BAT and 23 had two scans, one high and one low), the FDG change cannot be easily interpreted. Saito [29] found a seasonal effect with higher prevalence of brown fat in winter was found although not statistically tested.
Brown Fat, Age, and Sex
While not based on CT quantification, 162 healthy volunteers had FDG-PET/CT and were divided into BAT positive (n = 67) and BAT negative (n = 95). The BAT-positive subjects were significantly younger and showed lower BMI, subcutaneous fat, and abdominal fat [40]. Similarly, brown fat activity was greater in younger adults [29] and higher in women than men [29], and men showed more marked age decline in brown fat than women [41].
Histopathological and Genetic Validation of PET/CT Brown Fat Imaging
In an important validation step, histological examination of the biopsy of the fat tissue in three subjects with regions of high FDG uptake revealed cells characteristic of brown fat [38]. In other biopsy studies [34, 42], patients with a upper thorax tumors with high FDG uptake were found to have a hibernoma (brown fat tumor) so named because of the role of brown fat in hibernating animals. High FDG SUV masses with CT values in the adipose tissue range appear typical of hibernomas [43]. The presence of brown fat-specific protein uncoupling protein-1 (UPC1) in brown adipose islands of tissue from the neck of patients undergoing surgery also supports the supposition that the active FDG uptake spots in the neck are consistent with brown fat [44]. In a third biopsy study, brown and white fat in the supraclavicular region were biopsied, and UCP1 was identified in brown but not in white fat [41]. Lastly, while not a quantitative study, coregistered and fused PET/CT scans on 199 subjects were divided by visual inspection into brown fat positive (n = 88) and brown fat negative (111), and genotyping showed that among older subjects, UCP1 A/G substitutions were associated with diminished chance of being brown fat positive [45].
Animal Studies
Early experiments in marmot [46] identified the thermogenesis in brown fat as important in maintaining a steady temperature in hibernation. This stimulated basic research on the neural mechanisms of control of brown fat metabolism. In rats with brown fat activated with amoxetine, the traced activated area had a mean Hounsfield unit value of approximately −200 to −180 with more negative values in white fat [14]. Much higher Hounsfield unit values were found in rats [36] examined after 4 h of exposure to 4 °C (−12, SD = 22) and 23 °C (−28, SD = 9.6). However, these values were obtained from a visually placed FDG-PET image circular region of interest and are not reported to be coregistered between warm and cold, or use exactly the same region of interest location.
Image Analysis and Brown Fat
The studies reviewed above clearly demonstrate that islands of high metabolic activity in the neck and upper thorax are associated with cold-activated adipose tissue and that biopsy studies indicate brown adipose tissues in these areas. These studies have sometimes used a CT Hounsfield level for identifying brown fat, but the same CT template for cold and warm conditions with algorithmically defined brown fat has not been carried out. Bias associated with outlining regions on the FDG scan to select brown fat areas confounds region selection with activity, and studies with very wide ranges of Hounsfield units do not clearly use an objective measure to separate brown and white. Studies in which visual observation of both PET and CT was used to define brown fat also lack independence of region of interest selection and may bias the results toward a higher brown fat than white fat result and also bias Hounsfield unit determination. A study in which the images from a group of subjects are exposed to both cold and warm conditions with the PET images coregistered to a single CT with regions of interest based purely on defined computer algorithms applied to Hounsfield unit images has not been reported. In such a study, the voxels associated with specific narrow Hounsfield values can be selected, and their FDG metabolic rate and SUV can be assessed and statistical analysis performed. Below, pilot data are presented [47] that address these issues and apply variations of image coregistration methods in brain imaging to the multiple coregistration problems.
Key Methods in Tissue Segmentation Study
Subjects
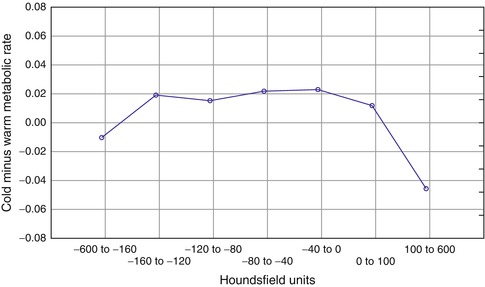
As a prelude to an early phase interventional study of a new drug with putative effects on BAT metabolism, Buchsbaum et al. [47] studied a group of insulin-resistant subjects (n = 9, mean ± SD homeostasis model assessment (HOMA-IR) = 5.2 ± 2.5) and overweight healthy volunteers (n = 2) with fluorodeoxyglucose positron-emission tomography and x-ray computed tomography (FDG-PET/CT) of the thorax (C6-T8) to assess the glucose metabolic rate (GMR) of brown and white fat. Of these, eight of the insulin-resistant subjects also underwent imaging of the upper leg. Subjects were exposed to a 90-min period of either cold (67–68 °F; 19–20 °C) or warm (72–73 °F; 22–23 °C) temperature on separate days and then moved to the PET/CT scanner, which was kept at the same temperature for FDG uptake. The initial high-resolution warm 200 MA CT was used to coregister the cold and warm PET scans. All scans were converted to .nii format using PMOD (PMOD Technologies, Zurich, Switzerland). Segmented CT masks of 7 Hounsfield unit (HU) bands, −600 to −160 (mainly lung), −160 to −120, −120 to −80, −80 to −40, −40−0, 0–100 (muscle), and 100–600 (bone and some muscle), were computed. GMR was quantified as micromoles glucose/100 g/min using an arterial input function from the aorta image as used in one other study [35]. The FDG-PET scans for the cold and warm sessions were both registered to the initial CT so that the same CT anatomical scan Hounsfield values could be applied to both the cold and warm conditions. All scans were then visually reviewed for registration quality. Thus, all measurements were automated and did not depend on visual interpretation. Cold minus warm GMR values were obtained at 47 thoracic levels, and we summarized the 47 levels into five slices (slice 0–9, 10–19, 20–29, 30–39, and 40–46). The uppermost group had more anatomical variability due to variations in the length of the neck and flexion of the neck, and so the analysis focused on slices from the superiormost slice which included the shoulder to the inferiormost slice passing through the superior portions of the heart. Since the bed appears in cross section in CT but not the PET scan, CT was masked with PET values >0 to remove the bed.
FDG Quantification
Images were quantified using the time-activity curves from each voxel and from a region of interest in the aorta using PMOD software. A lumped constant of 1.14 was used following an earlier report in the quantification equation [39]. This forms a rectangular cube of body metabolic rate measurements approximately 128 by 128 by 47 for each of the four adjacent neck/thorax levels. Thus, the data set is the 3D xyz spatial matrix of metabolic rate measurements in micromoles glucose/100 g/min, with expected values in the range of 1–10 μmol/100 g/min across all adipose tissue voxels.
Glucose Metabolic Rate Following Cold and Warm Exposure
Whole Slice Glucose Metabolic Rate (Micromoles Glucose/100 g/min)
Metabolic rate was significantly greater in voxels in the fat range than in other tissue at the Hounsfield levels less than −160 and greater than 100 (Fig. 5.3). The wider spread of values from −160 to 0 was consistent with the earlier studies, and large standard deviations were found. The cold vs. warm effect significantly varied across Hounsfield unit bands, and this was confirmed with a 3-factor repeated measures analysis of variance (ANOVA) (cold/warm × Hounsfield unit band × thorax level) and with a temperature by Hounsfield unit interaction (see Fig. 5.3). Examination of the SUV in a narrow analysis with bands 20 units wide found a peak cold minus warm effect at −140 to −100, but the cold minus warm effect was not significant (F = 2.48, df-1, 10, p = 0.15) and the Hounsfield unit by cold/warm interaction was also not significant (F = 0.89, p = 0.51).

