CTs or MRIs are essential for preablative therapy planning of hepatic tumors to identify accurate size, number, and location of tumors. Tumors larger than 5 cm and located near the major branches of the portal vein and hepatic vein have a higher potential for incomplete ablation. Postablative imaging studies are needed to determine if the entire tumors are included in the treatment zone to minimize the risk of local tumor recurrences. Complications of ablative therapy can be identified on post-treatment imaging studies.
Over the past two decades, radiofrequency ablation (RFA) has been used increasingly to treat both resectable and unresectable hepatic tumors, in particular early-stage hepatocellular carcinoma (HCC) and unresectable colorectal hepatic metastases (CRHMs). Consequently, the efficacy of RFA in treatment of hepatic tumors has been thoroughly studied and reviewed but has varied from study to study. Recently, the American Society of Clinical Oncology conducted a large systemic review that showed the wide variability of the reported 5-year survival rate (14% to 55%) and local tumor recurrence rate (3.6% to 60%) of patients who underwent RFA for unresectable CRHM. This variability is partly due to the difference in patient or tumor selection criteria, tumor biology, or technical experience.
Imaging studies play an important role in tumor staging and help select good candidates for ablation, which leads to successful performance of RFA. Moreover, imaging studies help assess treatment success, identify incomplete ablation or residual tumor that needs further treatment or additional ablation, and identify complications after ablation. Eradication of residual tumors at early stage and appropriate management of complications may increase disease-free survival and overall survival of patients after RFA.
There are various imaging modalities used for tumor staging and treatment assessment of RFA. CT and MRI are the modalities of choice for tumor staging and follow-up after RFA. MRI has better soft tissue contrast and, therefore, is superior to CT in sensitivity to detect small lesion (<1 cm). CT is more frequently used, however, because of its greater availability. Contrast-enhanced ultrasound with microbubble contrast agent, with experienced operators, has been shown to have diagnosis accuracy comparable to CT or MRI ; however, it is not widely applicable. Availability of microbubble contrast agent and being operator-dependent are significant limitations of ultrasound. Combined positron emission tomography and CT (PET/CT) has demonstrated good sensitivity in detection of early tumor recurrence after RFA; thus, it may be used as a problem-solving tool. PET/CT has no potential role in HCC, however, because HCC is often PET negative.
This article reviews the current roles of imaging studies, focusing on CT and MRI, in planning and follow-up of hepatic tumors after ablation. Tumor selection, immediate treatment assessment, subsequent and long-term follow-up, and pattern of local tumor progression as well as immediate and delayed complications of RFA are described.
Pretreatment imaging
Optimal imaging technique and spatial resolution provide good anatomic detail, which is required to make decisions on patient management. A large review study has shown that 52% of patients with CRHMs who were referred to a tertiary care center had inadequate imaging at the time of referral, and additional imaging studies changed the expected management in 30% of these patients.
Generally, a multidetector CT scanner and multiphasic contrast enhancement are required for detection and characterization of hypervascular hepatic tumors and preoperative or preablative planning. HCC and hypervascular metastases, such as neuroendocrine carcinoma, renal cell carcinoma, and breast cancer, characteristically appear as a transiently hyperattenuating mass during the hepatic arterial phase and become isoattenuating or hypoattenuating with liver parenchyma in the portal venous phase of enhancement. Alternatively, hypovascular tumors, such as metastases from colorectal cancer, usually appear as hypoattenuating mass in the portal venous phase.
On MRI, HCC and metastases usually are hypointense on T1-weighted images and hyperintense on T2-weighted images. HCC, however, may be isointense or hyperintense on T1-weighted images. The MRI patterns of enhancement of HCC and metastases are similar to CT.
The important factors that have an impact on the successful rate of RFA include tumor appearance, size, number, location, and invasion of adjacent structures or organs.
Size and Numbers
For HCC, patients are required to have a single tumor smaller than 5 cm or as many as three nodules smaller than 3 cm each.
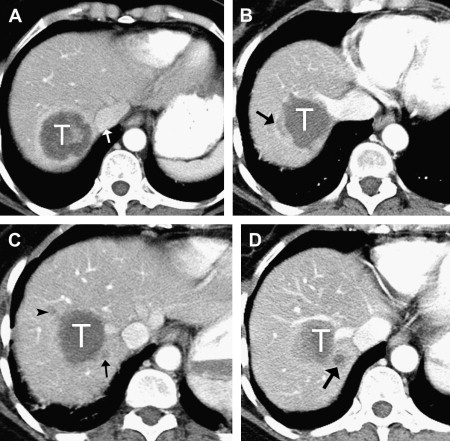
For hepatic metastases, there is no clear consensus regarding the size and number of lesions that should be treated with RFA. The highest ablation success rates, however, have been achieved in patients with a solitary CRHM or a few CRHMs less than 3 cm in diameter. Although larger tumors can be treated by overlapping ablations, the chance of incomplete ablation seems to increase as the size of tumors increase ( Fig. 1 ). In many studies, the local recurrence rate for tumors larger than 5 cm is significantly greater than for tumors between 3 and 5 cm.
Location
Multiple studies have reported an increased failure rate in tumors adjacent to large blood vessels (diameter >1 cm). Large blood vessels tend to be protected by the intrinsic cooling provided by the blood flowing through them, the so-called heat-sink effect. Blood flow can negatively affect the results of RFA because it can potentially remove heat before complete tumor ablation is achieved.
The location of a tumor not only affects the successful rate of RFA but may also affect the complication rate. Ablation of tumors located near the portal vein pedicles is associated with major bile duct injury, resulting in biliary stricture and sepsis. Tumors at subcapsular location are more challenging to treat percutaneously because of the risk of thermal injury to adjacent organs, such as the diaphragm and the bowel loop. In such instances, the use of special techniques, such as intraperitoneal injection of dextrose to displace the bowel, can be considered.
Bile Duct or Major Vessel Invasion
Bile duct and major vessel invasion are usually contraindications for RFA. Contrast-enhanced CT and MRI are capable of demonstrating vascular invasion in HCC. Tumor thrombus usually appears as an intravascular filling defect with streaky or homogeneous enhancement, which helps distinguish it from bland thrombus that does not show enhancement. HCC may also cause biliary ductal dilatation by compression or, less commonly, by direct intraductal invasion. Similarly, metastases, particularly from colorectal cancer, may invade adjacent bile duct. Careful review imaging is necessary to detect subtle tumor thrombus or bile duct invasion.
Extrahepatic Metastases
Extrahepatic metastases are usually a contraindication for RFA. They are occasional exceptions, however, in patients treated with effective chemotherapy with residual liver-only metastases or in patients with lung metastases that can be resected.
Treatment assessment
Currently, there is no consensus on a standard follow-up interval regimen for imaging. The most common approach by members of the International Working Group on Image-Guided Tumor Ablation includes contrast-enhanced CT or MRI within 6 weeks of the initial ablation to determine whether or not additional ablation therapy is required and every 3 to 4 months thereafter to determine technique effectiveness.
Imaging with intravenous contrast is needed because pathologic studies have shown that the best correlation of necrotic tissue is defined by the zone of nonenhancement on cross-sectional studies. Patients who have undergone RFA for hypervascular tumors, such as HCC, need to be evaluated before and after intravenous administration of a contrast agent with a protocol that includes image acquisition during the arterial phase of enhancement. Small hypervascular tumor nodules could be overlooked if this phase is not performed.
Immediate Follow-up
Complete ablation
On noncontrast CT, the ablative zone appears as a sharply demarcated low attenuation but often contains area of high attenuation along the electrode needle tract or in the center. This high attenuation area is thought to represent greater cellular disruption and it should resolve in the successive weeks or months. Air bubbles produced during ablation may be seen at immediate follow-up and usually resolve within 1 month. The shape of ablation zone is usually round or oval, depending on the electrode type used in the procedure. The shape may be irregular, however, when the index tumor is located between large branches of hepatic vessels where there is heat sink effect from blood flow.
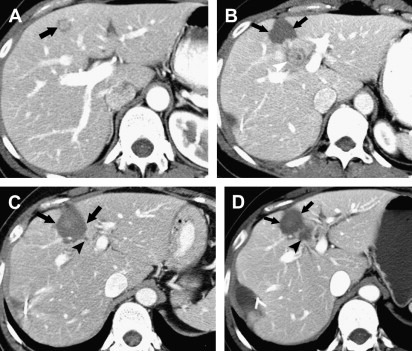
After contrast administration, the ablative zone typically appears as a nonenhancing area of low attenuation, representing coagulative necrosis ( Figs. 1 and 2 ). The most important morphologic features of complete ablation are the size and the characteristic smooth margin of the ablative zone. The ablative zone should be larger than the index tumor, centered at the index tumor, and encompass the entire index tumor with an additional circumferential ablative margin, ideally 0.5 to 1.0 cm in thickness. The ablative margin is the region of ablated hepatic parenchyma beyond the border of tumor that assures the destruction of locally invasive microscopic tumor. The interface between the ablative lesion and adjacent normal hepatic parenchyama should be sharply demarcated.
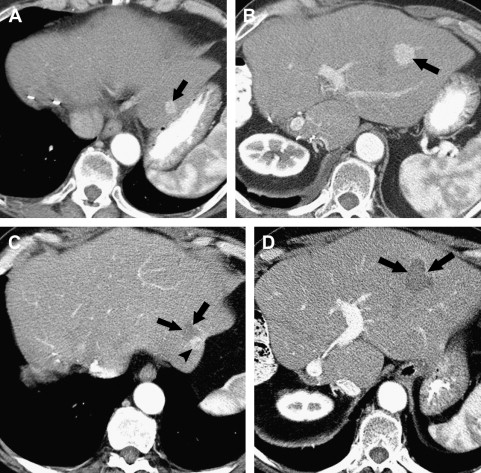
Benign periablational enhancement is frequently seen in immediate follow-up study and usually disappears by the time of a 1-month follow-up examination ; however, it can last up to 6 months. In pathologic specimens, this benign peripheral enhancement has been shown to be a peripheral zone of congestion and sinusoidal hemorrhage, gradually replaced by granulation tissue. This benign periablational enhancement is most appreciated on the arterial phase of CT scan and variable in intensity and thickness depending on the scanning technique. It is concentric, symmetric, and uniform in appearance with smooth inner margins and must be differentiated from irregular or nodular peripheral enhancement seen in incomplete ablation. Benign wedge-shaped enhancement at or distal to the ablation zone may be seen in arterial phase due to a compensatory increase in arterial flow in a territory where portal branches have been destroyed.
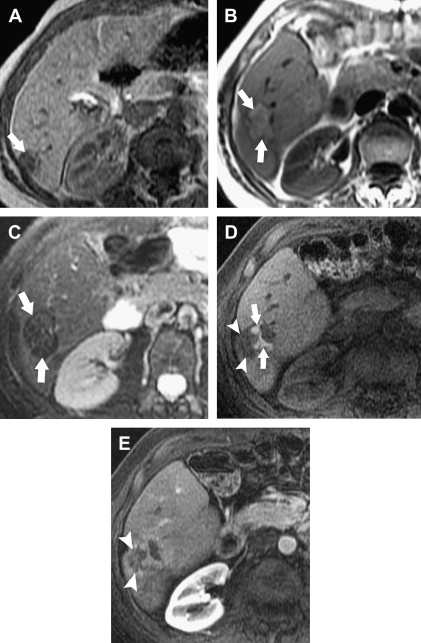
The morphologic characteristics of the ablation zone on CT can also be applied to MRI. Specific to MRI are changes in signal intensity. The ablative zone has variable signal intensity on T1-weighted images. Complete ablation is characterized by low signal intensity on T2-weighted images ( Fig. 3 ), whereas a viable tumor produces high signal intensity. In the first week after ablation, however, T2 signal intensity can also be variable depending on the stage of hemorrhage and liquefactive or coagulative necrosis. Therefore, to maximize the accuracy of the study, contrast administration with gadolinium is routinely used. Similar to CT, benign periablational enhancement is often seen as an ill-defined perilesional rim with high signal intensity on T2-weighted images and moderate to intense enhancement on arterial dominant-phase images. Lack of nodular or irregular enhancement indicates complete ablation.
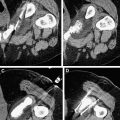
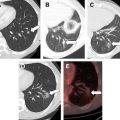
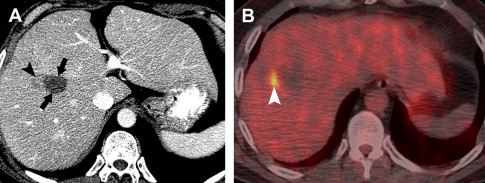
On immediate follow-up studies, differentiation of benign periablational enhancement from residual tumor may be difficult. If the findings on cross-sectional images are inconclusive, PET/CT may be useful as problem-solving in cases of hepatic metastases ( Fig. 4 ). For HCC cases, close follow-up with CT or MRI is necessary.
Incomplete ablation
On immediate follow-up, incomplete ablation with residual tumor is always suspected if the ablation zone does not cover the entire index tumor. Residual unablated tumor can be mostly identified at the periphery of the ablation zone and may be subtle.
Residual unablated hypervascular tumor usually appears as a nodular or asymmetric enhancing area at the margin of the ablation zone (see Figs. 2 and 3 ). This enhancement may sometimes be seen only during the arterial phase, emphasizing the importance of the scan technique. For an index tumor with hypovascularity, the residual tumor may appear as a disruption of the smooth interface between the ablation zone and the surrounding hepatic parenchyma. This observation may be difficult to identify because of the benign periablational enhancement that is often seen on immediate follow-up of cross-sectional images. Eccentric and focal areas of enhancement are more likely indicative of residual tumor tissue than of a benign cause of enhancement (see Fig. 3 ).
On MRI, the residual tumor may appear as a nodule distorting the internal contour of the ablation zone and typically shows moderately high signal intensity on T2-weighted images with peripheral nodular or irregular enhancement on arterial dominant-phase that may persist on late-phase images (see Fig. 3 ).
Subsequent and Long-Term Follow-up
Complete ablation
The ablation zone becomes better circumscribed when compared to immediate follow-up images and typically involutes gradually. Volume changes compared with the volume at the immediate follow-up CT examination have been reported as 79%, 50%, 27%, 11%, and 6% at 1, 4, 10, 16, and 19 months, respectively. The rate of involution, however, can be varied from case to case and no or minimal involution does not always imply treatment failure. No or minimal involution may be due to the complication of RFA, such as biloma formation or abscess.
As discussed previously, benign periablational enhancement, which is seen in immediate follow-up, usually disappears by the time of a 1-month follow-up. On CT, the ablation zone usually appears as a well-circumscribed hypoattenuating area without enhancement. On MRI, the ablation zone shows more homogeneous signal intensity with hyperintensity on T1-weighted and hypointensity on T2-weighted images.
Local tumor progression
The term, local tumor progression , indicates both incompletely treated viable tumor that was previously considered completely treated but continued to grow and a new tumor, such as satellite or daughter lesions of HCC, that grows at the original site. Local tumor progression may be subtle and most often occurs at the periphery of the ablated lesion.
Local tumor progression can be classified into three patterns. First, the nodular type appears as focal nodule enhancement at the margin of the ablation zone. It may be a small nodule with only slightly higher attenuation than necrotic tissues that protrude within the defect or a faint hypoattenuating zone that extends into the adjacent parenchyma. Second, the halo type appears as rim enhancement at the margin of the ablation zone. The third pattern is gross enlargement pattern that shows an increase in overall tumor size.
On MRI, pattern of local tumor progression is similar to CT. Local tumor progression usually appears as a development of T1-hypointense and T2-hyperintense signal areas with irregular or nodular enhancement.
New hepatic lesion and extrahepatic disease
New hepatic lesions and extrahepatic disease are the majority of recurrence, with a rate of 47% compared with 9% for local recurrence. Careful evaluation of follow-up CT or MRI is essential to detect new hepatic metastases outside the ablation zone ( Fig. 5 ) and extrahepatic lesions.
Treatment assessment
Currently, there is no consensus on a standard follow-up interval regimen for imaging. The most common approach by members of the International Working Group on Image-Guided Tumor Ablation includes contrast-enhanced CT or MRI within 6 weeks of the initial ablation to determine whether or not additional ablation therapy is required and every 3 to 4 months thereafter to determine technique effectiveness.
Imaging with intravenous contrast is needed because pathologic studies have shown that the best correlation of necrotic tissue is defined by the zone of nonenhancement on cross-sectional studies. Patients who have undergone RFA for hypervascular tumors, such as HCC, need to be evaluated before and after intravenous administration of a contrast agent with a protocol that includes image acquisition during the arterial phase of enhancement. Small hypervascular tumor nodules could be overlooked if this phase is not performed.
Immediate Follow-up
Complete ablation
On noncontrast CT, the ablative zone appears as a sharply demarcated low attenuation but often contains area of high attenuation along the electrode needle tract or in the center. This high attenuation area is thought to represent greater cellular disruption and it should resolve in the successive weeks or months. Air bubbles produced during ablation may be seen at immediate follow-up and usually resolve within 1 month. The shape of ablation zone is usually round or oval, depending on the electrode type used in the procedure. The shape may be irregular, however, when the index tumor is located between large branches of hepatic vessels where there is heat sink effect from blood flow.
After contrast administration, the ablative zone typically appears as a nonenhancing area of low attenuation, representing coagulative necrosis ( Figs. 1 and 2 ). The most important morphologic features of complete ablation are the size and the characteristic smooth margin of the ablative zone. The ablative zone should be larger than the index tumor, centered at the index tumor, and encompass the entire index tumor with an additional circumferential ablative margin, ideally 0.5 to 1.0 cm in thickness. The ablative margin is the region of ablated hepatic parenchyma beyond the border of tumor that assures the destruction of locally invasive microscopic tumor. The interface between the ablative lesion and adjacent normal hepatic parenchyama should be sharply demarcated.

