(1)
where c is the propagation speed, v is the oscillation frequency, and λ is the wavelength. The mechanical properties (e.g., “rigidity”) of the propagation medium determine c; the source of the sound determines v; and λ simply equals c/v. The propagation speed is measured in units of distance per unit of time, e.g., meters per second (m/s) or millimeters per microsecond (mm/μs). Frequency is the rate at which rarefactions or compressions pass a point in space; it is measured in units of cycles per second or Hertz. The inverse of the frequency is termed the period, T; the period is commonly used to specify wave properties and is measured in units of time, e.g., microseconds (μs). Frequency and period generally do not change as a wave propagates through one or several different media. The wavelength is the distance between two adjacent rarefactions or compressions or any adjacent points of like “phase”; it is measured in units of distance, e.g., meters (m) or microns (μm). The speed of sound ranges from about 340 m/s in air to more than 6,000 m/s in granite and glass. In tissue, sound speed is close to that of water, i.e., approximately 1,500 m/s; it varies with tissue type, and ultrasonic instruments typically use a fixed assumed value of 1,540 m/s for the sound propagation speed in tissue. Speed-of-sound values for some tissues are shown in Table 1.
Table 1
Attenuation coefficients and speed of sound of various tissues
Tissue type | Attenuation (dB/MHz-cm) | Sound speed (m/s) | Reference |
|---|---|---|---|
Aqueous humor (human) | 0.10 | – | [13] |
Blood (human, heparinized) | 0.22 | 1,542 | [15] |
Bone (human, femur) | 25.6 | 3,375 | [15] |
Breast (human, in vivo)a | 0.28–0.63 | – | [15] |
Breast (human, in vivo)a | 1.7 | – | [16] |
Choroidal melanoma (human, in vivo) | 0.90 | – | [15] |
Fat (dog, omentum, in vivo) | – | 1,459 | [15] |
Fat (human, subcutaneous, ex vivo) | 0.64 | – | [15] |
Liver (human, ex vivo) | 0.64 | – | [15] |
Ocular lens (human) | 2.0 | – | [13] |
Uterus (human, in vivo) | 0.22–0.44 | – | [15] |
Vitreous humor (human) | 0.10 | – | [13] |
Figure 1 illustrates how the pressure amplitude of a simple, sinusoidal, continuous wave (cw) varies with time or with distance. The figure shows the pressure amplitude, A, the wavelength, λ, and the phase angles of the wave.
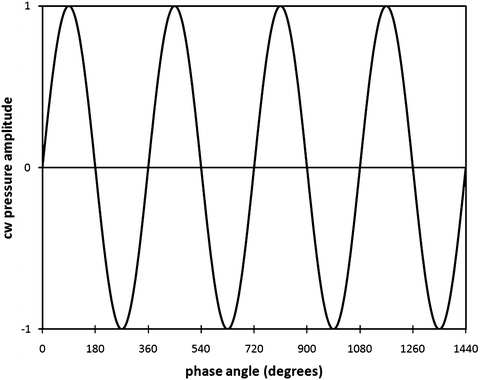

Fig. 1
A continuous wave (cw). A four-cycle portion of a simple, continuous, sinusoidal signal with uniform amplitude
The frequency range to which the human ear responds is 20–20,000 Hz. For a propagation speed in air of 340 m/s, this frequency range corresponds to a wavelength range of 17 m to 17 mm. Most conventional diagnostic ultrasound instruments operate in the frequency range of 1.5–15 million cycles per second or megahertz (MHz). Assuming a propagation speed in tissue of 1,500 m/s, this frequency range corresponds to a wavelength range of 1.0–0.1 mm. General-purpose instruments tend to employ frequencies ranging from 3 to 10 MHz; frequencies below 3 MHz and above 10 MHz tend to be used only in special-purpose instruments. Intraoperative or endoscopic (endoluminal) instruments can use higher frequencies ranging from 5 to 15 MHz because attenuation (discussed later) is less of a limiting factor than it is in percutaneous applications.
An important variable that affects many propagation phenomena is acoustic impedance. The acoustic impedance, z, is defined as

where ρ is the mass density of the propagation medium and c is the speed of sound.

(2)
Ultrasonic imaging systems transmit brief bursts of ultrasonic energy commonly termed pulses. These pulses contain one or a very few complete cycles of the ultrasound signal. Brief pulses are also short in terms of their length in space. For example, a 10-MHz signal that spans two full cycles, i.e., two wavelengths of sound, has an overall length of 300 μm (0.3 mm) in a medium with a sound speed of 1,500 m/s, which approximates conditions in soft tissue.
Figure 2 illustrates how the pressure amplitudes of sinusoidal waves vary with time; the variation with distance is the inverse (left to right) of the depicted curves. Figure 2 shows the shape of a typical transmitted diagnostic-ultrasound pulse.
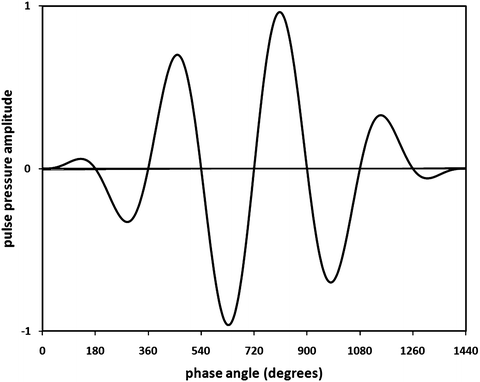

Fig. 2
A pulse wave. Four cycles of a modulated sinusoidal signal illustrate a pulse used for imaging
Imaging ultrasound uses very brief (therefore, short) ultrasonic pulses for a variety of reasons, such as resolution, that are discussed below in the section describing imaging phenomena. These very brief signals conventionally are characterized by a nominal frequency. However, because of the brevity of these signals, they do not consist of a single frequency; rather, they consist of a continuous distribution of frequencies over a usable frequency range or band, and the center of the band defines the nominal frequency of the signal. Only a very long signal (compared to the period of the wave) can properly be defined by a single frequency. A brief pulse consisting of one or a very few cycles of sound is termed a broadband signal. Usable bandwidth affects many properties of ultrasonic imaging systems, including axial spatial resolution (i.e., resolution in the propagation direction) and Doppler resolution, as discussed later in this chapter.
The propagation of alternating high- and low-pressure regions within a medium corresponds to the transport of energy through the medium. The energy is proportional to the square of the pressure amplitude of the wave. The intensity of the wave is defined as the power density, i.e., power over a unit of area, and power density typically is expressed as watts per square centimeter (W/cm2).
In addition to being characterized by its amplitude, a wave can be characterized by its phase, which is expressed in terms of angular units, i.e., degrees or radians (360° = 2π rad, i.e., 1 rad is approximately 57.3°). If the phase of a sinusoidal signal is considered to be zero when the pressure is increasing through zero, then the phase is 90° at the positive-pressure maximum, 180° as the pressure decreases through zero, 270° at the negative pressure maximum, and 360° as the pressure increases again through zero, as shown for the cw case in Fig. 1. (Pressure is defined here in relation to ambient pressure, i.e., the pressure in the medium. Absolute pressure never can be less than zero). Note that 360° corresponds to one full wavelength. Waves can be characterized in space by contours of constant phase; these contours are termed wavefronts. The wavefronts of ocean waves are curves parallel to the surface and perpendicular to the direction of propagation at any point; the wavefronts of ultrasonic waves are surfaces in three dimensions and also are perpendicular to the direction of propagation at any point. The schematic depictions of wave propagation in this text show waves in terms of their wavefronts, e.g., in Figs. 3, 4 and 5.
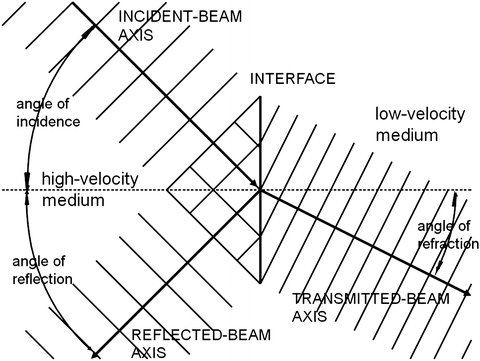
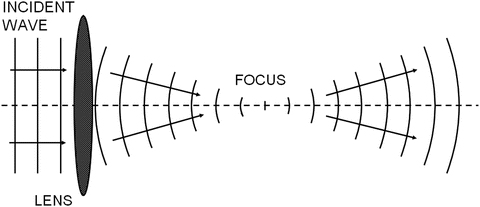
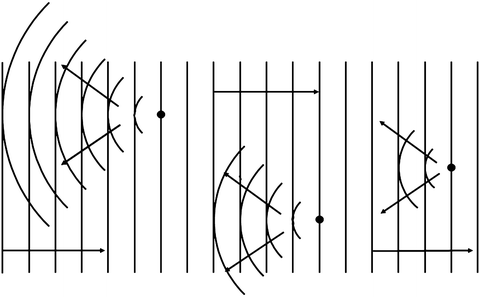

Fig. 3
Reflection and refraction at an interface. The incident wave is specularly reflected at a reflection angle equal to the incident angle and is transmitted at a refraction angle that depends upon the sound-propagation speeds of the two media

Fig. 4
Refraction by a lens. Refraction at the lens surface causes the wave to converge to a focal point and then diverge beyond the focal point

Fig. 5
Backscattering. The incident ultrasound wave is redirected by scattering particles; the portion that is redirected back toward the source is termed the backscattered wave
Propagation Phenomena
Like all waves, ultrasonic waves are affected by the following propagation phenomena: refraction, reflection and transmission, scattering, absorption, attenuation, dispersion, interference, and diffraction. Clinicians must understand how these phenomena affect the propagation of ultrasonic waves in order to understand the principles underlying ultrasound image formation.
Refraction
If a wave passes from a medium with one propagation speed into a medium with a different propagation speed, and if the direction of propagation is not perpendicular to the interface between the two media, then the direction of propagation changes as the wave passes from the first medium into the second. The propagation direction is more nearly perpendicular to the interface in the lower-velocity medium, as illustrated in Fig. 3.
Refraction provides a means of focusing waves by using lenses. The curved surface of a spherical lens causes the propagation direction to change more for regions of the wave that pass through the peripheral portions of the lens than for those that pass through the central portions. As shown in Fig. 4, this effect can be exploited to concentrate the wave of a broad beam into a narrow focal region. The relationship between the refracted and incident beam angles is


(3)
where θ 1 and θ 2 respectively are the angles of the incident and refracted propagation directions relative to the perpendicular to the interface between the two media, and c 1 and c 2 are the sound speeds of the incident and refracted waves. Note that if c 2 = c 1, then no change occurs in the direction of propagation at the interface. Similarly, if the incidence is normal, i.e., if the beam is perpendicular to the interface and sinθ 1 = 0, then sinθ 2 = 0, then again, no change occurs in the direction of propagation at the interface. If c 2 > c 1 and the value of (c 2/c 1) sinθ 1 equals 1, then the refracted wave does not penetrate the interface; it is totally reflected at the interface. The angle at which this occurs is termed the critical angle for total internal reflection, and it can occur at the lateral walls of cysts or the surfaces of bones, as discussed in the section on ultrasound propagation in tissue. At any angle of incidence beyond the critical angle, all wave energy is reflected, as described in the next section.
Refraction along the propagation path in tissues can degrade the quality of images, either by causing an imaged structure to be displaced from its actual position or by randomly perturbing the uniform propagation properties of an ultrasound beam thereby “blurring” and distorting imaged structures. This effect can be minimized by orienting the transducer beam perpendicular to the tissue interfaces causing the refraction; so called phase aberrations caused by refraction are discussed further in the section describing imaging phenomena. Phase aberration is the subject of considerable research; however, a discussion of the methods of minimizing it is beyond the scope of this chapter.
Reflection and Transmission
Reflection is the partial reversal of the propagation direction of a wave incident on a smooth interface between media with different acoustic impedances. The smoothness of the surface is defined with respect to the wavelength of the incident wave; a smooth surface has irregularities on a scale far smaller than a wavelength. Reflection by objects that are smooth compared to a wavelength is termed specular; reflection by objects that are not smooth compared to a wavelength is termed diffuse.
As shown in Fig. 3, reflection reverses the direction of the incident propagation component perpendicular to the interface, but it does not change the propagation component parallel to the interface. In specular reflection, the angle of propagation of the reflected wave with respect to the perpendicular to the surface is the negative of the angle of the incident wave. (An analog to specular ultrasonic reflection is the reflection of light from a mirror.) In diffuse reflection from a rough surface, i.e., where surface irregularities are larger than a fraction of a wavelength, most of the reflected energy may be concentrated about the propagation direction of specular reflection, but a significant proportion of the reflected energy randomly propagates at other, slightly different angles. (Reflection of light from a matte surface is analogous to diffuse ultrasonic reflection.)
The pressure amplitude, A 2, of a specularly reflected wave is


(4A)
where A 1 is the incident pressure amplitude and z 2 and z 1 are the acoustic impedances of the two media and z 1 is the impedance of the medium where the wave originates. The reflection coefficient, R I , is

where I 2 is the intensity (i.e., the square of the amplitude) of the reflected wave and I 1 is the intensity of the incident wave. Because energy is conserved, the wave that continues through the reflecting interface, i.e., the transmitted wave, contains all the energy of the incident wave minus the energy of the reflected wave. Therefore, the transmission coefficient, T I , is

and the pressure amplitude, A 3, of the transmitted wave is

Note that if either z 1 or z 2 is far greater than the other, i.e., a very strong impedance mismatch exists, then R → 1, A 2 → A 1, A 3 → 0, and nearly all incident ultrasound is reflected while almost none is transmitted. A good example of this would be the strong reflections at the surface of bone or an air-filled space such as the lung. Alternatively, if z 1 = z 2, i.e., if no impedance mismatch exists, then T = 1, A 3 = A 1, and A 2 = 0, and all incident ultrasound is transmitted while none is reflected. An example of this would be the transmission of the sound wave inside a simple cyst. A simple cyst has no internal signal because it is uniform liquid and so its impedance properties remain uniform, and consequently no scattering or reflection of the sound wave occurs. Also, note that in total internal reflection, described in the section on refraction, R = 1 and T = 0.

(4B)

(4C)

(4D)
Scattering
Scattering is the random redirection of energy out of an incident wave; it results from the interaction of the incident wave with scattering entities that are small compared to the wavelength of the incident ultrasound. The scattering entities are called scatterers, and in tissue, the actual scatterers may be blood vessels, collagen fibers, microscopic pockets of necrosis, individual or aggregated melanocytes, foam cells, platelet aggregates, or other microscopic tissue constituents or simply spatial variations in the velocity of propagation or density of the tissue (i.e., variations in acoustic impedance). Depending upon the size, shape, and orientation of the scatterers, scattering can redirect energy uniformly in all directions, or it can redirect energy primarily in the same direction as the incident propagation (termed forward scattering) or in the reverse direction (termed backward scattering or backscattering), as shown in Fig. 5. In most cases, backscattered energy provides the signals utilized in ultrasonic image formation. The amount of backscattered energy depends upon the size, shape, concentration, and relative acoustic impedance of the scatterers. The relative acoustic impedance, Q, is the impedance of the scatterers compared to their surroundings and can be expressed as

where z s is the scatterer impedance and z m is the impedance of the surrounding medium. The amount of energy that is backscattered increases as scatterer size, concentration, and the square of relative acoustic impedance increase. However, backscattering is most strongly dependent on scatterer size. (Note the similarity of the expression for relative acoustic impedance in Eq. (5) to the expression describing reflection in Eqs. (4A and 4B).

(5)
Because scattering causes energy to be redirected out of the forward-propagating wave, it reduces the total energy carried by the wave in the forward direction. The loss of energy in the forward-propagating wave is termed attenuation and it consists of absorption as well as scattering components.
Absorption
As an acoustic wave propagates through a medium, the alternating regions of high and low pressure cause vibrating movement to occur in the medium. Friction among vibrating elements within the medium generates heat. This converts acoustical to thermal energy; it reduces the acoustic energy in the ultrasound beam and dissipates it as heat within the medium. This phenomenon is termed absorption.
Attenuation
Absorption is a major cause of energy reduction in an ultrasound wave. However, reflection and scattering redirect acoustic energy from the wave propagating through a medium and contribute to the loss of energy propagated in the forward direction by the incident wave. The reduction of energy caused by the combination of absorption and scattering is termed attenuation. Attenuation can be described by the equation

where A 2 and A 1 are the pressure amplitudes at positions x 2 and x 1 (and where x 2 > x 1) and a is the frequency-dependent attenuation coefficient, commonly expressed as decibels (dB) per MHz-cm. (A decibel is a logarithmic expression of a ratio, e.g., 20 log (A 2/A 1) expresses the ratio of pressure, A 2, to pressure, A 1, in decibels. If A 2 is half of A 1 then 20 log (A 2/A 1) = −6 dB. Similarly, 10 log (I 2/I 1) expresses the ratio of intensity, I 2, to intensity, I 1, in decibels. If I 2 is half of I 1, then 10 log (I 2/I 1) = −3 dB.)

(6A)
Attenuation increases with increasing ultrasound frequency. In tissue, attenuation increases approximately linearly with frequency, and α, the attenuation coefficient of Eq. (6A), is more-rigorously expressed as


(6B)
where α 0 is the attenuation coefficient at 1 MHz, v is the frequency, and the exponent, p, is 1 if the frequency dependence is linear. In tissue, the value of p typically is very close to, but not exactly equal to, 1, and different tissues may exhibit different values of p. Interestingly, the value of p for water is approximately 2, i.e., the relatively very low attenuation coefficient of water at frequencies near 1 MHz quadruples when the ultrasound frequency doubles to 2 MHz.
The attenuation coefficients for tissues range from an insignificant value of <0.1 dB/MHz-cm for cystic and aqueous structures up to 2.0 dB/MHz-cm for the lens of the eye. Most solid soft tissues have attenuation coefficients in the range of 0.4–0.7 dB/MHzcm; some examples are shown Table 1 [13–16]. Because of the frequency dependence of attenuation, ultrasonic imaging of structures that lie deep within the body requires lower frequencies than those required for imaging structures that are near the surface or that are accessible intraoperatively or endoscopically. As discussed below, spatial resolution improves as frequency increases, but a judicious choice must be made between resolution and penetration depth when selecting an optimal ultrasound frequency for a specific imaging application.
Dispersion
Dispersion is not considered to be a significant phenomenon in medical ultrasonic acoustics, although it is quite important in optics. Dispersion is the separation of different frequency components of a propagating wave as a result of differences in propagation velocities for different frequencies. As an example, the spectrum produced by a prism and the chromatic aberration produced by a lens result from the fact that blue light propagates at a slower speed in the prism than red light and therefore is more strongly refracted.
Interference
When one part of a wave is made to be coincident with another part of a wave, e.g., through refraction or reflection, the combination of the two waves results in the algebraic summation of the pressure amplitudes of the waves. This phenomenon is termed interference. Recall that pressures in acoustic waves can be negative as well as positive; therefore, in some regions of space, interfering waves can combine to produce higher positive or negative pressures and in others they can cancel and produce reduced pressure. Interference that produces higher positive or negative pressures is called constructive interference; interference that reduces the pressure is called destructive interference. Because interference occurs over a volume, cancellation of out-of-phase waves (destructive interference) in one region of space is balanced by reinforcement of in-phase waves (constructive interference) in another region of space so that energy is conserved.
When a wave maintains a predictable and stable relationship over time or throughout space among the phase values at different points in the wave, it is termed a coherent wave. If interference occurs with a coherent signal, the pattern of constructive and destructive interference is stable. The light produced by lasers and the sound produced by medical ultrasonic imaging systems are two examples of coherent signals. The classic interference phenomenon associated with ultrasonic imaging is speckle, which is discussed below in the section on imaging.
Diffraction
If the distribution of ultrasonic energy over a surface in space is known, then the distribution of energy can be predicted over any other surface by considering every point on the first surface to be a source of a new wave. The wave emanating from each point interferes with the waves emanating from all other points to produce the new distribution of energy.
The propagation of waves in accordance with this phenomenon is termed diffraction; diffraction determines the distribution of wave energy accurately and is not subject to the limitations of simple geometric optics or acoustics, which assume that wave propagation can be defined by rays (straight lines). Diffraction more-realistically takes into account the complex distribution of energy in the acoustical waves generated by medical ultrasonic instruments, as illustrated in Figs. 6 and 7.


