Abstract
Background
Guidelines for prostate cancer treatment in men with limited life expectancy are based on expert opinion. Patient preferences for when to defer treatment based on longevity are unknown. We sought to define life expectancy thresholds at which men are more likely to choose conservative management in the context of varying risks of cancer death and treatment-related side effects.
Materials and methods
We crowdsourced a conjoint analysis exercise to 2,046 men sociodemographically matched to a US prostate cancer population. Subjects were given a longevity estimate based on their age and comorbidity. They then chose between treatment and conservative management across scenarios with varying risks of cancer death at 5, 10, and 15 years, erectile dysfunction, urinary incontinence, and irritative urinary symptoms. Multivariable multinomial logistic regression identified the life expectancy threshold when men were more likely to choose conservative management over treatment.
Results
Across all men, there was a significant interaction between longevity and treatment choice (P < 0.001), with probability of treatment decreasing 15% for every 5-year decrease in life expectancy (OR0.85, 95% CI0.82–0.89). Across all tumor risk subtypes, men were significantly more likely to choose conservative management at life expectancy<10 years(OR<1, P < 0.05). For low-, favorable-intermediate-, unfavorable-intermediate-, and high-risk cancers, men were more likely to choose conservative management at life expectancy thresholds of ≤15, ≤10, ≤9, and ≤7 years, respectively (P < 0.05).
Conclusions
Preferences for when to consider conservative management of prostate cancer based on longevity align with current guidelines recommendations, except for low-risk disease, for which men are likely to consider conservative management at even higher life expectancy thresholds.
1
Introduction
Treatment decision making for patients with localized prostate cancer (PC) in the context of limited life expectancy (LE) remains a challenging clinical scenario. PC is a slow growing disease and patients are unlikely to experience a mortality benefit until 8–10 years after treatment [ ], and treatment often incurs side effects that can have significant impact on quality of life. Treatment guidelines based on expert opinion endorse conservative management at varying LE thresholds for different tumor risk subtypes [ ]. For example, the NCCN guidelines recommend considering observation for men with very low, low, favorable-intermediate, unfavorable-intermediate PC at a LE threshold of <10 years, and for men with high and very-high risk disease at a LE threshold of <5 years. Despite the widespread availability of nomograms to predict longevity and clear guideline recommendations, overtreatment of intermediate-risk disease and undertreatment of high-risk disease has persisted in the active surveillance era [ , ]. While evidence suggests that overtreatment is largely mediated by physician factors [ , ], some argue that patients drive overtreatment due to being more risk-averse than expert opinion.
In this study, we sought to determine if the LE thresholds at which men choose conservative management for various levels of cancer risk match those recommended in expert opinion. We crowdsourced a conjoint analysis exercise to a cohort of men sociodemographically matched to a US PC population based on SEER data. Conjoint analysis is a type of tradeoff analysis that calculates how individuals make choices given a range of other competing decision attributes. Men in our cohort were asked to iteratively choose either definitive local treatment or CM across varying levels of risk of cancer death at 5, 10, and 15 years, risk of erectile dysfunction (ED), urinary incontinence (UI), and irritative urinary symptoms (IUS), while considering a defined LE, which was calculated based on their age and comorbidity. We wished to define the LE at which men were significantly more likely to choose CM over treatment, both overall and in subgroups of tumor risk. We hypothesized that men would be less risk averse and choose CM at higher LE thresholds than recommended by guidelines.
2
Materials and methods
2.1
Conjoint analysis
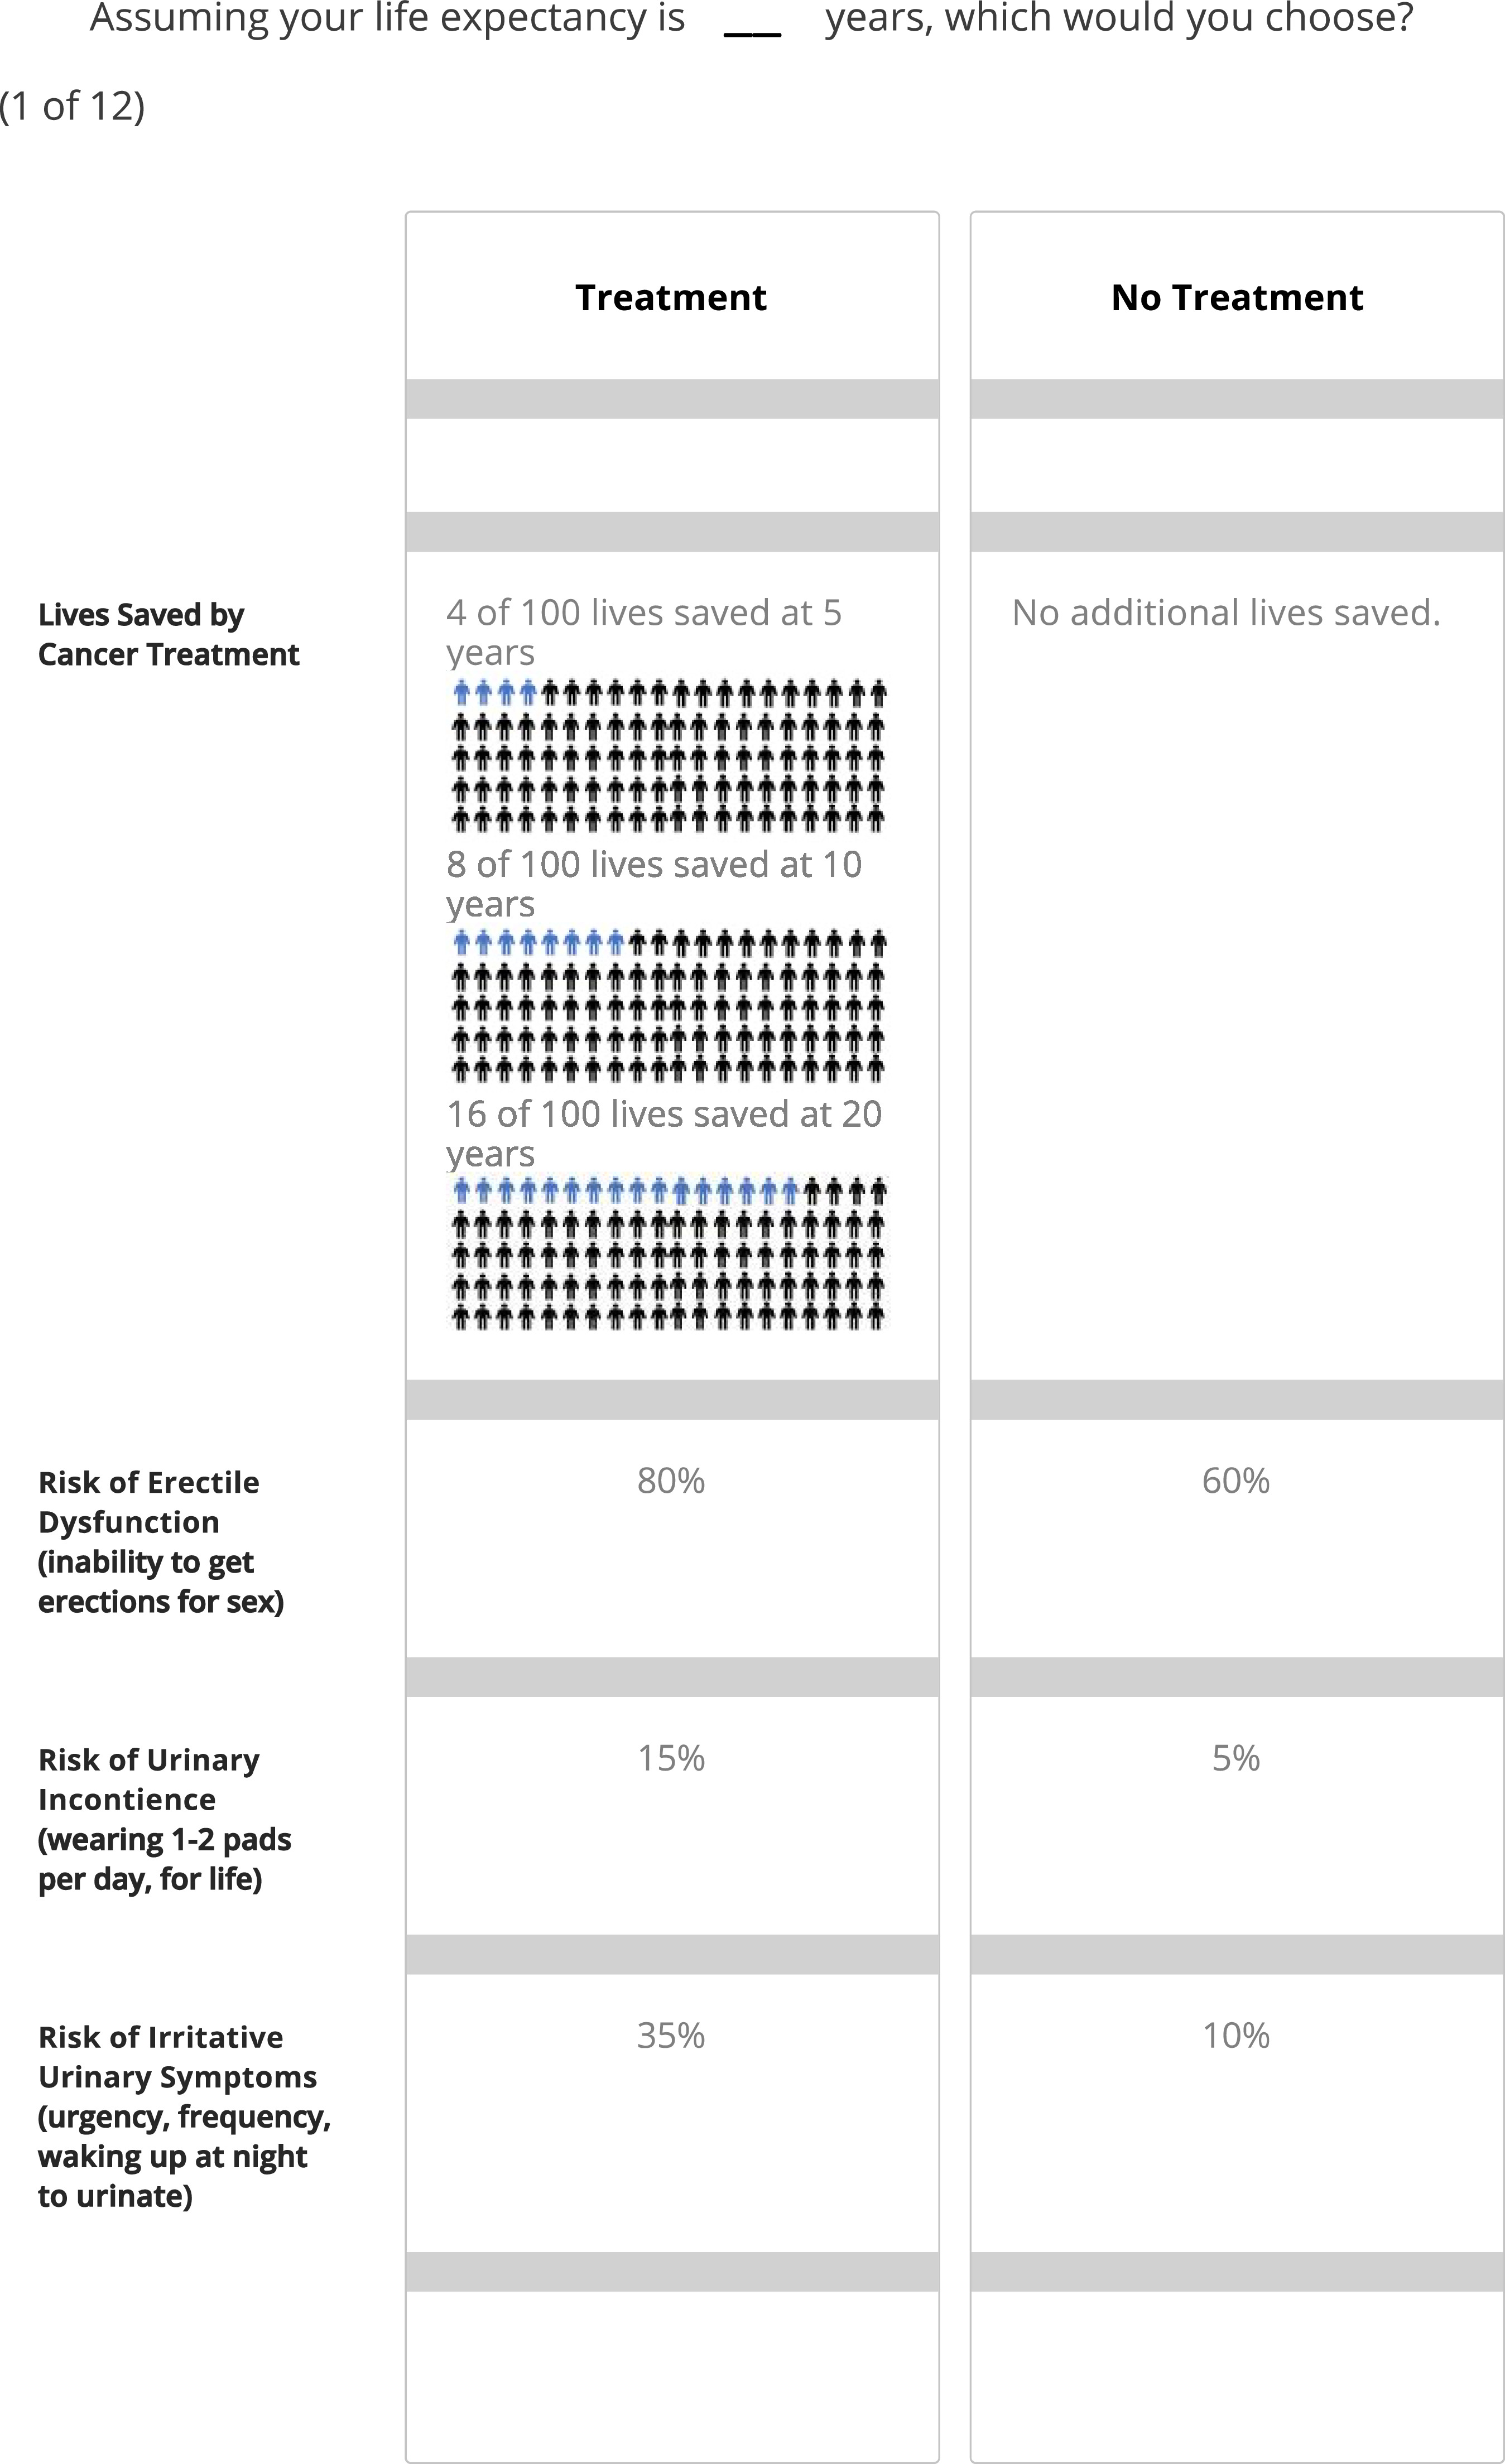
Conjoint analysis is a type of tradeoff analysis that can provide insights on how participants value different attributes in complex decisions and has been validated in men with PC [ , , ]. We created a conjoint analysis tool for clinically localized PC using an adaptive choice-based conjoint analysis (ACBC) platform(Sawtooth, North Orem, Utah). This computer-based exercise asked participants to work through 12 scenarios and choose either “definitive local treatment” (corresponding to choices with lower 5-, 10-, and 15-year cancer mortality risk with higher risk of side effects) or “nonaggressive” treatment (corresponding to choices with no reduction in cancer mortality risk and lower risk of side effects) in each scenario ( Fig. 1 , Appendix Fig. 1 ). Participant demographic data was collected as well: age, race/ethnicity, education level, and income. Health literacy was also evaluated using a single-item literacy screening tool [ ]. The exercise was piloted by 10 nonphysicians whose feedback informed survey design and whose results were excluded from final analysis.
2.2
Conjoint attributes and levels
Because best practices for conjoint analysis recommends 4–5 attributes for each scenario, we included risk of cancer death and the most common side effects of radical prostatectomy (ED, UI) and radiation therapy (IUS) as decision attributes. Participants were also asked to consider a defined LE based on their age and self-defined comorbidities in the Charlson Comorbidity Index. Unlike other attributes, LE remained static for all scenarios and was considered as a fixed effect in models, consistent with how LE remains constant in real-world decisions about treatment.
The conjoint exercise was based on the key decision attributes as described in the AUA guidelines for prostate cancer shared decision making.[ ] We used outcomes data from prospective case series and randomized controlled trials comparing definitive treatment to watchful waiting to define a plausible range of risk of key attributes in the setting of definitive local treatment and CM [ , ]: (1) cancer mortality (5/10/20-year 0%/0%/5% for low-risk disease, 2%/5%/12% for favorable-intermediate-risk, 4%/8%/16% for unfavorable-intermediate-risk, and 5%/11%/18% for high-risk); (2) UI (5%/10%/15%/20%/25%/30%/35%), (3) ED(5%/20%/40%/60%/80%/100%), and (4) IUS (5%/10%/15%/20%/25%/30%/35%/40%).
2.3
Covariates
Covariates included in data analysis were age, race/ethnicity, household income, education level, health literacy, region, and self-reported comorbidities.
2.4
Participants and online crowdsourcing
We conducted an online crowdsourced conjoint analysis survey of men who demographically match the SEER dataset of US PC patients in terms of age, race/ethnicity, and regional demographics [ ]. We elected this approach to avoid bias associated with sampling men with pre-existing prostate cancer, who would be biased based on their previous counseling and experiences. All participants provided written consent. The conjoint analysis exercise was performed in collaboration with Cint®, a global survey research firm with a marketplace of diverse individual users who are compensated to share their opinions.[ ] From the over 1 million available survey respondents in the US, we used the Cint platform to identify a target population of 2,000 US men matching the key demographic characteristics noted above. The number of users queried and survey response rate was not provided by Cint. For completing the exercise, participants were rewarded with a prespecified number of marketplace points to be redeemed through Cint’s online payment partners.
2.5
Statistical analysis
A discrete choice modeling approach was used to assess individual treatment preferences across 4 key tradeoffs: risk of cancer mortality, ED, UI, and IUS. We then utilized a multivariable multinomial conditional logistic regression model to examine treatment choice across 12 binary choice tasks across attributes, while adjusting for demographic variables (age, comorbidity, race, ethnicity, education, and income). Additionally, an interaction term was introduced to assess the impact of LE on treatment choice. We then estimated marginal effects of LE on treatment choice overall and across tumor risk. We intentionally departed from the traditional application of conjoint analysis, which primarily focuses on quantifying the part-worth utilities of decision attributes, given that we wished to assess the impact of LE, a static attribute at the patient level, on treatment choice across varying risk of cancer risk and side effects. All statistical analyses were performed using R software version 4.2.3, with statistical significance determined by 2-sided P-values of less than 0.05.
3
Results
Conjoint analysis was completed by 2,046 men ( Table 1 ). Median age was 66(IQR 58, 72). 88.2%(1,806/2,046) reported they were “extremely” or “quite a bit” health literate. 22.0%(435/2,046) were Black or African American and 11.3%(230/2,046) were Hispanic. 54%(1,106/2,046) of the cohort had at least a college degree. The age and comorbidity case mix of the cohort was similar to that of the US population [ ].
| Characteristic | N = 2,046 a |
|---|---|
| Age (IQR) | 66 (58, 72) |
| Age | |
| 35–44 | 35 (1.7%) |
| 45–54 | 169 (8.4%) |
| 55–64 | 675 (33%) |
| 65–74 | 812 (40%) |
| 75–84 | 287 (14%) |
| 85+ | 43 (2.1%) |
| Health Literacy | |
| Not at all | 20 (1.0%) |
| A little bit | 32 (1.6%) |
| Somewhat | 188 (9.2%) |
| Quite a bit | 594 (29%) |
| Extremely | 1,212 (59%) |
| Race | |
| White | 1,446 (73%) |
| Black | 435 (22%) |
| Asian | 53 (2.7%) |
| American Indian | 17 (0.9%) |
| Multi-race | 30 (1.5%) |
| Hispanic | |
| No | 1,812 (89%) |
| Yes | 230 (11%) |
| Education | |
| Associate/Bachelors | 776 (38%) |
| Masters/Professional/Doctorate | 330 (16%) |
| Other | 940 (46%) |
| Income | |
| Less than $25,000 | 371 (18%) |
| $25,000–$49,999 | 546 (27%) |
| $50,000–$74,999 | 424 (21%) |
| $75,000–$99,999 | 272 (13%) |
| $100,000–$149,999 | 236 (12%) |
| $150,000 or more | 158 (7.7%) |
| Prefer not to answer | 39 (1.9%) |
| PCCI | |
| 0 | 617 (30%) |
| 1 | 468 (23%) |
| 2 | 430 (21%) |
| 3 | 219 (11%) |
| 4 | 139 (6.8%) |
| 5+ | 173 (8.5%) |
Related posts:
 Is primary retroperitoneal lymph node dissection the way forward for patients with testicular seminoma and limited retroperitoneal metastases?
 Critical care therapy and in-hospital mortality after radical nephroureterectomy for nonmetastatic upper urinary tract carcinoma
 The clinical relevance of cut-off percentage for high-grade urothelial carcinoma within low-grade urothelial carcinoma: A determining factor?
 Cumulative smoking exposure impacts oncologic outcomes of upper tract urothelial carcinoma
Multicenter study of active surveillance for small renal masses: Real world practice pattern
Cumulative smoking exposure impacts oncologic outcomes of upper tract urothelial carcinoma
Multicenter study of active surveillance for small renal masses: Real world practice pattern
 Pathologic prostate cancer grade concordance among high-resolution micro-ultrasound, systematic transrectal ultrasound and MRI fusion biopsy
Stay updated, free articles. Join our Telegram channel

Full access? Get Clinical Tree


