UICC subdivisions
Description
JPS
Description
Superior
Sup. to head and body
Inferior
Inf. to head and body
Anterior
Ant. pancreaticoduodenal, pylorica, proximal mesenteric
Group 1:13a,* 13b,* 17a,* 17b*
Posterior surface of the pancreatic head; anterior surface
Posterior
Posterior pancreaticoduodenal, common bile duct, proximal mesenteric
Group 2: 6,* 8a,* 8p,* 12a,* 12b,* 12p,* 14p,* 14d*
Infrapyloric, common hepatic artery, hepatoduodenal ligament, SMA
Splenic
Hilum of spleen and tail of pancreasb
Group 3: 1, 2, 3, 4, 5, 7, 9*, 10, 11p,* 11d, 15, 16a2, 16b1, 18*
(See below table)
Coeliac
a
7.2 Pathology
Currently, the seventh edition of the UICC classification is in use (Sobin et al. 2009). The classification discriminates the anatomical subsites head, body and tail of the pancreas for pancreatic ductal adenocarcinoma (PDAC). The definition for tumours of the head of the pancreas is to the right of the left border of the superior mesenteric vein. Consequently, tumours of the body are to the left of this line. The left border of the aorta classifies tumours as located either in the body or tail of the pancreas (Figs. 7.1 and 7.2). The regional lymph nodes for pancreatic tumours are shown in Table 7.1. The T-categories are:
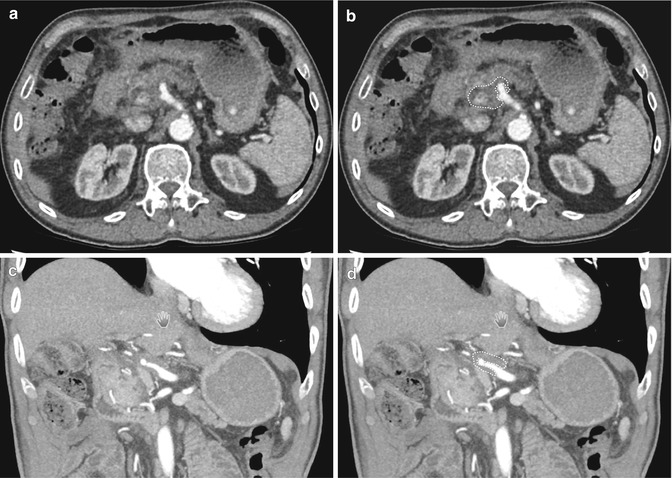
Fig. 7.1
Tumour location. (a) Schematic frontal view of the three sections of the pancreas. 1. Head of the pancreas: Tumours arising to the right of the left border of the superior mesenteric vein including the incinate process. 2. Body of the pancreas: Tumours arising between the left border of the superior mesenteric vein and the left border of the aorta. 3. Tail of the pancreas: Tumours arising between left border of the aorta and the splenic hilum. (b) and (c): two transversal planes depicting the head, body and tail of a healthy pancreas as explained in (a). (d) Coronal plane showing the head of the pancreas just below the portal vein (PV) and its relation to the duodenum (D), the vena cava inferior (VCI) and the aorta (A)
Fig. 7.2
Delineation of the gross target volume. (a) Arterial phase CT with a hypodense tumour mass around the common hepatic artery. (b) Same as (a) with tumour outlined in white dashed line. (c) Coronal view of the same tumour (d) Same as (c) with tumour outlined in white dashed line
T1: tumour limited to the pancreas, ≤2 cm in greatest dimension.
T2: tumour limited to the pancreas, >2 cm in greatest dimension.
T3: tumour extends beyond the pancreas but without involvement of coeliac axis or superior mesenteric artery.
T4: tumour involvement of coeliac axis or superior mesenteric artery.
Together with the lymph node status discriminating N0 (no regional lymph node metastasis) and N1 (regional lymph nodes metastasis) based on examination of ≥10 lymph nodes for pN-category, this leads to the following stage grouping:
Stage | T-category | N-category | M-category |
|---|---|---|---|
Stage IA | T1 | N0 | M0 |
Stage IB | T2 | N0 | M0 |
Stage IIA | T3 | N0 | M0 |
Stage IIB | T1, T2, T3 | N1 | M0 |
Stage III | T4 | Any N | M0 |
Stage IV | Any T | Any N | M1 |
7.3 Visualisation
The role of imaging for pancreatic cancer has to fulfil basically three distinct endpoints: first of all, the primary tumour has to be identified; next, distant metastasis has to be identified to decide whether resection of the tumour is justified. Third, in the absence of distant metastasis, imaging needs to inform about local tumour resectability. Pancreatic cancers are categorised into resectable, borderline resectable and non-resectable. An expert consensus statement has recently defined these three stages based on contrast-enhanced multi-detector computed tomography (CE-MDCT) (Callery et al. 2009).
7.3.1 Computed Tomography
MDCT is the single most important imaging tool to detect and to stage pancreatic cancer (Prokesch et al. 2003; Shrikhande et al. 2012; Varadhachary et al. 2006; Zeman et al. 1997; Pawlik et al. 2008). A localised tumour mass is the leading criterion in pancreatic cancer. Modern MDCT protocols use a dual-phase technique. 30 s after the intravenous injection of contrast, the arterial phase is acquired, and about 1 min after injection, the portal venous phase is taken. It is necessary to perform a rapid injection (3–5 mL/s) to maximise enhancement of the pancreas and mesenteric vasculature. MDCT has improved spatial and temporal resolution dramatically. The arterial phase images are required for visualisation of the primary tumour as well as evaluation of the arterial vasculature and its relationship with the tumour to predict resectability (Varadhachary et al. 2006). Pancreatic neuroendocrine tumours which are typically hypervascular can also be distinguished best in the arterial phase from PDAC. Compared to the surrounding normal pancreatic parenchyma, most PDACs are hypodense. In 5–10 % of PDACs, there is isoattenuation in both arterial and venous phase images. The subsequent venous phase is required to assess the liver and mesenteric venous vasculature as well as locoregional lymphadenopathy (Horton and Fishman 2002).
Most often water is used as a neutral oral contrast agent for visualisation of the stomach, the duodenum and the jejunum. Typically, thin collimation technique with slice thickness of around 0.6 mm is used with the reconstruction algorithm for 3–5 mm slices for standard interpretation. A second reconstruction at 0.5–0.75 mm is performed to create isotropic multi-planar reformations and 3D reconstructions. Often, two sets of 3D images are created: maximum intensity protection (MIP) and volume-rendered (VR) images. MIP imaging is invaluable for angiographic images to assess the relation of the tumour to the surrounding vasculature. VR allows optimal definition of the soft tissues, muscle, bone, and vasculature to demonstrate complex relationships between different structures at pathology.
For tumour detection, the sensitivity of MDCT is reported between 88 and 98 %. The smaller the tumours, the more difficult they are to visualise. PDACs tend to infiltrate dorsally into the retroperitoneum. Vessel involvement is of highest importance for the staging of local PDAC to classify pancreatic tumours into resectable, borderline resectable and non-resectable. One of the problems of the currently available literature is that discrepancies exist between the definitions of resectability, and therefore, it is highly recommended to consistently use the definition based on expert consensus statement published by Callery (Callery et al. 2009), which defines borderline resectable tumours as:
1.
Venous involvement of the superior mesenteric vein (SMV)/portal vein, demonstrating tumour abutment with or without impingement and narrowing of the lumen, encasement of the SMV/portal vein but without encasement of the nearby arteries, or short segment venous occlusion resulting from either tumour thrombus or encasement but with suitable vessel proximal and distal to the area of vessel involvement, allowing for safe resection and reconstruction.
2.
Gastroduodenal artery encasement up to the hepatic artery with either short segment encasement or direct abutment of the hepatic artery, without extension to the coeliac axis
3.
Tumour abutment of the superior mesenteric artery (SMA) not to exceed >180° of the circumference of the vessel wall (Callery et al. 2009).
Tumour infiltration into the duodenum is important for the radiation oncologist because the duodenum is one of the dose-limiting organs for radiotherapy of pancreatic cancers. The loss of the fat plain between the mass and the duodenum, thickening of the duodenal wall, the extension of the tumour around the duodenum or duodenal obstruction are all signs of duodenal infiltration. A comparison between the tumour dimensions as measured on CT and pathology showed that the sensitivity of CT regarding duodenal invasion is quite low (Arvold et al. 2011). Unfortunately, endoscopic ultrasound is also not very sensitive to detect duodenal infiltration and cannot help to resolve the dilemma between tumour coverage and sparing of the duodenum as an important organ at risk.
Nodal disease is an important prognostic factor in pancreatic cancer, and the seventh classification of the UICC reflects this in defining stage IIB irrespective of T-category. Unfortunately, the ability of CT to distinguish malignant nodes is limited. It is purely based on size threshold of short axis ≥1 cm (Zeman et al. 1997). Correspondingly, the sensitivity of CT for positive nodes may be as low as 22 % (Pawlik et al. 2008). CT is well suited to identify metastatic disease to the liver which is best detected during the portal venous phase.
7.3.2 Magnetic Resonance Imaging
Advantages of MRI over CT are mainly based on the superior tissue contrast (Vachiranubhap et al. 2009). Due to the rich desmoplastic reaction characterised by fibrous stroma, PDAC is good visualised on fat-suppressed T1-weighted images. Tumours tend to be T1 hypointense in comparison with the relatively bright pancreatic parenchyma which avidly enhances on arterial phase images. With time, these tumours tend to increase enhancement on venous and delayed images. Therefore, MRI can be helpful to detect small tumours which can be difficult to visualise on CT especially below a size of 2 cm (Park et al. 2009; Fusari et al. 2010). An important indication for the use of MRI is isoattenuating pancreatic cancer which occurs in about 5–10 % of all pancreatic tumours. In these cases, MRI is an important tool to define the gross tumour volume (GTV) for radiotherapy because of its superior soft tissue contrast (Kim et al. 2010). A comparison between tumour sizes on abdominal MRI with pathologic specimen in resected tumours in 92 patients in 3D VIBE MRI showed that MRI underestimated tumour size by a median difference of 4 mm (range, −34 to 22 mm) (Hall et al. 2013). This is useful information for the expansion of GTV to clinical target volume (CTV). Additionally, alternative sequences can be useful. One of these is magnetic resonance cholangiopancreatography (MRCP) which is helpful to show subtle ductal narrowing (Miller et al. 2006). Diffusion-weighted images (DWI) measuring the random motion of water molecules within tissue render apparent diffusion coefficient (ADC) values. The motion of water is limited within tumours, and therefore, low ADC values can help to identify small lesions (Wang et al. 2011).
Compared to CT, enlarged lymph nodes are more conspicuous on MRI, especially on T2-weighted fat-suppressed sequences. Also, lymph nodes in the mesenteric fat are well visualised on non-fat-suppressed T1-weighted images because in this sequence lymph nodes appear in lower signal compared to the high-signal fat. MRI is particularly good in evaluating hepatic metastasis especially in small lesions where MDCT has limitations. Metastases are slightly hypointense on T1-weighted images and mildly hyperintense on T2-weighted images. Most lesions have peripheral enhancement on post-contrast images and wedge-shaped peripheral enhancement in the arterial phase (Miller et al. 2006).
7.3.3 FDG-PET Imaging
Positron-emission tomography (PET) imaging without a contrast-enhanced CT component is not of use for screening purposes. However, PET-CT with IV contrast may help differentiate benign and malignant pancreatic lesions. The positive predictive value of PET-CT is up to 91 %, but the negative predictive value of only 64 % is problematic. Therefore, there is a high propensity for false-negative findings. False-negative findings are often observed as a consequence of hypoglycaemia or diabetes. The resolution of PET is best for lesions that are larger than 1 cm in diameter below which there is a high likelihood of false-negative results (Grassetto and Rubello 2011). Another situation where fluorodeoxyglucose (FDG)-PET imaging can be very helpful for tumour delineation is when the tumour infiltrates into the duodenum. Specifically, if patients have had a gastric bypass preventing appropriate oral contrasting of the duodenum, it can be very difficult to appropriately visualise tumour extension, and PET-CT is able to better discriminate duodenum from tumour.
The sensitivity and specificity of PET-CT for locoregional nodal disease have been reported to be only 46 and 63 %, respectively (Pakzad et al. 2006; Kauhanen et al. 2009). The most important reason to explain this poor performance is the insufficient resolution for lesions smaller than 1 cm. However, PET-CT plays a more important role for the detection of distant metastatic disease when combined with contrast-enhanced CT (Table 7.2). One study reported a change in resectability status in 21.5 % of the patients and change of the pretreatment stage in 26.9 % of the patients (Bang et al. 2006).
Table 7.2
Comparison of imaging modalities
Primary tumour | Resectability | Lymph nodes | Distant metastases | Restaging | |
|---|---|---|---|---|---|
MDCT (method of choice) | Very good | Not particularly specific | Good for hepatic metastases >1 cm; poor for peritoneal metastases | Poor: because of desmoplastic reaction | |
MRTa | Preferred for 5–10 % PDAC that are isodense on CT | Inferior | Superior: peripancreatic and mesenteric fat | Depicts small liver lesions | Poor |
FDG-PET/CT | Duodenal infiltration | Poor | Poor | Superior | Intermediate: might depict vital tumour cells |
Evaluation of response to therapy in patients with locally advanced pancreatic cancer is not satisfactory with MDCT. Regression of primary tumours is rarely observed due to the rich desmoplastic reaction in pancreatic tumour masses which cannot be discriminated from viable tumour. PET-CT is superior to MDCT in that respect because it is evaluating viable tumour cells and can discriminate a scar from a true tumour mass (Grassetto and Rubello 2011). However, one pitfall is an inflammatory reaction appearing as a false-positive finding, a typical example for this is cholangitis. A small study in 15 patients before and after chemoradiotherapy showed that tumour response was observed more frequently at PET imaging compared to CT imaging (Bang et al. 2006).
7.4 Target Volume Delineation of the Primary Tumour
7.4.1 GTV Delineation
7.4.1.1 Definitive and Neoadjuvant Treatment
The volumes of interest should be defined in accordance with the ICRU 50/62 guidelines. For GTV definition, the above-described characteristics of tumour visualisation are important. GTV definition relies on a contrast-enhanced thin slice CT planning scan in the arterial contrast phase. Alternatively a planning scan in the venous contrast phase can also be used when an arterial contrast phase scan is registered to the planning scan or visually taken into account on a second monitor for the delineation of the tumour. The GTV is defined as a hypodense area in the contrast-enhanced high-resolution CT scan (slice ≤3 mm) as shown in Figs. 7.3 and 7.4. The edge of pancreatic head tumours towards the duodenum can often only reliably be visualised if water as a negative contrast agent is administered prior to the scan. Of note, CT scans have been found to underestimate the extent of infiltration of PDAC into the duodenum (Arvold et al. 2011). Indirect signs of the tumour should also be taken into account. Often dilatation of the pancreatic duct and/or the bile duct (prior to stent insertion) is helpful to determine the border of the tumour at these structures. As the exact margins of pancreatic tumours are often difficult to define, even by experienced radiologists, GTV delineation should be undertaken in conjunction with, or after discussion with, a radiologist.
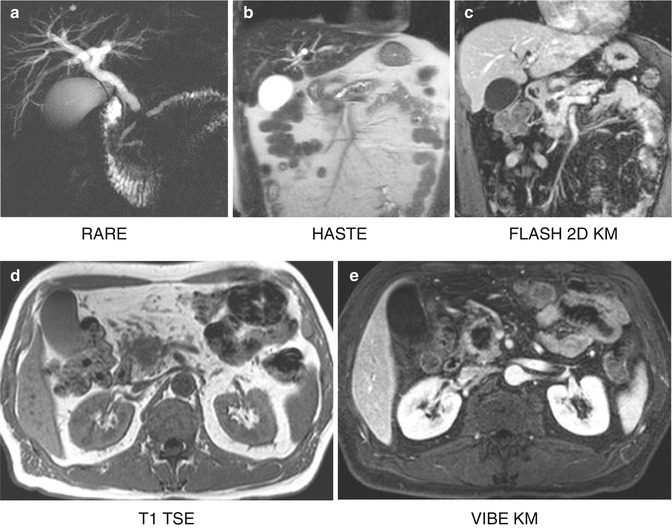
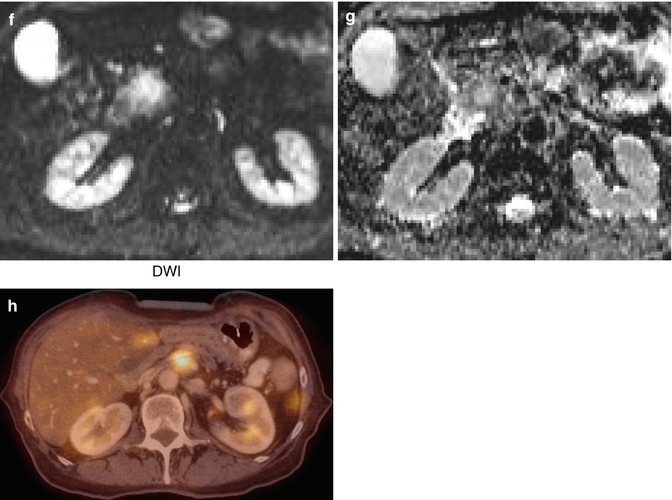
Fig. 7.3
Patient with a tumour in the pancreatic head after insertion of a stent into the common bile duct (pink = GTV; blue = PTV)
Fig. 7.4
MRI imaging of a pancreatic tumour in a 62-year old patient. (a) Double duct sign in the RARE sequence, caused by a mass in the pancreatic head seen in HASTE (b); hypointense in FLASH 2D (c), T1 TSE (d) and VIBE with contrast (e); the mass appears hyperintense in DWI (f) and (g). (h) FDG-avid local tumour relapse in PET/CT imaging dorsally to the splenic vein
As mentioned above, about 5–10 % of pancreatic tumours are isoattenuating. A gadolinium-enhanced MRI (ideally in treatment position) registered to the planning CT should be used for the delineation of the GTV in such cases. If information regarding disease extent from PET scans is available, then this can be used in addition. We have found this helpful to delineate areas of tumour infiltration into the duodenum especially after a gastric bypass procedure where oral contrasting of the bowel is not possible. Accurate delineation of the GTV is of highest importance to fully encompass the tumour with an adequate dose but also to avoid unnecessary enlargement of the treatment volumes to avoid toxicity. The two most critical organs in that respect are the duodenum and the stomach.
7.4.1.2 Adjuvant Treatment
After resection, there is by definition no GTV at the time of radiotherapy (Goodman et al. 2012). In the case of incomplete resection (R1-resection) the surgical, pathologic and preoperative imaging information should be used to identify the region where microscopic tumour has been left. Again, by definition, this is not the GTV, but a CTV.
7.4.2 Clinical Target Volume Delineation of the Primary Tumour
7.4.2.1 Definitive and Neoadjuvant Treatment
There is no clear consensus on the size of the margin around the GTV to derive a CTV, and many institutions will expand the GTV directly into a planning target volume (PTV). Never-theless, if a CTV of the primary tumour is created, the margin expansion is 5 mm in most reports (McGinn et al. 2001; Muler et al. 2004; Jackson et al. 2010). A detailed analysis comparing pathologic tumour sizes with tumour sizes on CT scans before surgical resection showed that the size on CT scans is significantly smaller compared to pathology measurements (Arvold et al. 2011). This effect was more pronounced in smaller tumours compared to larger tumours. The authors derived an expansion formula from GTV to CTV taking into account the standard error to cover 97.5 % of the tumours: CTV primary expansion in millimetres = 19 mm −1/8 × (CT maximum tumour size in mm). The problem of this formula is that the expansion margins are very large compared to clinical practice. For example, for a tumour measuring 2 cm on CT scan, an expansion margin of 16.5 mm circumferentially would have to be added. Adding such a large margin for GTV to CTV expansion would prevent adequate protection of the duodenum and the stomach in a large number of patients after subsequent further expansion for patient positioning and respiratory movements to obtain the PTV. Therefore, we do not recommend the use of this formula at this time. At our institution, we expand the GTV directly into a PTV.
Related posts:

Stay updated, free articles. Join our Telegram channel

Full access? Get Clinical Tree


