Drug
Factor influencing PK
PK/PD relationship
PK parameter
PD (efficacy, toxicity)
Tyrosine kinase inhibitors
Sorafenib
C trough
PFS
Skin toxicity
Hand-foot reaction
Hypertension [3]
AUCcum
Any grade ≥ 3 toxicity [1]
Sunitinib
Body size
AUC ss
TTP
Polymorphisms of ABCG2
OS
SD
Fatigue [6]
C trough
dBP [6]
AUCcum
ANC [6]
Axitinib
AUC ss
PFS
OS
dBP [15]
Pazopanib
Fat meals
C trough, ss
PFS
Tumor shrinkage
BP
Hand-foot syndrome [18]
Mammalian targets of rapamycin inhibitors
Everolimus
Ctrough, ss
Tumor size reduction
Risk of PFS events
Grade ≥ 3 pulmonary
Grade ≥ 3 stomatitis
Grade ≥ 3 metabolic events [22]
Temsirolimus
Body surface area
AUCsum
Severity for thrombocytopenia, pruritus, hyperlipidemia [25]
Hematocrit
16.2 Tyrosine Kinase Inhibitors
16.2.1 Sorafenib
16.2.1.1 Factors Influencing PK
Sorafenib is metabolized by cytochrome P450 (CYP) 3A4 and UDP-glucuronosyltransferase (UGT) 1A9. It was reported that the genetic polymorphisms of UGT1A9 influence on the PK of sorafenib [1]. A population pharmacokinetic (PPK) analysis of sorafenib in 111 patients with solid tumor from five phase I and II clinical trials demonstrated that baseline bodyweight was a statically significant covariate for distribution volume, accumulating for 4 % of interindividual variability. In other PPK analyses, no clinically important PK covariates were identified in evaluating the possible effects of genetic polymorphisms of CYP3A4/5 and UGT 1A9 [2].
16.2.1.2 PK/PD Relationship
Early clinical trials showed that higher C trough in sorafenib-treated patients were moderately predictive of prolonged progression-free survival (PFS). A weak relationship between C trough and skin toxicity, as well as hand-foot skin reactions and hypertension, was also observed [3]. In a preliminary study in 58 patients with advanced or metastatic solid tumors treated with sorafenib, increased cumulated sorafenib exposure (AUCcum) between day 0 and day 30 was independently associated with any grade ≥3 toxicity (P = 0.037). Additionally, the threshold AUCcum value of 3161 mg·h/L was associated with the highest risk to develop any grade ≥3 toxicity (P = 0.018) [1].
16.2.2 Sunitinib
16.2.2.1 Factors Influencing PK
Body size affects volume of distribution but not clearance for sunitinib in patients with RCC [4]. CYP3A4 metabolizes sunitinib to its active N-desethyl metabolites, SU12662, and subsequently into SU14335 and other inactive metabolites. Sunitinib is a substrate of the efflux transporters ATP-binding cassette transporter P-glycoprotein and the breast cancer-resistant protein encoded by the ABCB1 and ABCG2 genes, respectively. Genetic polymorphism of ABCG2 was identified as a significant covariate for the prediction of oral clearance (CL/F) of sunitinib by PPK analysis [5].
16.2.2.2 PK/PD Relationship
In a PK and PD meta-analysis, tentative relationships were identified between the following:
- 1.
Steady-state AUC (AUCss) of total drug (sunitinib + its active metabolite SU12662) and time to tumor progression (TTP); overall survival (OS), with AUC significantly associated with longer TTP and OS in patients with mRCC; and incidence, but not severity, of fatigue
- 2.
Steady-state AUC of sunitinib and response probability, with AUC significantly associated with objective response and stable disease (SD) in patients with mRCC (Fig. 16.1)
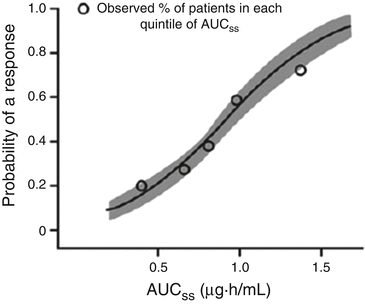
Fig. 16.1
Probability of partial or complete response (by RECIST criteria) versus average daily AUCss to sunitinib in mRCC. Lines represent model prediction and shaded area represents 95 % confidence interval
- 3.
Dose and tumor size reductions
- 4.
Total drug C trough and diastolic blood pressure (dBP), with a typical patient on sunitinib 50 mg QD (the recommended dose) predicted to experience a maximum dBP increase of 8 mmHg
- 5.
AUCcum of total drug and absolute neutrophil count (ANC), with ANC reductions occurring predominantly after one treatment cycle (Fig. 16.2) [6]
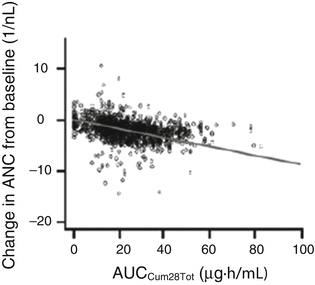
Fig. 16.2
Measured and population-directed (straight line) changes in absolute neutrophil count (ANC) by sunitinib exposure in mRCC
The frequency of the ABCG2 421 AA genotype, which developed severe toxicities due to high exposure of sunitinib and SU12662 [5], is higher in Asian populations (Japanese, 7 % [7]; Korean, 8 % [8]; and Chinese, 12 % [9]) than in non-Asian populations (Caucasian, 1.7 % and African, 0.2 % [9]). Thus, this racial difference in the frequency of the ABCG2 421 AA genotype could explain the higher frequency of grade 3 and 4 sunitinib-related toxicities in Asians [10, 11] than in non-Asians [12].
16.2.3 Axitinib
16.2.3.1 Factors Influencing PK
Axitinib is metabolized primarily by CYP 3A4/5 and to a lesser extent (<10 % each) by CYP1A2, CYP2C19, and UGT1A1. Axitinib is also a substrate for the drug transporters P-glycoprotein and OATP1B1 encoded by the ABCB1 and SLCO1B1 genes, respectively. Meta-analysis was performed using AUC0-∞ data measured in 315 healthy subjects from 11 clinical pharmacology trials to examine potential influences of genetic polymorphisms in drug-metabolizing enzymes or transporters on axitinib pharmacokinetics. The results demonstrated no statistically significant associations between the specific genetic polymorphisms analyzed and axitinib plasma exposures and that none of them contributed >5 % to the overall pharmacokinetic variability of axitinib [13]. The lack of the pharmacogenetic effect of CYP2C19 and UGT1A1 on axitinib pharmacokinetic variability was also supported by the PPK analysis of axitinib in 337 healthy subjects from 10 phase I studies [14].
16.2.3.2 PK/PD Relationship
In a PPK analysis of 383 healthy volunteers, 181 patients with mRCC and 26 patients with other solid tumors in 17 trials, the median(range) for AUC at the end of 4 weeks (AUC ss ) was 375 ng·h/mL (32.8–1728). The relationship between axitinib plasma exposure and the probability of response (i.e., 1.5-fold increase in the probability of achieving a partial response for every 100 ng·h/mL increase in AUC ss ) in 168 metastatic RCC patients was demonstrated (P < 0.0001). Patients were stratified by having an AUC ss greater or equal to axitinib total daily therapeutic exposure of 300 ng·h/mL (high AUC ss ) or <300 ng·h/mL (low AUC ss ). Median PFS in the high-AUC ss group was significantly longer than median PFS in the low-AUC ss group (13.8 months vs. 7.4 months, respectively; hazard ratio [HR] 0.558; P = 0.003). Similarly median OS of 37.4 months in the high-AUC ss group was considerably longer than the 15.8 months in the low-AUCss group (HR 0.489; P < 0.001) shown in Table 16.2. These results indicated significant associations between AUC ss and clinical responses for axitinib. When used as a continuous variable, the result was more significant than using a cut-off value of 300 ng·h/mL. For PFS and OS, the HR was 0.871 (P = 0.001) and 0.810 (P < 0.001) for every 100 ng·h/mL increase in AUC ss , respectively (Table 16.2). In toxicity, a weak correlation between exposure and dBP (r 2 value<0.10) was shown [15].
Table 16.2
Univariate cox proportional hazards analysis of progression-free and overall survival
Covariates | mPFS, months | HR(95 % CI) | Pa | mOS, months | HR(95 % CI) | Pa |
|---|---|---|---|---|---|---|
Age | ||||||
Continuous | – | 1.006(0.986,1.026) | .593 | – | 0.992(0.972,1.01) | .480 |
Gender | ||||||
Male | 13.0 | 1 | – | 27.7 | 1 | – |
Female | 7.63 | 1.63(1.09,2.46) | .018 | 19.6 | 1.26(0.799,1.97) | .324 |
Prior therapy | ||||||
Cytokine refractory | 13.0 | 1 | – | 30.0 | 1 | – |
Sorafenib refractory | 7.63 | 1.55(1.02,2.34) | .038 | 15.8 | 2.15(1.39,3.34) | <.001 |
ECOG PS | ||||||
0 | 13.7 | 1 | – | 41.6 | 1 | – |
1 | 7.13 | 2.17(1.46,3.23) | <.001 | 10.7 | 3.63(2.40,5.48) | <.001 |
Hemoglobin(g/dL) | ||||||
≤13 for male, ≤11.5 for female | 7.69 | 1 | – | 15.9 | 1 | – |
>13 for male, >11.5 for female | 14.6 | 0.537(0.364,0.792) | .001 | 43.3 | 0.282(0.179,0.443) | <.001 |
Corrected serum calcium, mg/dL
Stay updated, free articles. Join our Telegram channel
Full access? Get Clinical Tree
 Get Clinical Tree app for offline access

| ||||||

