Fig. 7.1
Structure of the BCR–ABL1 fusion gene. Panel (a) illustrates the common breakpoints of the BCR and ABL1 genes; panel (b) shows the common transcipt types. The most common BCR–ABL1 transcripts encountered in CML are e13a2 and e14a2, leading to production of a 210 kDa BCR-ABL1 protein (p210). Occasionally, a patient may have both transcripts. Breakpoints are highly individualised and occur in the introns within the M-BCR region between exons 13 and 15 of the BCR gene and within a large 200 KB region before exon 2 of ABL1. Intronic breakpoints of the BCR gene between exons 1 and 2 and between exons 19 and 20 are called the m-BCR and μ-BCR regions, respectively, and give rise to the e1a2 transcript common in Ph + ALL and e19a2 transcript common in the thrombophilic variant of CML. Other breakpoints (v-BCR) are also occasionally encountered (figure originally published in Weerkamp et al. [54]. Reproduced with permission. © by the Nature Publishing Group)
The general workflow starts with either anticoagulated blood or marrow from the patient. Both blood and bone marrow correlate equally well with the amount of residual leukaemic cells, and either tissue type is acceptable for longitudinal monitoring of treatment response. However, occasional patients have significantly discordant results between marrow and blood BCR–ABL1 transcript numbers, and sequential analysis should rely on results from one tissue type. This is usually peripheral blood as it is more readily available [7]. Specimen quality is of paramount importance in maximising the sensitivity and minimising the variability of a BCR–ABL1 RT-qPCR result. RNA is labile and subjected to degradation by enzymatic (endogenous RNAses) and nonenzymatic processes. After 72 h at room temperature, mRNA transcripts of interest such as ABL1 may have fallen to 13 % of its original value [8]. Delays in specimen transport therefore lead to decreased test sensitivity and false-negative results. Specimens should therefore be transported to the laboratory as soon as practicable in a suitable anticoagulant such as EDTA. Carry over heparin may interfere with downstream enzymatic processes and this anticoagulant should be avoided [9]. Specimens should ideally be shipped with cool packs, but not frozen. Alternatively, the specimen may be collected into tubes containing an anticoagulant as well as additives that inhibit RNA degradation. These tubes are commercially available (e.g. PAXgene™) which may also provide proprietary RNA extraction methods [8, 10, 11] and are particularly attractive for centralised molecular monitoring (e.g. in a clinical trial setting). The PAXgene system is, however, more bulky (each PAXgene tube accommodates 2.5 mL of blood) and may be more expensive for routine use. RNA extraction from the PAXgene system is also inferior to the Trizol™ method (see below) for stabilisation and extraction of RNA in terms of assay sensitivity [12–14].
On sample receipt, erythrocytes are lysed (or removed by Ficoll centrifugation) and RNA is extracted from the resulting leucocytes pellet. This is frequently done using the guanidinium thiocyanate-phenol-chloroform method (with commercially available reagent such as TRIzol™ or Triagent™) [15]. Guanidinium thiocyanate and phenol inhibit protein activity; RNA in this solution is stable and can be stored for long periods without degradation, allowing for extraction to be batched. Using this method, DNA from the same samples may also be extracted with additional steps if desired. Both chloroform and phenol are toxic, however, and need specialised handling. RNA can also be extracted using column methods, a more convenient but expensive alternative.
Prior to qPCR, cDNA is first synthesised from RNA. The RT reaction is probably the greatest contributor to the variability of the RT-qPCR assay results, and optimisation of RT efficiency is a critical determinant of the overall sensitivity of the assay [7, 16]. A modified MMLV (Moloney Murine Leukaemia Virus) derived reverse transcriptase enzyme (such as Superscript™ from Invitrogen) is most commonly used, with the reaction primed with random hexamers. Studies have demonstrated that random pentadecamers may improve cDNA yield, though this is not commonly used [17, 18]. Gene-specific primers increase the specificity of the reaction and are favoured in one-step assays [19]. An RNAase inhibitor is commonly used to enhance reaction yield.
To maximise the specificity of the qPCR assay, probes and primers may be designed to bind across exon boundaries to avoid amplification of genomic DNA. Laboratories may optimise their individual primer and probe design or alternatively adopt primers and probe sequences as published by the Europe Against Cancer (EAC) standardisation and quality control project (Fig. 7.2). These primers are designed to quantify both e13a2 and e14a2 in the same reaction with a forward primer situated in BCR exon 13. In some laboratories (such as ours), the e13a2 and e14a2 transcripts are quantified in separate reactions (and added arithmetically in patients known who express both transcripts to derive the total BCR–ABL1). A set of standards with known concentrations of the target and control genes are run alongside patient samples. These may be RNA templates, though DNA plasmids are more commonly used as it has greater stability, and may include sequences of both target and the control gene within the same plasmid [20]. Many laboratories use standards derived from custom produced plasmid mixtures in serial dilutions, though standards calibrated to WHO reference materials are increasingly available through manufacturers of RT-qPCR kits (see below). The standard curve should be constructed from data points spanning the entire reported range of the assay using tenfold dilutions and should not be extrapolated to interpret assay results falling outside of either extremes. Linearity of each standard curve should be verified with correlation coefficients of >0.98 [7]. The coefficient of variation (CV) of results for standards with the lower copy numbers may be quite high, and it is our practice to include some dilutions of the standard as replicates in each assay to avoid ill-fitting curves. The transcript numbers of unknown samples are then calculated from their Ct values via the standard curve.
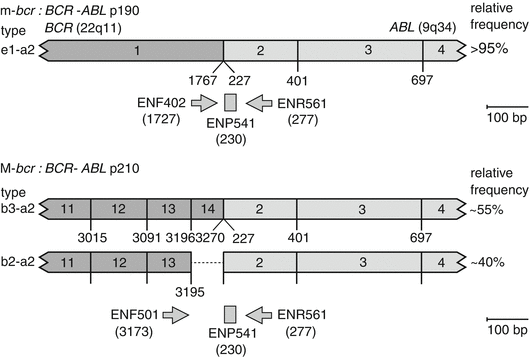

Fig. 7.2
Standardised primers and hydrolysis probes for BCR–ABL1 RT-qPCR used in the Europe Against Cancer project (Figure originally published in Gabert et al. [30]. Reproduced with permission. © by the Nature Publishing Group)
Known negative and positive controls are included as quality control with each batch of samples processed, including all the steps from RNA extraction right through to calculation of the BCR–ABL1 ratio. For instance, in our laboratory, a high control and a low control are included with each batch, being mixtures of BCR–ABL1 positive cell lines Molm-1, K562 and SUP-B15 diluted in HeLa to give ratios of about 10 and 0.1 %. HeLa is used as a negative control. When these results are tracked longitudinally, characteristics of the assay, such as accuracy, precision, linearity, sensitivity, specificity and reportable range, may then be determined for the specific laboratory. Assay results from these controls also determine if results from a batch should be accepted when measured against predetermined assay tolerances (such as those suggested by Westgard) [21].
It is important to recognise that even with an optimised method and best quality assurance practices, there is an underlying variability inherent to RT-qPCR assays due both to technical factors and biological factors. Performing duplicate analyses is one way to minimise the effect of errors and variability due to technical factors. A study was undertaken in our laboratory where a sample was analysed repeatedly on 198 occasions, from the RT step through qPCR to result reporting. The mean of the results was 0.08 % (0.1 % IS). The two standard deviation range of results was 0.02–0.14 %, implying a CV of 35.1 %. However, when results were calculated as the mean of duplicate analyses, the CV fell to 25.6 % [7].
Detection of very low copy numbers using qPCR is challenging and the probability of obtaining an assay result that accurately reflects the true number of starting templates follows a Poisson distribution. For instance, using this distribution, one can predict that repeated testing performed on a sample with one known copy of BCR–ABL1 will not only return a result of one copy, but some assays will also return a result of either 0 or 2 by chance. The lower limit of detection and the lower limit of quantification should be set for each laboratory individually based on local experience of reproducibility, though in general we would not regard copy numbers <3 as being reproducible and would calculate test sensitivity based on a minimum detectable BCR–ABL1 of ≥3 [22].
A significant problem for qPCR assays is the potential for contamination leading to false positives, and it is important to minimise this risk through good laboratory practice. This include the spatial separation of working areas where specimen preparation, RNA preparation and qPCR are performed and dedicated areas where reagents are kept and assays are set up. Use of disposable gloves and filtered pipette tips are recommended, and workers should change gloves and gowns when transiting between different areas. Laboratory surfaces should be regularly cleansed with appropriate chemical agents and critical areas should be exposed to UV radiation to breakdown contaminating nucleic acids. The replacement of thymidine with uracil and the use of uracil-N-glycosylase may prevent contamination from carry-over of previous amplicons [23].
7.2.1 Control Gene Measurement
Aside from the accurate measurement of BCR–ABL1 transcript numbers within each sample, a control gene is also quantified routinely. The term housekeeping gene is not preferred. Control gene measurement is crucial in demonstrating RNA quantity and quality and ensuring specimen acceptability by highlighting any potential RNA degradation. It allows for the BCR–ABL1 transcript numbers to be reported as a ratio and also helps to establish the sensitivity of each assay. All things being equal, the sensitivity of an assay increases with the number of measurable control gene transcripts [24] (Fig. 7.3 and Table 7.1).
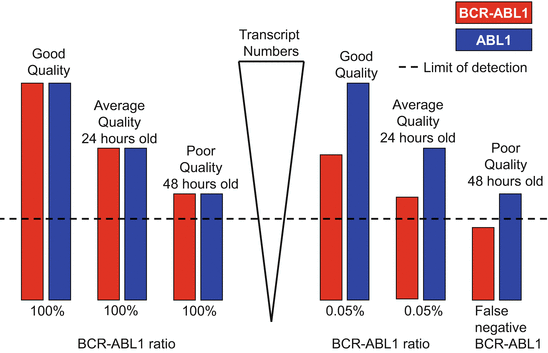

Fig. 7.3
The effect of specimen quality on measured transcript numbers and BCR–ABL1 result subsequently reported can be judged from the control gene transcript numbers. (Height of the bars approximates a logarithmic scale.) A specimen from a patient with newly diagnosed CML is simulated on the left. Measurement of the specimen soon after collection showed BCR–ABL1:ABL1 ratio to be 100 %, with adequate copies of both target and control gene transcripts. With specimen degradation over time, both BCR–ABL1 and ABL1 transcripts degrade at the same rate, and the ratio remains the same. A specimen with a BCR–ABL1 ratio of 0.05 % is simulated on the right. Specimen quality is adequate for BCR–ABL1 quantification at the time of collection. After 24 h, the BCR–ABL1 transcripts are barely detectable, though the ratio of BCR–ABL1:ABL1 remains the same. After 48 h, the BCR–ABL1 transcripts had fallen to an undetectable level leading to a false-negative result
Table 7.1
Correlation between control gene copy numbers and test sensitivity and subsequent categorisation of molecular response for samples with low copy numbers
BCR-ABL1 copies (a) | ABL1 copies (b) | RT-qPCR result (c) (%) | Response | Minimum detectable BCR-ABL1 (d) (%) | Sensitivity (e) | |
|---|---|---|---|---|---|---|
A | 3 | 300,000 | 0.001 | MR5 | 0.001 | 5.0 |
B | 4 | 160,000 | 0.002 | MR4.5 | 0.002 | 4.7 |
C | 3 | 30,000 | 0.01 | MR4 | 0.01 | 4.0 |
D | 30 | 300,000 | 0.01 | MR4 | 0.001 | 5.0 |
E | 0 | 5000 | 0.0 | MR3 | 0.06 | 3.2 |
F | 30 | 30,000 | 0.1 | MR3 | 0.01 | 4.0 |
G | 3 | 3000 | 0.1 | Inadequate | 0.1 | 3.0 |
Consensus recommendations have been published with regard to the essential characteristics of good candidates of a control gene [7, 16, 23, 25–27]. These include (i) similar level of expression between different individuals and between different cell types, including tumour versus non-tumour cells; (ii) expression levels at similar levels to the target gene (in this case, BCR–ABL1 at diagnosis); (iii) similar rate of stability and degradation as the target gene (i.e. constancy of the ratio of target to control); and (iv) lack of similar sequences (such as pseudo-genes in genomic DNA) that may be amplified with primers used in the proposed assay.
In the context of BCR–ABL1 measurement, BCR, ABL1 and GUSB (β-glucuronidase) are the most commonly used control genes. BCR has similar expression levels and stability to BCR–ABL1 [28] and was the control gene used in the molecular assays that accompanied the IRIS study – the first phase III study using imatinib in CML treatment [29]. ABL1 is the recommended control gene of the EAC and is the most commonly used of the three [30]. Laboratories may use primers that amplify exons 2 and 3 of ABL1 in qPCR reactions, which may lead to a loss of linearity at high levels of BCR–ABL1 (Fig. 7.4). This issue becomes important when one wishes to calculate the velocity of BCR–ABL1 reduction in the initial months following commencement of TKI treatment [31]. However, for most specimens, the underestimation of BCR–ABL1/ABL1 at the high end of the scale is of no clinical consequence. BCR–ABL1 transcript numbers are usually significantly lower than ABL1, especially for the important cut-off of MMR at 0.1 % IS. Similarly, GUSB transcripts have been demonstrated to have similar stability to BCR–ABL1, and it has the advantage of not being involved in the formation of the BCR–ABL1 rearrangement, and some authors would favour using this as their control gene [23].
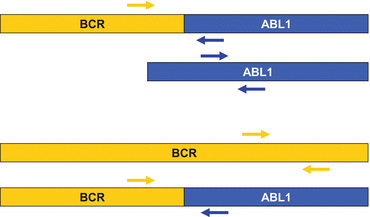

Fig. 7.4
Schematic drawing showing the location of primers for amplification of BCR–ABL1 and control genes commonly in use. The primer set used in the Europe Against Cancer project consist of a forward primer for BCR–ABL1 in exon 13 (common to both e13a2 and a14a2 transcripts) and a reverse primer in ABL1 exon 2. For the ABL1 control gene, the forward primer is situated in exon 2 and reverse primer in exon 3. (Placing the forward primer in ABL1 exon 1 is a problem, as exon 1a and exon 1b are alternately expressed.) Placing primers in this configuration, the ABL1 qPCR will prime off templates from genetic sequences of both ABL1 and BCR–ABL1, such that the target/control gene ratio is not BCR–ABL1:ABL1 but actually BCR–ABL1: (BCR–ABL1 + ABL1) leading to an underestimation when BCR–ABL1 transcript numbers are high. However, this is of no clinical significance. In contrast, primers for BCR may be placed distal to the breakpoint and in this configuration only amplify native BCR and not the BCR sequence in BCR–ABL1. Using this control gene, linearity has recently been demonstrated to be preserved over the dynamic range of the assay [43]. Drawing is not to scale
7.2.2 Standardisation Material
One important analytical variable affecting the measured transcript numbers is the determination of the standard curve, as generated for each RT-qPCR assay through accurately quantified calibration standards. The limited availability of stable biological material able to act as a reference standard to calibrate local assays has hampered both the development of international external quality assurance programmes and further enhancements of assay comparability. An ideal reference material should be available in adequate quantities to allow easy access, be stable in transport and storage, homogenous across batches, and yet replicate the characteristics of the primary test material as closely as possible under assay conditions. No material currently meet all these criteria as far as BCR–ABL1 testing is concerned. In the absence of an internationally recognised calibration standard, laboratories produce standards individually or in collaboration with others, using serially diluted plasmid mixtures of known quantity.
The WHO International Genetic Reference Panel first released a reference material in 2009, consisting of freeze-dried K562 cells positive for the e14a2 transcript diluted in BCR–ABL1 negative HL-60 cells in four different dilutions. Each is assigned a reference BCR–ABL1 IS value after repeated testing [32]. However, the small quantity of the material available is released mainly to the manufacturers of secondary reference materials. Although plasmids cannot simulate the relevant biological test material at the RT stage, it is relatively easy to produce in larger quantities, and recent interest has increased in using this in substitution for cells. The performance characteristics of a certified plasmid reference material had recently been described [20]. This plasmid, pIRMM0099, contains sequences of BCR–ABL1 e14a2, BCR, ABL1 and GUSB. Six tenfold serial dilutions on a panel called ERM-AD623a-f had been independently quantified and assigned values by digital PCR before being tested in 63 laboratories and are currently distributed by the Institute for Reference Materials and Measurements in Belgium. An alternative to plasmids involves the use of BCR–ABL1 RNA. One proprietary product developed by Asuragen is called Armored RNA Quant or ARQ. RNA is usually labile and subjected to degradation from ubiquitous RNAses present in the environment and biological materials. This may be minimised by packaging RNA molecules inside protective protein envelops. The use of stabilised RNA as a reference material allows the efficiency of the RT step to be included in the overall quality assessment. Preliminary results of a validation project have been recently published [33].
7.2.3 Results Standardisation: Reporting on the International Scale
The lack of internationally recognised suitable standard materials not only leads to difficulties for laboratories to assign values to their standards, but has also hampered direct comparability of results between different laboratories. Variations in reagents, machine platforms, control genes, primer/probe sequences and calibration standards lead to different values being reported by different laboratories for the same specimen [34]. One study demonstrated that, even when common primer/probe sets and plasmid standards were used with optimised methods, significant variation in reported BCR–ABL1 values still occurred when testing the same sample amongst 37 European laboratories [35]. Thus, longitudinal comparisons of treatment response within the same individual were not possible when results came from different laboratories. Furthermore, correlation of survival outcomes with achievement of particular molecular treatment milestones would not be possible without inter-laboratory and inter-patient comparability.
A number of efforts have been made to standardise pre-analytical and analytical variables in order to minimise assay variability. These include the use of published consensus primer and probes sets from the EAC for targets and control genes [16, 30], as well as a set of consensus recommendations intended to harmonise other aspects of BCR–ABL1 RT-qPCR methodology [23] (Fig. 7.2). One key proposal involved the development of laboratory specific conversion factors that allowed results to be adjusted and reported on a common International Scale (IS), enabling valid comparisons across individuals and laboratories [36, 37].
The initial steps of standardised RT-qPCR reporting first began with the IRIS study, the first to report molecular results following treatment with a TKI. Baseline samples from the same 30 patients were measured independently by three laboratories in London, Seattle and Adelaide, and the median value was taken to be the standardised diagnostic baseline and given a value of 100 %. Reduction in BCR–ABL1 values for subsequent results from all IRIS patients was measured as log10 reductions from this value and expressed as a ratio of BCR–ABL1: BCR [29]. Achievement of major molecular response (MMR) was designated for patients who achieved a 3-log reduction in transcript numbers from this standardised baseline and is equivalent to a BCR–ABL1 value of 0.1 %. Subsequent major international standardisation efforts involved sample exchanges between a number of central laboratories and peripheral laboratories who performed assays in parallel. Peripheral laboratories were expected to have optimised their methods and minimised assay variations prior to participation in the project, which led to the determination of a conversion factor, permitting participating laboratories to report results on the International Scale [36, 37]. Through this process, concordance between the central laboratory and a participating laboratory on whether a sample has BCR–ABL1 ≤ 0.1 % (MMR) reached 91 % at best, although only about half of the participating laboratories were deemed to meet the desirable performance characteristics [36]. Inherent variability of the assay or suboptimal method development was responsible for discordance in the remaining laboratories.
Currently, conversion factors only enable e13a2 and e14a2 results to be adjusted for reporting on the IS, and a mechanism to report atypical transcripts such as e1a2 and e19a2 using a similar scale does not yet exist.
7.2.4 Clinical Aspects: Indications and Interpretation of Results
RT-qPCR testing is currently recommended for all patients at diagnosis. The type of transcript expressed should be documented at diagnosis using an assay that can identify atypical transcripts in cases that do not express the more common e13a2 and e14a2. Thereafter, RT-qPCR should be performed every 3 months until MMR is achieved. Loss of MMR or CCyR is rare for patients with BCR–ABL1 ≤ 0.1 % [2], and RT-qPCR monitoring every 3–6 months for these patients is adequate [3]. Management decisions based on molecular monitoring should be made only when the inherent variability of an optimised RT-qPCR assay had been considered. The technical variability is potentially equivalent to a 2-fold variation of the reported result for a sample with 0.1 % BCR–ABL1. At the higher level of 10 % BCR–ABL1, the CV is slightly lower (~18 %), and at 0.0032 % the variation approaches ~5-fold (both unpublished observations within our laboratory). Although these CVs may be wide when compared to more commonly used diagnostic assays such as haemoglobin or serum sodium, this degree of variability is expected given the dynamic range of the assay and the clinical context (i.e. a very small change in the expression of BCR–ABL1 does not have the same physiological significance as an out of range serum sodium). Changes in a patient’s BCR–ABL1 value should be interpreted within this context to determine whether a change is within the measurement reliability of the assay or a true biological change [7]. A repeat assay should be performed when the significance of a BCR–ABL1 increase is unclear.
Several groups have explored the optimal cut-off in the BCR–ABL1 increase most likely to predict for an adverse outcome, though a consensus value had not been reached. The different conclusions are related to differences in the performance characteristics of individual laboratory molecular assays, and although a common value cannot be agreed upon, clinically relevant rises in BCR–ABL1 in many instances have been demonstrated to approximate the precision limit of the assay in the investigating laboratory. Furthermore, loss of MMR in the context of a rising BCR–ABL1 level increases the clinical significance of the rise [38]. For instance, Press et al. demonstrated that in their cohort of 90 patients, a rise in the BCR–ABL1/G6PDH ratio of >0.5 log10(~3.2-fold) was associated with a loss of CCyR. Using a lower cut-off in the BCR–ABL1 rise led to a higher false-positive rate, as the contemporaneous variability in RT-qPCR in their laboratory due to technical variations was 0.46 log [39]. The same group subsequently concluded that a 2.6-fold increase in BCR–ABL1 was the optimal cut-off for predicting the development of a concomitant kinase domain mutation and reported that a 2.6-fold change was the analytical precision limit for that particular analysis. In contrast, the Hammersmith group found that a rise of BCR–ABL1/ABL1 was predictive of loss of CCyR and progression to advanced phase, providing that the resultant BCR–ABL1 was >0.05 % [40]. We would regard a rise in the BCR–ABL1 of >2-fold in our laboratory as significant and in line with current recommendations would proceed to mutation analysis if this results in a loss of MMR [38]. Other aspects that can lead to therapeutic failure should also be addressed, such as compliance or concomitant drug interactions (see mutation analysis below). Patients with a >2-fold rise, but not associated with loss of MMR, should be monitored more closely.
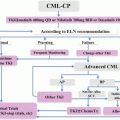
Patients who fail to achieve time-dependent molecular targets are at higher risk of disease transformation and death. According to the current recommendations of two most widely used CML treatment guidelines, both the ELN and the NCCN would regard the failure to achieve BCR–ABL1 ≤ 10 %, ≤1 % and ≤0.1 % at 3, 6 and 12 months, respectively, after a CML-CP patient commences treatment with a TKI to be associated with inferior outcomes [3, 41] (Fig. 7.5). The evidence with regard to the 3-month time point is particularly strong, and patients with BCR–ABL1 > 10 % at this time point have inferior overall and progression-free survival as well as inferior achievement of molecular responses, regardless of the TKI chosen for treatment [42]. The level of uncertainty with regards to BCR–ABL1 measurement is of particular importance when an individual patient’s molecular result is measured against recommended milestone responses. In particular, even though the guidelines are specific as to the cut-offs that segregate high-risk patients from good-risk patients, in reality the association between the BCR–ABL1 ratio and the degree of risk exists as a continuum. For instance, a patient with BCR–ABL1 of 1 % 3 months after starting TKI therapy clearly has a lower risk of disease progression compared to a patient with a result of 10.5 % at 3 months. However, it is unclear if a patient with 9.5 % has a clearly different level of risk to a patient with 10.5 %, yet the response level and risk are assessed as different using an absolute cut-off. Taking into account the underlying inherent assay variability, a reported BCR–ABL1 of 9.5 % may actually reflect a true value that ranges between 6 and 12 % (given a CV of 18 %). Consequently, many would urge caution when making clinical decisions based on one single BCR–ABL1 result, and a patient’s history should be considered when management decisions are made. Furthermore, the ELN cautioned that a single measurement at 3 months is insufficient for decisions regarding a change of treatment. The ELN recommends repeat testing at up to monthly for patients with BCR–ABL1 > 10 % at 3 months and changing treatment for patients who are still >10 % at 6 months [3].
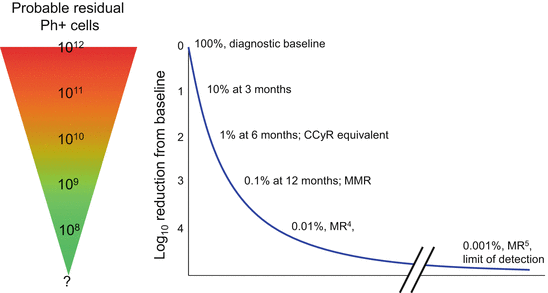

Fig. 7.5
Idealised trajectory of time-dependent molecular responses and corresponding residual leukaemic burden. At diagnosis, a patient may harbour as many as 1012 leukaemic cells. The median RT-qPCR value of BCR–ABL1 at diagnosis is set at 100 % using 30 patients who participated in the IRIS study. After 3 months of treatment, the RT-qPCR should have fallen by 10-fold (1-log reduction from the standardised baseline) to 10 % on the International Scale (IS). At 6 months, most patients achieve a BCR–ABL1 ≤ 1 % IS, a convenient surrogate marker for complete cytogenetic response (CCyR). CCyR is associated with long-term progression-free survival. By 12 months, the majority of patients achieve a 3-log reduction in BCR–ABL1, equivalent to 0.1 % IS, also called major molecular response (MMR) or MR3. Patients who achieve MMR are unlikely to lose this response, provided that they are compliant with therapy. Deeper molecular responses are termed MR4, MR4.5 and MR5, equivalent to 0.01 %, 0.0032 % and 0.001 % IS, respectively. A 5-log reduction is the limit of detection for most BCR–ABL1 RT-qPCR assays. Patients with disease at this level may still harbour up to 107 Ph + cells
The speed at which a patient achieves milestone responses had been demonstrated to add valuable prognostic information. This is encapsulated in the concept of the “BCR–ABL1 halving time” which the Adelaide group has used to further refine prognosis in patients with BCR–ABL1 > 10 % at 3 months. This takes into account both the magnitude of the fall in BCR–ABL1 transcript numbers and duration over which this occurred. The initial fall in BCR–ABL1 transcripts after TKI commencement is linear when BCR is used as the control gene, and a slope can be calculated using these two parameters. From their cohort of 500+ imatinib-treated patients, the number of days necessary for the BCR–ABL1 to reduce by 50 % can be calculated providing both results at baseline and 3 months are available. Patients with BCR–ABL1 > 10 % at 3 months and a halving time of >76 days are at particularly high risk of treatment failure [43]. The German CML study group arrived at the same conclusion that the velocity of BCR–ABL1 transcript elimination in the early months of treatment is correlated with treatment outcomes and concluded that failure to achieve a half-log decrease in transcript numbers is associated with inferior progression-free and overall survival [31].
The ELN and NCCN guidelines also set down time-dependent cytogenetic responses which correlate with clinical outcomes. If cytogenetic results are unavailable (either for technical or clinical reasons), molecular responses can be used as a surrogate. A BCR–ABL1 ratio of <10 % is generally considered to be equivalent to major cytogenetic response (Ph + metaphases 1–35 %; MCyR), whereas patients with BCR–ABL1 < 1 % have almost certainly achieved complete cytogenetic response (0 % Ph + metaphases; CCyR) [7, 44–46].
Given the stated CVs and measurement uncertainty with molecular assays, some have argued that cytogenetics should be the preferred method for monitoring treatment response in CML, especially because of the perceived greater certainty of cytogenetic responses. This is an erroneous assumption, however, as cytogenetics has actually been demonstrated to be associated with an even greater level of measurement uncertainty, especially with regard to cut-offs important for clinical decision making [47]. Given this context, molecular and cytogenetic data should be used in combination, especially when the limited dynamic range of cytogenetic analysis is considered.
7.3 Emergent Methods of Molecular Monitoring
7.3.1 Digital PCR
Conventional qPCR techniques allow for robust, sensitive and specific quantification of BCR–ABL1 RNA transcripts in a diagnostic setting. Further refinements, made possible with improvements in biomaterial engineering and microfluidics, have led to the development of digital quantitative PCR (dqPCR) techniques. In conventional qPCR, amplicons of interest increase exponentially with each cycle of PCR. Each of the amplicons in a reaction contributes to a unit of fluorescence from a corresponding hydrolysed probe. The fluorescence detected is a combined output from the entire reaction and increases exponentially with each PCR cycle until it reaches a plateau. The resultant signal output is analogue in nature.
Stay updated, free articles. Join our Telegram channel

Full access? Get Clinical Tree


