Fig. 11.1
Left optic nerve glioma (a) enhancing on contrast-enhanced T1-weighted magnetic resonance sequence and (b) hyperintense on a contrast-enhanced T2-weighted magnetic resonance sequence
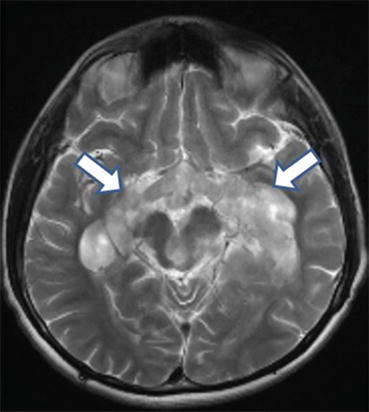
Fig. 11.2
Bulky extension of a chiasmatic optic pathway glioma posteriorly along the left and right optic tracts
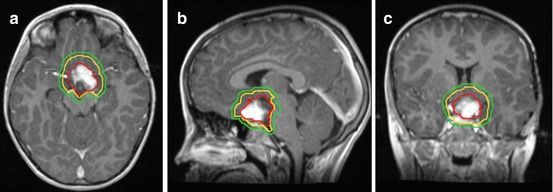
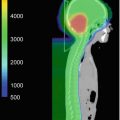
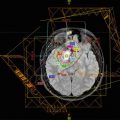
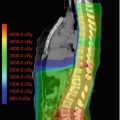
Fig. 11.3
Chiasmatic optic pathway glioma outlined for radiation treatment delivery on (a) axial (b) sagittal and (c) coronal views. The gross tumor volume is in red, the clinical target volume is in yellow (5 mm edited from the brainstem), and the planning target volume is in green (3 mm)
Kornreich et al. found that tumors in NF-1 patients arise most commonly in the optic nerve and chiasm (66% and 62%, respectively), compared to 91% arising in the chiasm in non-NF-1 patients (Lopez Ibor 1975). Of the non-NF-1 patients, 68% have visible radiographic extension beyond the optic pathway, which is significantly less frequent in the NF-1 group at 2% (Kornreich et al. 2001).
In 1958, Dodge et al. published a classification system for OPGs (Dodge et al. 1958). Type I involves a single optic nerve, type II involves the optic chiasm and unilateral or bilateral optic nerves, and type III involves the hypothalamus or adjacent structures (Cappelli et al. 1998). A modified Dodge classification was published in 2008 and includes NF status among other factors (Dotson et al. 1991).
11.5 Workup
MRI of the brain with and without contrast is important to define tumor origin, extent, and imaging characteristics that may differentiate OPGs from other primary CNS tumors. Due to the small gauge of the pediatric optic nerves, a high-resolution MRI at 1- to 2-mm slice thickness may be necessary to capture the full extent of tracking along the optic pathway. Although the risk of CNS dissemination is rare (Perilongo et al. 2003) a complete spinal MRI is recommended for thorough staging (McCowage et al. 1996).
Today, a biopsy is often obtained to confirm the diagnosis of OPG, unless it is associated with NF-1 (Walker et al. 2013). However, if a biopsy could result in a high risk of morbidity, the diagnosis can be made based on the characteristic tumor location and imaging appearance. On pathologic analysis, tumors are most commonly low grade (Dutton 1994). The majority are pilocytic astrocytomas, a World Health Organization grade 1 tumor (Jahraus and Tarbell 2006).
All patients should undergo complete ophthalmologic evaluation. Neuroendocrine laboratory tests can be obtained to assess baseline levels of thyroid hormone, growth hormone, cortisol, and estrogen or testosterone, as these can be affected by the tumor at diagnosis or by treatment (Fouladi et al. 2003). Like endocrine function, neurocognitive function can be affected by the tumor itself, hydrocephalus, or prior therapy (Sutton et al. 1995; Fouladi et al. 2003; Carpentieri et al. 2003). Baseline neurocognitive function testing by a neuropsychologist can be performed for children old enough to participate (typically >3 years old). Newly diagnosed patients should be screened for NF-1.
11.6 Acute Management
For cases of rapid deterioration in vision, urgent treatment is needed to prevent blindness. Once the visual deficit has developed, it is often irreversible (Awdeh et al. 2012). Steroids can be used to decrease edema and are usually prescribed as a temporizing measure before definitive therapy, but their efficacy in restoring vision is unclear (Awdeh et al. 2012).
For tumors resulting in compression of the third ventricle, often accompanied by symptoms, hydrocephalus can be rapidly relieved by shunt placement (Goodden et al. 2014).
11.7 Treatment
The treatment approach for OPGs must be individualized based on the tumor size, tumor extent, and patient age. Treatment may include surgery, chemotherapy, radiation therapy, or a combination of these. In some cases, surveillance may be appropriate, especially for asymptomatic tumors in NF-1 patients (Shamji and Benoit 2007; Goodden et al. 2014; Jenkin et al. 1993).
Historically, surgery was the initial treatment of OPGs. Curative radical surgery may still have a role when tumors are located anteriorly and confined to one optic nerve, particularly when no useful vision remains in that eye, or when tumors are exophytic from the optic chiasm (Jenkin et al. 1993; Wisoff et al. 1990; Tenny et al. 1982). Surgery for posterior lesions with diffuse involvement of the optic chiasm or hypothalamus is less commonly performed due to the morbidity of bilateral loss of vision, vascular damage, and endocrinopathy (Sutton et al. 1995). The 2011 consensus conference for pediatric neurosurgery does not recommend primary surgical management of low-grade hypothalamic/chiasmatic tumors except for select cases (Walker et al. 2013). The value of a subtotal resection is debatable, with some studies showing benefits (Goodden et al. 2014) while others do not (Silva et al. 2000; Jenkin et al. 1993). Beneficial debulking operations are those that offer immediate decompression, which can maximize the chance of vision preservation, release extreme proptosis, or relieve obstructive hydrocephalus (Tenny et al. 1982; Medlock and Scott 1997).
Chemotherapy can be used to delay tumor progression in order to allow childhood growth and development. The landmark Children’s Cancer Group (CCG) study A9952 enrolled children under 10 years old with low-grade astrocytomas of all sites from 1997 to 2005. Five-year event-free survival for all patients was 45%, with a non-statistically significant improvement in the 6-thioguanine, procarbazine, lomustine, and vincristine (TPCV) arm compared to the carboplatin and vincristine (CV) arm at 52% versus 39%, respectively (p = 0.10) (Ater et al. 2012). A retrospective review of adolescents with OPGs showed 12 of 15 patients had stable disease at a mean follow-up of 52.9 months (Chong et al. 2013). Other modern chemotherapy options include vinblastine (Bouffet et al. 2012), carboplatin monotherapy (Aquino et al. 1999), and vincristine with etoposide (Pons et al. 1992).A lack of consensus exists for the age at which chemotherapy should be used to delay radiation and therefore varies by institution, frequently ranging between less than age 6 years to less than age 10 years (Merchant et al. 2009). In the USA, for example, protocols such as ANCS 0221 investigating radiotherapy for pediatric low-grade gliomas (any site of origin) required patients less than 10 years of age to have received one or more courses of chemotherapy prior to enrollment. For European multi-institutional protocols for pediatric low-grade gliomas, such as HIT-LGG-1996, chemotherapy was recommended over radiotherapy for children less than 5 years of age (Gnekow et al. 2012).
The role of radiation therapy in definitive treatment of OPG was described in 1956 (Taveras et al. 1956) and served as an impetus to consideration of radiation therapy as primary therapy in OPGs. Radiation therapy is more commonly recommended for older children and when surgery would threaten visual or endocrine function. Radiation is utilized relatively less in NF-1 patients due to concern for radiation-induced secondary tumors and increased risk of vasculopathy (Listernick et al. 2007; Grill et al. 1999).
11.8 Target Delineation
Accurate target and organ-at-risk (OAR) delineation are critical steps in effective and safe radiotherapy delivery. The gross tumor volume (GTV) is defined as the gross residual disease. Fusion of a contrast-enhanced high-resolution MRI is recommended to improve accuracy of the target and OAR contours. If radiation is being delivered for tumor progression after surgery, chemotherapy, or both, the previous MRIs throughout the time course of the tumor should also be fused and the extent of disease reviewed. The clinical target volume (CTV) encompasses the GTV and the adjacent area at risk for microscopic spread of disease. This margin should extend 5–10 mm beyond the GTV to encompass regions at risk for tumor infiltration, such as the proximal and distal optic nerves and the prechemotherapy tumor extent. The CTV margin should be expanded further as necessary to encompass the tumor bed and any surfaces in contact with the tumor prior to surgery and/or chemotherapy. The CTV is edited from anatomical boundaries, such as bone and tentorium. A planning target volume (PTV) is then added to account for set-up uncertainty, typically 3–5 mm if daily image guidance is used (Fig. 11.2).
These tumors develop among numerous critical intracranial structures, including the uninvolved optic apparatus, hypothalamus, pituitary, cochlea, brainstem, lacrimal gland, retina, lens, and temporal and frontal lobes. All structures should be identified and used to optimize planning.
The standard prescription dose is 50.4–54 Gy at 1.8 Gy per fraction. Improved overall survival (OS) and progression-free survival (PFS) are associated with doses over 43.2 Gy (Flickinger et al. 1988), but the dose effect beyond 50 Gy is unclear (Jenkin et al. 1993).
Fractionated external-beam radiotherapy with photons or protons is the most common treatment technique and radiation may be delivered through three-dimensional (3D) conformal or intensity-modulated techniques. Intensity modulation offers a dosimetric advantage compared to 3D conformal therapy by increasing the conformality of the high-dose region. However, multifield intensity-modulation techniques typically expose more intracranial tissue to a low radiation dose. Early reports of proton therapy using 3D conformal techniques are encouraging (Indelicato et al. 2012), but longer follow-up is needed to clarify the magnitude of clinical benefit. Radiosurgery or other means of hypofractionation are not typically recommended based on the heightened sensitivity to large dose-per-fraction regimens observed in late-responding tissue of the pediatric brain, brainstem, and optic nerves.
11.9 Outcomes
Following surgery, chemotherapy, or radiotherapy, an MRI of the brain is obtained typically every 3 months for this first 2–3 years, then every 6 months through year 5, and then annually. Due to its low grade and thus low-proliferation rate, radiographic regression following radiotherapy is slow. Tao et al. found a median time of 31.7 months to reach a ≥25% radiographic response rate and 62 months to achieve ≥50% tumor reduction rate (Tao et al. 1997). The radiographic response continued for years after the completion of radiotherapy. For four patients, a complete response by imaging occurred more than 10 years later. In 19 patients receiving vincristine and carboplatin, 58% experienced radiographic progression, 21% stability, and 21% regression (Shofty et al. 2011). The extent of tumor response does not seem to correlate with improvement in vision (Cappelli et al. 1998; Shofty et al. 2011; Kalin-Hajdu et al. 2014).
Treatment-related toxicity surveillance includes routine ophthalmologic evaluation, including visual acuity and visual field testing. Given the age and potential of each treatment modality as well as the tumor itself to contribute to cognitive dysfunction (Carpentieri et al. 2003), neurocognitive testing under the direction of a neuropsychologist is recommended on a regular basis. Magnetic resonance angiogram should be considered due to the risk of vasculopathy caused by the tumor, surgery, and radiotherapy (Kestle et al. 1993).
Outcomes after surgery vary based on tumor extent. Jenkin et al. reported a 10-year relapse-free survival rate ranging from 58–81% (Jenkin et al. 1993). The highest control rates occurred when the tumor was confined to one optic nerve, with a 20-year OS rate of 90%. In contrast, the OS rate decreased to 58% for posterior tumors (Jenkin et al. 1993). Outcomes following chemotherapy are more modest: Janss et al. reported on 46 pediatric patients with OPG ≤5 years old (Janss et al. 1995). With a median follow-up of 72 months, the OS rate was 93%. For initial management, 32 of the 46 patients underwent chemotherapy, with only 28% achieving sustained disease control. Chemotherapy did, however, defer other treatment until after age 5 years in over 70%. For tumors that extend beyond a single optic nerve, radiation offers the most durable disease control. In a study from the prechemotherapy era, in which 78% of the cohort received radiotherapy at diagnosis or after progression, Cappelli et al. reported an OS rate of 83% and a PFS rate of 65% at 10 years (Cappelli et al. 1998). Vision stabilized or improved in nearly 70%. In 29 patients with chiasmatic gliomas treated with salvage radiotherapy, the 10- and 15-year freedom from progression rates were 89% and 82% and the OS rates were 100% and 85%, respectively (Tao et al. 1997). Of these 29 patients, 4 had disease progression 1–60 months after radiotherapy, and all were salvaged with chemotherapy. In a study of 36 patients, radiotherapy increased the local control rate to 86%, compared to 45% without radiotherapy (Wong et al. 1987). The 10-year OS, PFS, and cause-specific survival rates were 79, 77, and 88% in 33 patients primarily treated with definitive radiotherapy with a mean follow-up of 13.6 years (Erkal et al. 1997). Tenny et al. reported lower mortality rates in patients who received radiotherapy compared to those who did not: 36% versus 80% (Tenny et al. 1982).
In a study of 73 patients with OPGs (Fouladi et al. 2003), 50% underwent observation after diagnosis and 50% underwent active treatment: 15 with radiotherapy, 20 with chemotherapy, and 1 with chemotherapy then radiotherapy. The median age of the irradiated patients was 7.2 years compared to 2 years for the chemotherapy patients and 4 years for the observed patients. Ninety percent of the chemotherapy administered was cisplatin or carboplatin based. The 6-year PFS rate was 69% with radiotherapy compared to 12% with chemotherapy and 37% with observation. There was no difference in OS between the three cohorts. Chemotherapy delayed the need for additional treatment for a median of 2 years, but children were subjected to dual-modality therapy and the risk of vision loss upon tumor progression. With all outcome series, careful attention must be paid to the length of follow-up for treatment-related deaths, regardless of treatment modality since disease progression can occur more than 20 years after therapy for this low-grade tumor (Alvord and Lofton 1988).
OPGs in children with NF-1 typically take a more indolent course compared to sporadic OPGs. Janss et al. report a significant difference in PFS, with rates higher in children with NF-1 (Janss et al. 1995). Other studies report no difference in OS or PFS between these two groups (Tao et al. 1997).
Select studies on outcomes after treatment of OPGs are summarized in Table 11.1.
Table 11.1
Literature review of outcomes studies on the treatment of optic pathway gliomas
Study and years | No. of Pts | Pts with NF-1 (%) | Initial treatment (No. or % of Pts) | Follow-up | Overall survival | PFS | Endocrine | Vision | Neurocognitive | Cerebrovascular | Second malignancy |
|---|---|---|---|---|---|---|---|---|---|---|---|
Jenkin et al. (1993) 1958–1990 | 87 | 44 | Observation, 23; surgery, 26; RT, 28; surgery + RT, 10 | Median, 11.5 years | 84% at 10 years | 10 years 68% | Not reported | With RT, 13% improved, 70% stabilized, 17% worsened | Not reported | Not reported | 5/48 irradiated, 4 central nervous system tumors, 1 lymphoma; 0/49 nonirradiated |
Tao et al. (1997) 1971–1993 | 29 | 41 | All received RT for progressive disease, with or without prior surgery or chemo | Median, 9 years | 85% at 15 years | 15 years 82% | 72% with new endocrinopathy after RT | 24% improved, 48% stabilized, 17% worsened | n = 20 required special education (n = 11 required this prior to RT) | 3% | 1 glioblastoma |
Erkal et al. (1997) 1973–1994 | 33 | 18 | STR, 22; biopsy, 7; All received RT | Mean, 13.6 years | 79% at 10 years | 10 years 77% | 39% with abnormalities | 36% improved, 52% stabilized, 12% worsened | not reported | 0% | Not reported |
Sutton et al. (1995) 1976–1991 | 33 | 12 | Biopsy/STR then RT, 9; and/or chemo, 18 | Mean, 10.9 years | 5 deaths overall | 3 deaths from tumor progression | 57% on replacement medication | 82% with functional vision | Required special education, 12 | Not reported | Not reported |
Janss et al. (1995) 1977–1990 | 46 | 33 | Chemo, 32; surgery, 3; RT, 5 | Median, 6 years | 93% at 5 years | 5 years 19% | 59% | Four became blind | 10 of 17 required special education | Not reported | Not reported |
Cappelli et al. (1998) 1980–1992 | 69 | 58
Related posts:Stay updated, free articles. Join our Telegram channel
Full access? Get Clinical Tree
 Get Clinical Tree app for offline access

|