Ultrasound
CT
MRI
Advantages
Low cost
Low cost
No radiation
Availability
Availability
High contrast resolution
Useful for screening and surveillance
Quick
Liver-specific agents
High spatial resolution
Functional MRI
Highest accuracy for detection and characterization
Can detect small amount of fat
Disadvantages
Operator-dependent
Radiation
Expensive
Low sensitivity for detection
Limited characterization of small lesions
Limited availability
Longer exam
Limited characterization
Not sensitive to intravoxel fat
Lower spatial resolution
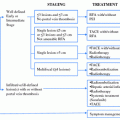
Major advantages of MRI over CT include lack of ionizing radiation, higher contrast resolution, better ability to detect, characterize and quantify both intrahepatic and intralesional fat and iron, the ability to characterize smaller lesions (<2 cm), evaluation of post treatment changes (post chemoembolization and radiofrequency ablation), the use of diffusion weighted imaging and extracellular or liver-specific contrast agents. These benefits, of course, must be balanced with the limitations of MRI, including high cost, limited availability, lower spatial resolution, and increased imaging time.
4.3 Ultrasound
Gray scale and Doppler sonographic evaluation has traditionally been performed for screening and surveillance. Given the importance of neovascularity as a landmark for HCC, Doppler ultrasound techniques have been utilized in attempts to evaluate tumor vascularity in HCC. A large HCC is usually displayed as a vascular rich lesion containing intratumoral flow signals with an arterial Doppler spectrum. The typical appearance is often described as a basket pattern, with a fine blood flow network surrounding the nodule and tumor vessels flowing into and branching within it [16, 17] (Fig. 1). Doppler interrogation often shows a pulsatile waveform with high-frequency shifts and an elevated resistive index (>0.71) [16, 18]. This, however, is limited in the evaluation of small tumors (<2 cm) where sensitivity has been reported to be as low as less than 50 % [19]. Additionally, the technique is cumbersome and its positive predictive value is not high [20].


Fig. 1
Gray scale (a), color (b), and power (c) Doppler ultrasonography images in a patient with cirrhosis and HCC. There is a left hepatic lobe HCC which is heterogeneously hypoechoic (arrows) with increased vascularity on both color and power Doppler ultrasound
Contrast-enhanced ultrasound (CEUS) involves the use of microbubble contrast agents and specialized imaging techniques to show sensitive blood flow and tissue perfusion information. While CEUS is a safe and easily performed technique with no ionizing radiation and no risk of nephrotoxicity, it is still not widely available in the United States and is highly operator-dependent [21]. It shows tissue perfusion similar to that shown on contrast-enhanced CT and MRI in which patterns of enhancement in the arterial and portal venous phases predict diagnoses of focal liver lesions [21]. The actual performance of CEUS requires contrast-specific software on the ultrasound equipment that suppresses the signal from the background tissue leaving only the signal from the microbubbles. Reflective of many published studies reporting the success of CEUS for this indication, Ding et al. [22], in a study of 147 tumors using established diagnostic criteria, reported a high sensitivity of 96.3 and 97.5 % specificity for the diagnosis of hemangioma and 92 % sensitivity and 86.7 % specificity for diagnosing HCC. Therefore, CEUS could rapidly characterize incidentally detected masses found on conventional US or other techniques. Washout of contrast agent in the portal venous phase of liver mass evaluation with CEUS has been shown to have a high association with malignant histology. The impact of the introduction of CEUS on an US practice is addressed in two retrospective reviews of more than 1,000 patients each in which CEUS was performed for liver mass characterization using two different second-generation contrast agents [23, 24]. In both studies, the accuracy of CEUS in patients with pathology confirmation was identical at 89 %.
4.4 CT
4.4.1 Technique: Multidetector CT
MDCT uses 4, 16, 64, or more contiguous detectors to increase effective pitch by 4- to 64-fold, without consequent loss of spatial resolution along the axis of scanning. These scanners allow thin sections in a single breath-hold, with greatly improved speed and longitudinal resolution, which results in nearly isotropic image acquisition and subsequent high-resolution multiplanar reformations. In addition, MDCT technology allows faster scanning of the liver in less than 10 s (compared to approximately 20 s for single-detector helical CT) with the possibility of acquiring two separate arterial phase images within the time accepted as the hepatic arterial dominant phase in single-detector helical CT. The early arterial phase could be used to define the vascular supply of the tumor and the liver.
Although MDCT has been available for several years, there is limited data about the impact of MDCT on the appearance and attenuation characteristics of HCCs [25–27]. For example, Lee et al. [26] showed similar appearances of HCCs with images obtained using 4-MDCT scanner to those described for images obtained using single-detector helical scanners, with however, a higher prevalence of hypervascular lesions on MDCT images than previously described, with most lesions showing washout on portal venous images with MDCT. In theory, double arterial phase imaging with MDCT should improve HCC detection. However, two prior studies [28, 29] did not show improved HCC detection using MDCT compared to a conventional single arterial acquisition. Murakami et al. [30] used a triple arterial phase acquisition (at 20, 30, and 40 s. after administration of intravenous contrast) with MDCT for HCC detection, and showed that the middle arterial phase showed the best sensitivity compared with the early and late arterial phases for HCC detection [mean area under the curve: 0.84 vs. 0.56 (early) and 0.62 (late arterial phase)].
In our institution, we perform first pre-contrast CT images in order to characterize relative enhancement, evaluate for fat, hemorrhage, and post treatment (post chemoembolization) changes. Subsequently, we perform a single arterial phase based on the bolus tracking method (for an accurate peak arterial enhancement). Following this, a portal venous dominant phase of contrast enhancement is performed at 60 s. when the bulk of injected contrast has reached the liver via the portal vein. We do not routinely perform a late venous phase (at 180 s.) as used by some authors [31], due to the increased risk of radiation exposure.
Recent technology using dual energy MDCT showed potential for obtaining virtual noncontrast images, thus eliminating the need to acquire the pre-contrast data, decreasing the radiation exposure [32, 33].
These different phases of post-contrast enhancement are necessary to recognize typical enhancement characteristics of HCC, as described below. In addition, CT images determine the hepatic vascular supply, and assess for any macrovascular invasion.
4.4.2 CT Features of HCC
CT characteristics of HCC have been classically described in the literature [34–42]. HCC is most commonly described as focal, however alternatively may be multifocal, or diffuse/infiltrative. Classic features of focal HCC include a hypervascular lesion on hepatic arterial phase imaging that washes out on portal venous images (Fig. 2). Other typical features of focal HCC include the presence of a fibrous, delayed enhancing capsule, internal fat, and a mosaic pattern of appearance, heralded by internal and peripheral regions of necrosis, fat, hemorrhage, copper deposition, and fibrous septations. Secondary signs for which careful evaluation should be performed include macrovascular invasion involving the portal and/or the hepatic venous systems (Fig. 3). Macrovascular invasion in HCC occurs in as many as 6.5–48 % of cases and is more common with higher grade tumors [35, 43]. Arterial enhancement of thrombus can be evaluated to differentiate tumor from bland thrombus [43]. Evaluation for satellite lesions, present secondary to local portal venous metastases that seed the adjacent hepatic parenchyma, should also be performed to guide management/surgical approaches [44].
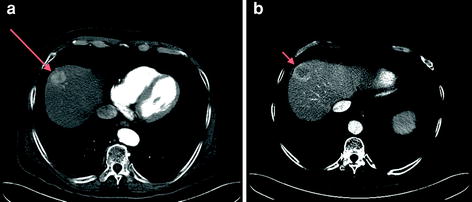
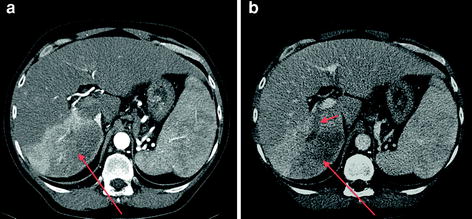

Fig. 2
64-MDCT (multidetector CT) demonstrating an arterially enhancing HCC in the hepatic dome (long arrow a) with central washout on portal venous phase image (arrow on b)

Fig. 3
64-MDCT (multidetector CT) with arterial (a) and venous (b) phases demonstrating an infiltrative HCC of the right hepatic lobe, with heterogeneous enhancement (long arrows a, b) and tumor thrombus occluding the right posterior portal vein (short arrow b)
Regenerative nodules and dysplastic nodules are not as conspicuous on CT compared to MRI, and are generally diagnosed in the presence of small hypovascular nodules.
The diffuse, infiltrative subtype is much less common, constituting approximately 13 % of HCCs [45]. Classic signs include a markedly elevated AFP level, “patchy” enhancement on arterial phases secondary to internal tumor micronodules, heterogeneous portal venous enhancement, and tumor thrombus. Due to background cirrhotic morphology, they may blend with background parenchyma and could be difficult to detect on CT.
4.5 MRI
4.5.1 Technique
MRI provides excellent contrast resolution, with multiplanar evaluation for detection and characterization of liver nodules in cirrhosis, without the use of ionizing radiation. Advances in MRI software and hardware, including the use of parallel imaging and surface phased-array coils provide faster sequences that can be acquired within a breath-hold, decreasing motion, and respiratory artifacts. State of the art protocols using 1.5 or 3 T systems include breath-hold only sequences for routine liver MRI examination (whole acquisition time less than 30 min), with the following sequences: axial T1- in-phase and out-of-phase gradient-recalled echo (to evaluate for microscopic fat and iron contents), axial T2 fast spin echo with fat saturation (for lesion detection and characterization), axial and coronal T2 single-shot RARE (used for detection of cysts, hemangiomas and for assessment of biliary system/gallbladder), and axial 3D T1-weighted fat suppressed gradient-recalled echo before and after dynamic injection of extracellular gadolinium contrast agents or liver-specific agents (the most important sequence for HCC detection). An MR-compatible automatic injector is used, with acquisitions at the arterial (using either a test bolus of contrast or bolus tracking method for accurate timing of the hepatic arterial phase examination) [46], portal venous (at 1 min), late venous or equilibrium (at 3 min), and hepatocyte phase for liver-specific agents (20 min for Gd-EOB-DTPA and 1–2 h for Gd-BOPTA) [47, 48].
Recently, diffusion-weighted imaging (DWI) has proven helpful both in detection and characterization of liver lesions [49]. DWI uses gradients to suppress signal from free water motion. DWI is used to differentiate cysts and hemangiomas with relative free water diffusion from solid tumors such as HCC and metastases. DWI with calculation of the apparent diffusion coefficient (ADC) may also serve as an early marker of tumor response to therapy [49, 50]. High field imaging at 3T is increasingly performed due to increased availability. Advantages of imaging at 3T include higher signal to noise ratio, better image contrast, particularly with gadolinium-enhanced applications which translate to higher spatial resolution and faster imaging [51–53]. 3T systems could potentially improve HCC detection, particularly of lesions less than 1 cm, the detection of which can lead to curative treatment with a nonsurgical method, such as radiofrequency ablation [54].
4.5.2 MRI Features of HCC
Non Contrast MRI Features of HCC
HCC lesions have a variable appearance on T1-weighted images. Lesions can be hypo, iso-, or hyper-intense compared to surrounding liver parenchyma [55–57]. Many well-differentiated HCCs and high grade DNs can have high signal intensity on T1-weighted images which can be related to copper, iron, glycogen deposition, high protein/lipid content, and possibly the degree of differentiation [58, 59]. T1-weighted in-phase and opposed-phase gradient echo sequences provide the opportunity to detect signal drop on opposed phase images, representing microscopic fat components that may be present in HCC lesions [60] (Fig. 4). On T2-weighted images, HCCs are classically hyperintense (Fig. 5). There is, however a great deal of variability as DNs are typically T2 hypointense and well-differentiated HCCs can be iso- or rarely even T2 hypointense compared to liver parenchyma [58, 59]. A focus of high T2 signal intensity within a hypo- or isointense nodule (“nodule within a nodule” sign) has been described as suggestive of HCC developing within a DN [61]. In the end, however, given the variability present, studies have shown a limited utility of T2-weighted imaging for HCC detection/characterization [62, 63].


Fig. 4
Contrast-enhanced CT in a patient with hepatitis C related cirrhosis shows an indeterminate hypovascular lesion (a, arrow). MRI performed for further characterization shows signal drop in the lesion from in-phase (b) to opposed-phase (c) images (arrow), compatible with fat containing HCC

Fig. 5
Contrast-enhanced MRI demonstrating two HCCs which are hyperintense on T2-weighted imaging (arrows a), with arterial phase enhancement (arrows b) and washout on portal venous phase images (arrows c)
Using DWI, benign lesions (cysts and hemangiomas) show generally higher ADCs than HCC, secondary to free water motion in benign lesions and restricted water motion in tumors. A mass in the cirrhotic liver with restricted diffusion (remaining hyperintense on high b-value diffusion images with low ADC) is highly suggestive of HCC when associated with other typical MRI features [64–66] (Fig. 6).


Fig. 6
Diffusion-weighted MRI demonstrates a right hepatic lobe HCC (arrows) which is hyperintense on diffusion images at b = 0 (a) and b = 50 (b), thus easy to detect. Arterial phase post-contrast image (c) confirms the presence of a hypervascular lesion
Contrast-Enhanced MRI
Most HCCs obtain their blood supply almost exclusively from the hepatic artery and 80–90 % of HCCs are thus hypervascular during the arterial dominant phase [67, 68]. This feature allows differentiation from regenerative nodules as well as from focal fibrosis, which generally demonstrate delayed enhancement.
On portal venous and late venous phases, arterial phase enhancing HCCs become typically hypo-intense relative to background liver parenchyma (“wash-in and wash-out pattern”). When arterially enhancing lesions larger than 2 cm are present with delayed washout, HCC is confirmed without the necessity of further evaluation [69, 70] (Figs. 2, 4, 5). In addition, delayed post-contrast T1-weighted imaging sequences can show late enhancement of a fibrous capsule/pseudocapsule which is a typical feature of HCCs larger than 2 cm, but not regenerative or dysplastic nodules. Approximately 10–20 % of HCCs can be hypovascular [44]. These tumors are typically smaller in size or well differentiated HCCs, with lack of sufficient neovascularization and hepatic arterialization. On the contrary, extremely large and/or infiltrative HCCs may appear hypovascular on arterial phase with more delayed, heterogeneous enhancement.
Extracapsular invasion in HCC is associated with poor prognosis and can be detected on MRI as projection of the tumor through the capsule with associated small satellite lesions [71].
Macrovascular invasion can be present in large, non-encapsulated HCCs, affecting the main and segmental portal and hepatic veins, with either absence of portal venous branches or an intraluminal space occupying mass with typically arterial enhancement and a filling defect on portal venous phase images (Figs. 3, 7). With the current imaging technology, there are no clear predictive findings of microvascular invasion in HCC [72].
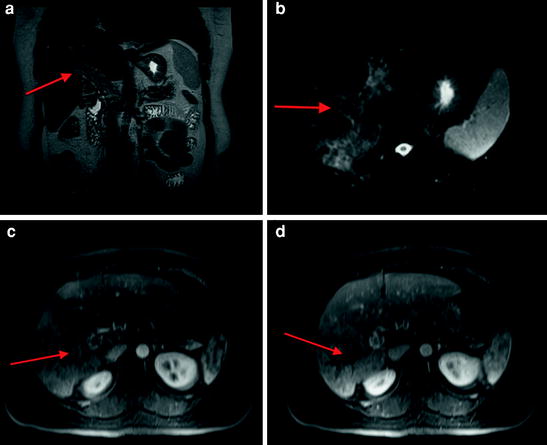

Fig. 7
MRI demonstrating infiltrative HCC with heterogeneous increased signal in the right hepatic lobe on coronal single shot turbo spin echo sequence with associated loss of flow void in the main portal vein (arrow a). Heterogeneous signal is also present on fat suppressed T2-weighted image with abnormal signal distending the portal vein (arrow b). There is heterogeneous arterial enhancement (arrow c) as well as tumor thrombus in the right portal vein (arrow d)
Emerging MRI Contrast Agents: Hepatobiliary Agents
Hepatobiliary contrast agents are taken up by hepatocytes and excreted into the biliary system [73]. Gadobenate dimeglumine (Gd-BOPTA, MultiHance, Bracco Diagnostics) and Gadoxetate disodium (Gd-EOB-DTPA, Eovist/Primovist, Bayer Healthcare) are the agents that are currently FDA approved in the United States, and used to evaluate hepatocellular function within hepatic lesions. Less than 5 % of administered dose of Gd-BOPTA and approximately 50 % of dose of Gd-EOB-DTPA are excreted in bile [73]. Each function as extracellular agents on the early post-contrast images, however are hepatocyte specific on delayed images (60–120 min for Gd-BOPTA and 10–20 min for Gd-EOB-DTPA) [74]. While further studies are necessary, preliminary results demonstrate that well differentiated HCCs often react similarly to normal hepatic parenchyma and are iso- to hyper- intense to liver on delayed hepatobiliary phases. This is in contrast to moderately and poorly differentiated HCC’s which do not retain hepatobiliary agents and are hypointense on delayed phases [73, 75] (Fig. 8). One study demonstrated that gadobenate dimeglumine–enhanced MRI had a sensitivity of 80–85% and a positive predictive value of 65–66 % for HCC detection [76]. The technique, however, is of limited value for detecting and characterizing lesions smaller than 1 cm in diameter [76]. Contrarily, a second study, utilizing Gd-EOB-DTPA in comparison to MDCT for preoperative detection of HCC, demonstrated that Gadoxetic acid-enhanced MRI and triple-phase MDCT have similar diagnostic performance in the preoperative detection of HCC, but MRI may be better than MDCT in the detection of HCCs smaller of equal to 1 cm in diameter [75]. Further studies are necessary and in progress.


Fig. 8
Contrast-enhanced MRI after the administration of hepatobiliary contrast agent (Gd-EOB-DTPA) demonstrating arterial enhancement (arrow a, subtracted arterial phase image), portal venous washout (arrow b), and lack of retention of contrast on 20 min delayed post-contrast hepatobiliary phase image (arrow c) compatible with HCC
5 Particular Forms of HCC
5.1 HCC in Non-Cirrhotic Liver
The overall prevalence of HCC in the non-cirrhotic liver has been reported between 6.7–54.0 % in hepatitis C [77]. HCCs in non-cirrhotic liver tend to be larger as well as advanced upon diagnosis as they were not likely to have undergone routine screening. They more classically tend to be solitary, well circumscribed lesions. Risk factors include HBV infection with or without HIV coinfection and the rare malignant transformation of hepatic adenomas into HCC. Biopsy should be obtained to confirm inconclusive imaging findings.
Additionally, fibrolamellar HCC is an uncommon malignant neoplasm of the liver which occurs in non-cirrhotic patients that has distinctive clinical, histologic, and radiographic features. It occurs in a younger population than does conventional HCC and is not associated with underlying liver disease or elevated serum AFP. Also, fibrolamellar HCC has a better prognosis than conventional HCC. Due to this, these patients are often treated more aggressively [78].
5.2 Treated HCC
Treatment of HCC is determined based on numerous factors ranging from lesion size, extent of liver disease, and tumor stage amongst others. Locoregional therapies include but are not limited to radiofrequency ablation (RFA), cryoablation, and transarterial chemoembolization (TACE). Evaluation for post procedure treatment success is essential for management decisions and prognosis [79].
5.2.1 Post-TACE Imaging
TACE involves selective embolization with chemotherapeutic agents mixed with Lipiodol. The Lipiodol is radiodense on CT and its distribution usually indicates foci of uptake within the tumor. Since viable tumor tissue is superimposed by Lipiodol artifacts in MDCT, MRI is mandatory for reliable decision making during follow-up after TACE procedures [80]. Lipiodol can cause transient T1 hyperintense signal intensity within the first 3 months after therapy as well as drop of signal on opposed phase sequences in regions of Lipiodol deposition [81]. Positive treatment response findings include increased T1 signal, decreased T2 signal, and lack of enhancement [82]. Post-contrast processed subtraction sequences are essential in the presence of T1 hyperintensity [83]. Even without decreased tumor size, presence of necrosis is a positive indicator of treatment response. Although definitive data have yet to be accumulated, a significant increase in ADC values with decreased diffusion restriction secondary to necrosis may be an early indicator of treatment response [84–86].
5.2.2 Post-RFA Imaging
The goal of RFA is to create an area of thermocoagulation with a diameter larger than that of the tumor. US is limited as the echogenicity of necrotic and viable tumor tissue may have a similar appearance on post-treatment images. As accessibility and usage becomes more widespread, contrast-enhanced US may be useful to differentiate tumor from necrosis [87]. Contrast-enhanced CT and MRI are considered standard modalities for evaluation post RFA. Findings from preliminary reports show that the size of the nonenhancing region depicted on CT and MR images corresponds to within 2 mm of the size of the coagulated necrosis measured histologically [88]. Optimal time for initial follow-up after therapy varies from 1–3 months where expected findings include uniform hypointensity on T2-weighted images and lack of enhancement on post-contrast T1-weighted images. Most RFA treated areas are hyperintense on T1-weighted images, likely due to hemorrhage and image subtraction is essential to assess for residual enhancement. Local regrowth tends to be detected at the periphery of the treated area either as irregular thickening of one margin or a new tumor nodule [89]. Hyperintense appearance on T2-weighted images with associated nodular enhancement is characteristic of tumor regrowth (Fig. 9). Care should be taken not to diagnose peripheral regrowth when a thin/regular (<1 mm) rim of progressive enhancement is present, a sign of simple vascularized inflammation [90].


Fig. 9
MRI demonstrating an HCC post radiofrequency ablation with expected hypointense signal on fat suppressed T2-weighted image (long arrow a). There is, however, a peripheral T2 hyperintense nodule (short arrow a) in addition to thick, nodular, arterial phase enhancement (long and short arrows b), and portal venous phase washout (long and short arrows c) compatible with viable tumor
5.2.3 Post Systemic Therapy
While in 30–40 % of patients HCC is diagnosed at early stages and is amenable to potentially curative treatments, such as surgery/locoregional therapy, disease that is diagnosed at an advanced stage or with progression after locoregional therapy has a dismal prognosis, owing to the underlying liver disease and lack of effective treatment options. Sorafenib (Nexavar, Bayer HealthCare Pharmaceuticals–Onyx Pharmaceuticals) is a small molecule that inhibits tumor-cell proliferation and tumor angiogenesis and increases the rate of apoptosis in a wide range of tumor models. Imaging of advanced HCC post systemic treatment with Sorafenib has been performed with both CT and MRI [91].
Stay updated, free articles. Join our Telegram channel

Full access? Get Clinical Tree


