Fig. 1
Age-standardized incidence rates of malignant brain tumors (males and females combined) per 100,000 persons in 2012 by country (GLOBOCAN)

Fig. 2
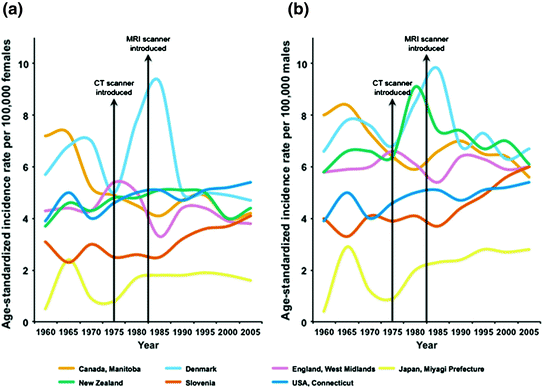
Age-standardized incidence rates of malignant brain tumor per 100,000 females (a) and per 100,000 males (b) from 1960 to 2005 (GLOBOCAN)
3 Survival After Diagnosis with Glioma
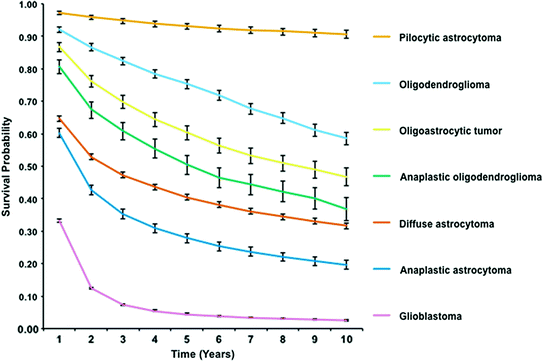
Survival time after diagnosis with glioma varies significantly by grade across all glioma subtypes (Fig. 3). GBM has the poorest overall survival, with <5 % of patients surviving 5 years after diagnosis [2]. Gliomas with an oligodendroglial component have increased survival when compared to those with an astrocytic component. See Fig. 3 for a comparison of relative survival from 1 to 10 years after diagnosis by selected glioma subtypes, from the National Cancer Institute (NCI) Surveillance, Epidemiology and End Results (SEER) system. Survival time is also strongly influenced by several omic markers within tumors, especially Isocitrate dehydrogenase 1/2 (IDH1/2) mutation, glioma-CpG island methylator phenotype (G-CIMP), O-6-methylguanine-DNA methyltransferase (MGMT) methylation, and 1p19q codeletion (See Chap. 4 for an in-depth overview of these markers).


Fig. 3
One through ten year relative survival (with 95 % confidence intervals) for selected glioma histologies from 1995 to 2010 (SEER)
The most conclusive and well-replicated prognostic factors for GBM are: extent of tumor resection, age at diagnosis, and Karnofsky performance status (KPS) [4, 5]. In 2004, the European Organization for Research and Treatment of Cancer (EORTC)/National Cancer Institute of Canada (NCIC) 22981/26981 presented results from their trial that demonstrated a survival benefit for GBM patients that received concurrent temozolomide with postoperative radiation, with median survival of 14.6 months for those receiving concurrent therapy versus 12.1 months for those who received only radiotherapy [6]. This treatment has since become the standard of care for primary GBM (See Chap. 7 for more information on current treatment for GBM), and several analyses have found statistically significant increasing trends in GBM median survival after this was established [7–9].
4 Heritable Genetic Risk Factors
Several inherited, monogenic Mendelian cancer syndromes are associated with increased incidence of specific glioma subtypes, including: Neurofibromatosis 1 (astrocytoma and optic nerve glioma) and 2 (ependymoma), tuberous sclerosis (giant cell astrocytoma), Lynch syndrome (GBM and other gliomas), Li–Fraumeni syndrome (GBM and other gliomas), melanoma–neural system tumor syndrome (all glioma), and Ollier disease/Maffucci syndrome (all glioma) [10]. However, these monogenic disorders account for only a small proportion of glioma cases (<5 % overall). A small proportion (about 5–10 % of tumors) of gliomas occur in familial clusters, where a patient has a family history of glioma. First degree relatives of patients with glioma have a twofold increased risk of developing a brain tumor, especially when the patient developed the tumor at a younger age [10]. Linkage studies within these familial glioma clusters have not definitely identified high-penetrance risk variants [2]. A recent attempt to replicate the findings of these studies found that only genes that were also discovered using GWAS were replicable [11].
In the absence of a clear pattern of risk variants, segregation analyses have determined that genetic risk factors for glioma are best explained with a polygenic model [12]. Until recently, most of the studies assessing genetic variants associated with risk of glioma were candidate gene studies, focusing on genes thought to be involved in gliomagenesis. Since advances in technology that now allow for rapid whole genome genotyping, five genome-wide association studies of glioma patients have been conducted [13–17]. Together these studies identified seven genomic variants that increased glioma risk. The variants and their respective genes are: telomerase reverse transcriptase (TERT, rs2736100) [13–15, 17, 18], epidermal growth factor receptor (EGFR, rs2252586 [11, 15, 17, 19], and rs11979158 [11, 15, 17, 19]), coiled-coil domain containing 26 (CCDC26, rs55705857) [14, 17, 19–21], cyclin-dependent kinase inhibitor 2B (CDKN2B, rs1412829) [13, 14, 22], pleckstrin homology-like domain, family B, member 1 (PHLDB1, rs498872) [14, 17, 23], tumor protein p53 (TP53, rs78378222) [16, 24, 25], and regulator of telomere elongation helicase (RTEL1, rs6010620) [13, 14, 17, 18]. Four of these variants (TERT, RTEL1, EGFR, and TP53) increase risk of all types of glioma, while only three increase risk for specific grades and histologies (CDKN2B, PHLDB1, and CCDC26). Both CCDC26 and PHLDB1 are associated with IDH-mutant tumors (predominately WHO grade II and III gliomas), whereas CDKN2B is associated with astrocytic tumors in general, WHO grades II–IV [2, 26]. The risk variant within CCDC26 (rs55705857), though rare in the control population (<5 %), increased odds of developing glioma with a magnitude that is comparable to that conferred by early onset BRCA1 mutations for breast cancer (OR: 3.1, 95 % CI: 2.5–3.9) [20]. The mechanism for increased risk associated with this variant is unknown [26].
Two of the variants that increase risk for all glioma types are in telomere-related genes (rs2736100 [TERT] and rs6010620 [RTEL1]). The single nucleotide polymorphism (SNP) identified within TERT (rs2736100) is also associated with increased risk for other types of cancer, including colon, lung, and testis. Telomere length has been associated with other types of cancer, but a recent case–control study has not found a significant overall association between this variant and risk of glioma [27]. The risk variants within these genes are more common among those with older age at diagnosis with glioma, which suggest that this telomere-based pathway may be a distinct mechanism of gliomagenesis.
Inherited mutations in TP53 contribute to the development of Li–Fraumeni syndrome [10], and the mechanism for its contribution to gliomagenesis is well understood [2]. The risk allele identified via GWAS (rs78378222) in TP53 is rare in the general control population (<1 %) and having this variant confers a 3x increase in risk for glioma. EGFR, TP53, TERT, and CDKN2A/B are genes that often acquire somatic changes during gliomagenesis, but more research is necessary to understand the relationship between germline and somatic changes in glioma [26].
5 Ionizing Radiation
Ionizing radiation can damage DNA by inducing both single- and double-strand breaks, and this DNA damage can induce genetic changes leading to cancer [28]. Exposure to therapeutic doses or high-dose radiation is the most firmly established environmental risk factor for glioma, and genetic factors influence the extent of risk from these exposures [2, 29–32]. Gliomas may present as early as 7–9 years after irradiation [32].
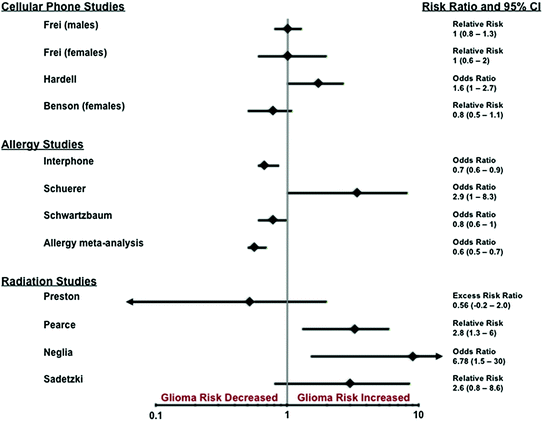
Studies of atomic bomb survivors were some of the first epidemiology studies to examine the relationship between radiation exposure and risk of malignancy. Preston et al. assessed the incidence of CNS tumors among survivors of the 1945 atomic bombings in Japan as a function of radiation dose. Tumors diagnosed between 1958 and 1995 among 80,160 survivors were ascertained using the Hiroshima and Nagasaki tumor registries, medical records, and death certificates [2, 33]. The risk for glioma was elevated, but not statistically significant, with an excess risk ratio (ERR) of 0.56 (95 % Confidence Interval [95 % CI]: −0.2–2.0) (Fig. 4).


Fig. 4
Results of selected, recent studies of potential risk factors for glioma
A long running study of 10,834 individuals treated for tinea capitis with irradiation in Israel (mean estimated dose of 1.5 Gy) was reported by Sadetzki et al. With 40 years of follow-up, glioma incidence doubled compared to population and sibling controls (relative risk [RR]: 2.6, 95 % CI: 0.8–8.6) (Fig. 4) [34]. A dose–response relationship was observed, with ERR/Gy of 1.98 (95 % CI: 0.73–4.6).
Several studies provide evidence that therapeutic ionizing radiation is associated with an increased risk of glioma, especially in children. Two studies of the Child Cancer Survivor Study (CCSS) found increased risk of brain and CNS tumor in children treated with therapeutic radiation. In a retrospective cohort study of children (n = 9,720) treated for acute lymphoblastic leukemia (ALL) according to the therapeutic protocols of the Children’s Cancer Study Group, between 1972 and 1988 [35] with a median follow-up of 4.7 years (range of 2 months to 16 years). Of 43 s neoplasms diagnosed, 24 were CNS neoplasms in children who had previously undergone irradiation [32]. This represented a 22-fold excess of CNS neoplasms, with 23 tumors occurring (including 17 gliomas whereas 1.06 were expected (p < 0.05). Neglia et al. also conducted an analysis of 5-year survivors within the CCSS cohort (n = 14,361) and identified subsequent primary CNS tumors in 116 persons (minimum 15 years of follow-up), including 40 gliomas (median latency of 9 years) [29]. Exposure to radiation therapy for primary cancer had an ERR of 0.33 (95 % CI: 0.07–1.71) and significantly increased odds of developing a subsequent glioma (Odds ratio [OR]: 6.78, 95 % CI: 1.5–30.0) (Fig. 4). In a case series of 1,612 children treated for newly diagnosed ALL between 1967 and 1988 at St. Jude’s Research Hospital, Walter et al. [36] found 11 gliomas (10 WHO grade III–IV, and 1 WHO grade II) diagnosed as second malignancies. There was a significant association between 20-year cumulative incidence of brain tumor and cranial irradiation (p = 0.015).
Results of epidemiological studies assessing brain tumor risk associated with diagnostic imaging radiation exposure have been inconsistent. The range of effective dose for a single CT scan is estimated to be between 2 and 15 mSv. Though the effect of this level of radiation exposure is likely extremely small, many patients undergo repeat CT scans. In the last two decades, there have been dramatic increases in the per capita dose of diagnostic radiation, which now makes up approximately half the per capita radiation exposure. Recently, a group of radiation experts came to the consensus that the lowest risk of x- or gamma irradiation for which there is significant evidence of increased cancer risk is about 10–50 mSv [37]. Epidemiology studies of diagnostic radiation exposures have provided inconsistent results with respect to overall brain tumor risk. Two case–control studies of adults have demonstrated increased risks specific to gliomas [38, 39], most recently after three or more cumulative CT scan exposures to the head only in cases with a family history of cancer [39].
This potential cancer risk may be particularly relevant in children, whose brains are still in the process of developing at the time of irradiation exposure. Two recent cohort studies of children experiencing CT scans in Britain [40] and Australia [41] have suggested increases in cancer, including brain cancer, after childhood exposures to CT scans. In Britain, Pearce et al. studied the excess risk of leukemia and brain tumors after CT scans in a cohort of children and young adults. A significant positive association was noted between CT scans and gliomas (p: 0.0033), with an ERR/mGy of 0.019 (95 % CI: 0.003–0.070) [40]. Children who received a cumulative dose of 50–71 mGy had a significantly increased risk of brain cancer when compared to those that received less than 5 mGy (relative risk [RR]: 2.82, 95 % CI: 1.33–6.03) (Fig. 4). While almost 60 % of the CT scans were of the brain and the elevated risks observed for other solid tumor sites appeared to be dose dependent, these data were not consistent with an increasing risk per unit dose for brain tumors in children. The data related to risk associated with diagnostic radiation exposure is currently inconclusive.
6 Allergies and Atopic Disease
Allergies have been reported to be protective against multiple cancer types, including glioma [42]. Although the majority of reports have found an association between allergies and atopic disease (e.g., eczema, psoriasis, asthma, hay fever) with reduced glioma risk, some studies have reported the opposite effect [2, 43]. It has been suggested that the observed protective effect may be due to increased surveillance by the innate immune system for those with allergies, but this potential mechanism has not been definitively proven.
The initial approach for investigating the association between allergies and glioma risk involved analysis of self-report allergy history. Numerous case–control studies have examined the relationship between allergies and glioma risk. A 2013 study conducted by Turner et al. analyzed data collected as part of the INTERPHONE case–control study, which included brain tumor cases gathered across four continents, including Europe and North America [44]. The INTERPHONE study was composed of CNS tumor cases (glioma, meningioma, and acoustic neuroma) and controls recruited over a 4-year period starting in 2000. The analysis of the 793 glioma cases and 2,374 control subjects showed a decrease in glioma risk when any history of allergy was reported (odds ratio [OR] = 0.73, 95 % CI = 0.60–0.88) (Fig. 4). The protective effect persisted when data were stratified by allergy type (asthma, hay fever, and eczema), with hay fever being the most significant (OR = 0.67, 95 % CI = 0.53–0.86). A meta-analysis of 12 studies published between 1990 and 2009 that involved 61,090 participants (including 6,408 glioma cases) showed a reduction in glioma risk associated with allergic conditions (summary OR = 0.60, 95 % CI = 0.52–0.69, p = 0.001) (Fig. 4) [45]. The reduction in risk was maintained when data were stratified by allergy type of asthma, eczema, and hay fever.
A meta-analysis of 12 studies published between 1990 and 2009 that involved 61,090 participants (including 6,408 glioma cases) showed a reduction in glioma risk associated with allergic conditions (summary OR: 0.60, 95 % CI: 0.52–0.69, p: 0.001) (Fig. 4) [45]. The reduction in risk was maintained when data were stratified by allergy type of asthma, eczema, and hay fever.
In addition to stratification by allergy type, a more detailed view can be obtained by stratification based on glioma subtype. Scheurer et al. [46] and McCarthy et al. [47, 48] have both examined the effect of antihistamine or anti-inflammatory usage on glioma risk by grade and histologic subtype. Scheurer et al. found both protective effects and increased risk depending on glioma grade and antihistamine/anti-inflammatory drug usage. The lack of asthma or allergy history combined with less than 10 years of anti-inflammatory use was found to have the greatest protective effect for GBM (OR = 0.55, 95 % CI = 0.35–0.88). Antihistamine usage for 10 years or more was shown to increase risk of anaplastic glioma regardless of asthma/allergy history (OR = 2.34; 95 % CI = 1.20–8.34 with history and OR = 2.94; 95 % CI = 1.04–8.34 without history) (Fig. 4). McCarthy et al. found no significant differences based on grade for the effect of antihistamine use (low grade glioma [LGG] OR: 0.78, 95 % CI 0.46–1.33, vs. high grade glioma [HGG] OR: 0.75, 95 % CI: 0.57 –0.99), or reported allergy (LGG OR: 0.44, 95 % CI: 0.25–0.76 vs. HGG OR: 0.66, 95 % CI: 0.49–0.87) [40].
Use of self-report data alone is unable to conclusively establish a relationship between a potential risk factor and development of glioma. Another approach that has been used in attempt to elucidate the relationship between allergies and glioma is to examine serum concentration of the immunoglobin E (IgE), a common measure of allergic response; this measurement can be elevated in those with allergies [49]. In an analysis of pre-diagnostic serum IgE levels from 594 glioma cases (374 GBM cases) and 1,177 controls from Janus Serum Bank in Oslo, Norway, Schwartzbaum et al. found a statistically significant reduction in glioma risk (OR = 0.75; 95 % CI = 0.56–0.99) in patients with total IgE > 100 kU/L compared to those with total IgE ≤ 100 kU/L (Fig. 4) [2, 50]. Analysis of GBM alone showed reduced risk, but this difference was not statistically significant (OR: 0.74, 95 % CI: 0.52–1.05). These findings were in contrast to a prospective study by Calboli et al. that did not find a statistically significant association with elevated IgE (>100 kU/L), but did find a protective effect of marginally elevated IgE of 25–100 kU/L [2, 51].
7 Cellular Phones
The risk of glioma associated with cellular phone use has been extensively investigated since the popularization of cellular phones in the 1990s. Several large-scale case–control studies have examined reported cell-phone usage patterns between persons with glioma and those without, and have found mixed results about the effect of cellular phone use on glioma risk [52]. The International Agency for Research on Cancer (IARC) conducted a thorough evaluation of the epidemiological findings of this research and classified radio frequency fields as a possible carcinogen (IARC group 2B) in 2011 [53]. This classification is largely due to findings published prior to this that demonstrate increased risk of glioma in heavy users (variably defined) of cellular phones. Also in 2011, the International Commission for Non-Ionizing Radiation Protection Standing Committee on Epidemiology reviewed the evidence presented by epidemiologic studies conducted up to that point, and found that the trend of these studies was against a relationship between cellular phone exposure and glioma risk [54].
Six studies examining the relationship between cellular phone use and glioma have been published since the IARC report: two cohort studies, one case–control study, and three studies comparing incidence rates over time [2]. Both cohort studies used cellular phone subscription records (in Denmark and the United Kingdom [UK]) and found no increase in glioma risk, including those who had used cellular phones for longer than 10 years or daily phone use. In the first of these cohort studies, Frei et al. examined 358,403 persons (including 3,664 glioma cases) in Denmark who had subscribed to cellular phone service prior to 1995, and found no statistical significant risk for both men and women with use over 10 years (Men RR = 1.0, 95 % CI = 0.8–1.3, Women RR = 1.0, 95 % CI = 0.6–2.0) (Fig. 4). Using the UK million woman study cohort, Benson et al. analyzed 791,710 women between 50 and 64, and found no statistical significant risk with greater than 10 years of use (RR = 0.8, 95 % CI = 0.5–1.1) (Fig. 4). A case–control study conducted by Hardell et al. using 593 malignant brain tumor cases and 1,368 controls found an increased risk for any use of cellular phone (OR = 1.6, 95 % CI = 1.0–2.7) and increased odds for heavy users (>2,736 hours of call time, OR = 2.8, 95 % CI 1.6–4.8) (Fig. 4).
Stay updated, free articles. Join our Telegram channel

Full access? Get Clinical Tree


