Abbreviations
- α-MSH α-Melanocyte–stimulating hormone
- ACTH Adrenocorticotropic hormone
- AGRP Agouti-related peptide
- ARC Arcuate nucleus of the hypothalamus
- BDNF Brain-derived neurotrophic factor
- BMI Body mass index
- CCK Cholecystokinin
- CCK-1R CCK 1 receptor
- CSF Colony-stimulating factor
- FFA Free fatty acid
- FTO Fat mass- and obesity-associated gene
- GI Gastrointestinal
- GLP1 Glucagon-like peptide 1
- IL-6 Interleukin 6
- LepR Leptin receptor
- LHA Lateral hypothalamic area
- MC4R Melanocortin-4 receptor
- MCP-1 Monocyte-chemoattractant protein-1
- NAFLD Nonalcoholic fatty liver disease
- NCEP National Cholesterol Education Program
- NEGR1 Neuronal growth regulator 1
- NHANES National Health and Nutrition Examination Survey
- NHLBI National Heart, Lung, and Blood Institute
- NTRK2 Neurotrophic tyrosine kinase, receptor, type 2
- NPY Neuropeptide Y
- OSA Obstructive sleep apnea
- PAI-1 Plasminogen-activated inhibitor
- PC-1 Proconvertase 1
- PCOS Polycystic ovarian syndrome
- POMC Pro-opiomelanocortin
- PVN Paraventricular nucleus
- PYY Peptide YY
- RYGB Roux-en-Y gastric bypass
- SH2B1 Adapter protein 1
- SOS Swedish Obese Subjects
- SIM1 Single minded 1
- STAT Signal transducer and activator of transcription
- T2DM Type 2 diabetes mellitus
- TMEM18 Transmembrane protein 18
- TNF Tumor necrosis factor-α
- WHO World Health Organization
Definition and Epidemiology
Obesity and overweight categories have been defined by examining longitudinal study data that associate a given weight with future adverse health effects. The currently accepted surrogate measure of body fatness is body mass index (BMI) which is measured as weight in kilograms divided by height in meters squared. For adults, a BMI <18.5 kg/m2 is underweight, 18.5 to 24.9 kg/m2 is healthy weight, 25.0 to 29.9 kg/m2 is overweight, and ≥30 kg/m2 is obese. For children and adolescents, a BMI between the 85th and 95th percentile for age and sex is considered at risk of overweight, and BMI at or above the 95th percentile is considered overweight or obese.
However, BMI does not account for ethnic differences in skeletal structure or musculature. Body frame size varies dramatically by race/ethnicity from small-framed East Asian adults to larger framed Pacific Islanders. Moreover, conventional cut-points for adult overweight (BMI ≥25 kg/m2) and obesity (BMI ≥30 kg/m2) do not correspond to similar absolute or relative metabolic risk in all ethnic group. As a result, the World Health Organization (WHO) and International Obesity Task Force proposed a lower BMI cut-point to define obesity in South and East Asian adults: 23 kg/m2 for overweight and 25 kg/m2 for obesity.
National surveys performed by the Centers for Disease Control and Prevention in the United States have found a significant increase in the prevalence of overweight and obesity over the past 30 years. In 2003 to 2004, according to data from the National Health and Nutrition Examination Survey (NHANES), 32.2% of adults were obese. Trends among adults have been tracked by repeat NHANES surveys, showing that the percent of overweight or obese have climbed from 47.0% in 1976 to 1980 to 66.2% in 2003 to 2004, and the prevalence of obesity alone has more than doubled from 15.0% to 32.9% overall. The prevalence of obesity was 45.0% among non-Hispanic blacks, 36.8% among Mexican Americans, and 30.6% among non-Hispanic whites.
The trends in obesity have been most striking among children and adolescents with two- to threefold increases in rates over the past three decades in all age groups. In the NHANES 2003 to 2004 survey, a total of 17.1% of US children and adolescents were overweight (BMI ≥95th percentile). Among children aged 2 to 5 years, the obesity prevalence increased from 5% in the 1976 to 1980 NHANES to 12.4% in 2003 to 2006 NHANES. Similarly, the prevalence in age 6 to 11 years increased from 6.5% to 17.0%, and for ages 12 to 19 years increased from 5% to 17.6% in the most recent national survey.
While the United States leads most of the world with high prevalence of overweight and obesity, these conditions are becoming more prevalent worldwide even in developing countries. In China, overweight prevalence in adults increased from 14.6% to 21.8% between 1992 and 2002, with greatest increases seen among men, urban residents, and high-income groups. In India, the prevalence of overweight ranged from 9.4% in rural men to 38.8% in urban women in 2003 to 2005.
Globally, according to a pooled analysis, in 2005 there were an estimated 937 million (95% CI, 922-951 million) overweight adults and 396 million (388-405 million) obese adults. Using conservative projections, by 2030 the number of overweight adults was estimated to be 1.35 billion and 573 million obese individuals without adjusting for secular trends. The authors warned that if recent secular trends continue unabated, the absolute numbers may total 2.16 billion overweight and 1.12 billion obese adult individuals. Among US residents, projections forecast that by 2030, 86.3% adults will be overweight or obese (51.1%) with black women (96.9%) and Mexican American men (91.1%) being most affected. Wang et al estimate that by 2048, all American adults would become overweight or obese, and in children, the prevalence of overweight (BMI ≥95th percentile) would almost double to 30%.
Several hypotheses have been proposed to explain the rapid rise in overweight/obesity in developed and developing countries. The simple explanations start with changes in lifestyle behaviors, primarily the lack of regular physical activity and increased caloric intake that tip the energy balance equilibrium. The reality of the factors promoting the obesity epidemic is clearly more complex and involves multiple layers of determinants including social norms and values, several sectors of influence from governmental to media to the food/entertainment industries, behavioral settings including the work/home/neighborhood environment, to individual factors that include genetic, socioeconomic, cultural, and psychosocial factors. In a novel social network analysis of the Framingham cohort, investigators found that weight status (gain, loss, or stability of weight) for an individual was highly influenced by his/her friends and family extending out to three degrees of separation. A multifaceted approach will be required to meaningfully curb the obesity epidemic globally.
Pathophysiology and Genetics of Obesity
Obesity is an increase of energy stored as fat that occurs when caloric intake exceeds caloric expenditure. What causes this imbalance is less clear, but recent advances in our understanding of the physiological systems responsible for the maintenance of energy stores in response to variable access to nutrition and demands for energy expenditure have provided some insights into the pathophysiology of obesity. The physiological system controlling food intake and energy expenditure is composed of (1) long-term and short-term afferent signals that allow for sensing the energy status of the individual; (2) integrating brain centers, most importantly within the hypothalamus, where the level of the efferent response is determined; and (3) efferent signals including those regulating the intensity of hunger and the level of energy expenditure.
One common misconception is that this physiological system is dedicated to the prevention of obesity. Instead this system’s essential role is in the prevention of starvation (ie, ensuring adequate energy intake to compensate for the energy requirements of basal metabolism, physical activity, growth, and reproduction). As a result, this physiological system is more strongly biased toward prevention of energy deficiency rather than excess storage.
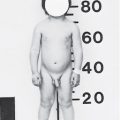
The major afferent signal allowing the brain to sense the level of energy stores is the hormone leptin. Discovered in 1994, this cytokine-like 167 amino acid protein is released by adipocytes. Under basal conditions the circulating levels of serum leptin are correlated with fat mass (r = 0.8) and decrease after weight loss. Decreasing leptin levels inform the brain of diminishing fat storage resulting from negative energy balance. This results in compensatory effects on appetite and energy expenditure, aimed at replenishing the stores and reestablishing energy balance. The role of leptin is best understood from the phenotype of rare cases of humans with complete leptin deficiency. Despite early-onset, extremely severe obesity, these patients show behaviors and physiological signs of starvation. This includes hyperphagia, decreased immune function, and hypogonadotropic hypogonadism. The latter reflects deficiency of the leptin signal informing the brain that sufficient energy stores are available for reproduction. Hormonal replacement of leptin-deficient patients corrects all these abnormalities, abolishing the hyperphagia leading to normalization of weight and maturation of the reproductive axis.
Leptin’s action is mediated by the leptin receptor (LepR). This receptor is a member of the class I cytokine receptor family which also includes the growth hormone, prolactin and erythropoietin receptors (see Chapter 1). These receptors have a single transmembrane domain and homodimerize upon binding of the ligand. Leptin binding to LepR leads to phosphorylation of the JAK2 receptor-associated kinase followed by recruitment and phosphorylation of the signal transducer and activator of transcription STAT3. Upon activation STAT3 dimerizes and translocates to the nucleus, where it activates transcription of target genes. The LepR is expressed in almost every tissue but only one of five isoforms, LepRb, contains the STAT3 recruitment domain. This isoform is expressed specifically in leptin-responsive brain regions.
In summary, leptin functions as a long-term signal of energy balance by informing the brain of changes in the level of energy stored as fat. A perceived decrease in leptin levels increases the amount of food consumed and minimizes energy expenditure. Leptin levels do not change with meals, and leptin does not acutely change meal size.
In addition to leptin, which represents a long-term adiposity signal, a number of other hormones, most of which are secreted by the gastrointestinal (GI) system, regulate appetite on a short-term basis (ie, in response to a meal) (Table 20–1). These hormones act on satiation (the feeling of fullness that contributes to the decision to stop eating) rather than on satiety (the prolongation of the interval until hunger or a drive to eat reappears). Some of these hormones have been shown to act on the same brain centers as leptin does. Altered secretion of or response to these GI hormones may directly contribute to the pathogenesis or the maintenance of obesity. Cholecystokinin (CCK) is secreted by duodenal I cells into the bloodstream. Its secretion is stimulated by the presence of fat and protein in the duodenum. CCK stimulates gut motility, contraction of the gallbladder, pancreatic enzyme secretion, gastric emptying, and acid secretion. CCK acts locally, stimulating vagal sensory nerves through the CCK 1 receptor (CCK-1R) and informs the brain that fat and proteins are being processed and will soon be absorbed. This message is conveyed to the hypothalamus via the hindbrain. Circulating CCK levels increase after meals and infusion of a CCK-1R agonist (CCK33), to postprandial levels, suppresses food intake. Conversely, infusion of a CCK-1R antagonist increases calorie intake. CCK is also a proximal mediator of the broader satiation process, attenuating meal-induced changes of more distal GI hormones, such as ghrelin and peptide YY (PYY).
| Main Site of Synthesis | Secretion Pattern | Effect on Food Intake | |
|---|---|---|---|
| Ghrelin | Gastric X/A-like cells | Increases prior to meal; decreased by food intake | Stimulates food intake |
| Cholecystokinin (CCK) | Proximal intestinal I cells | Stimulated by duodenal presence of fat and protein | Promotes meal termination and reduces meal size |
| Peptide YY3-36 (PYY) | Distal-intestinal L cells | Stimulated by presence of fat in the lumen | Reduces appetite and food intake |
| Glucagon-like peptide 1 (GLP-1) | Distal-intestinal L cells | Stimulated by presence of nutrients in the lumen | Short-term inhibition of food intake |
| Pancreatic polypeptide (PP) | Pancreatic F cells | Released in proportion to calories ingested | Reduces appetite and food intake |
Glucagon-like peptide 1 (GLP1) is a 30 amino acid peptide derived from the proglucagon gene. GLP1 is secreted into the bloodstream by the intestinal L-cells of the ileum and colon in response to the presence of nutrients in the lumen. GLP1 has a very short half-life (2 minutes), and is degraded by dipeptidyl peptidase-4. It increases insulin secretion in a glucose-dependent manner, decreases glucagon secretion, increases beta cell mass, inhibits gastric emptying, and decreases food intake. GLP1 is thought to signal through the hindbrain via stimulation of the GLP1 receptor (GLP1R) on the vagus nerve.
PYY, a 36 amino acid peptide is released into the bloodstream by intestinal endocrine L-cells of the distal gut (ileum and colon) after food ingestion and in response to the presence of fat in the lumen. PYY3-36, the major form of circulating PYY, binds to the hypothalamic NPY-Y2 receptor and reduces food intake. Obese individuals have lower PYY levels after a test meal than nonobese controls.
Ghrelin, a 28 amino acid octanoylated peptide, is secreted into the bloodstream by endocrine cells lining the fundus of the stomach. Ghrelin secretion is stimulated by fasting, increases preprandially, and is suppressed by food intake. Ghrelin is orexigenic, increasing food intake when administered peripherally, and acts in part by directly modulating the activity of the NPY (neuropeptide Y)/AGRP (agouti-related peptide) neurons in the arcuate nucleus of the hypothalamus.
The major challenge of adapting food intake to energy expenditure lies in the discontinuous availability of the first and the continuous and variable levels of the second required for survival, growth, and reproduction. The current prevailing model is that the concentration of circulating adiposity signals, primarily leptin, influences the response to short-term satiation signals thereby allowing for sufficient energy intake to maintain a constant level of stored energy. Genetic studies in mice and humans have outlined several critical neuronal populations and circuits that translate information provided by afferent circulating hormonal signals into neural responses that regulate appetite and energy expenditure. The primary locus for the integration of peripheral signals that influence energy balance is the hypothalamus (Figure 20–1). Specifically, two adjacent groups of neurons in the arcuate nucleus (ARC) of the hypothalamus, characterized by their production of specific neuromediators, act as the primary site in the brain for receiving the humoral signals that reflect body energy status. The AGRP/NPY neurons are orexigenic. They are inhibited by leptin and their activity is also modulated by GI hormones, such as ghrelin and PYY. The pro-opiomelanocortin (POMC) neurons are anorexigenic and are activated by leptin. In these neurons, POMC is processed by the specific proteases proconvertase-1 and proconvertase-2 to the anorexigenic neuropeptide α-melanocyte–stimulating hormone (α-MSH). Interactions between these neurons within the ARC allows for cross talk and modulation of the neuronal output.
Figure 20–1
Leptin-melanocortin system of energy balance. Information about the body’s energy stores is conveyed to the brain by hormones such as leptin. Leptin is secreted by adipocytes in proportion to the body’s fat mass. Leptin binds to its receptors on two populations of neurons in the arcuate nucleus of the hypothalamus: the orexigenic AGRP/NPY–expressing neurons, and the anorexigenic POMC-expressing neurons. These two groups of neurons have projections to the paraventricular nucleus of the hypothalamus, as well as to other regions of the brain. The PVN has a dense neuronal population that expresses MC4R. When leptin binds its receptors on POMC neurons., α-MSH, a cleavage product of POMC, is released. Activation of MC4R in the PVN by α-MSH relays a satiety signal and causes a decrease in food intake. AGRP is an antagonist of MC4R, and competes with α-MSH for binding to MC4R. Binding of AGRP to MC4R leads to increased food intake. Leptin activates POMC neurons and inhibits AGRP neurons. Therefore, by activating its receptors on these two neuronal populations, leptin acts in a concerted way to increase MC4R activation by α-MSH and decrease its antagonism by AGRP resulting in a net decrease in food intake. (α-MSH, α-melanocyte–stimulating hormone; AGRP, agouti-related peptide; ARC, arcuate nucleus; MC4R, melanocortin 4 receptor; NPY, neuropeptide Y; POMC, pro-opiomelanocortin; PVN, paraventricular nucleus; LepR, leptin receptor).
These first-order neurons send projections to second-order neurons in other regions of the hypothalamus, specifically the paraventricular nucleus (PVN) and the lateral hypothalamic area (LHA), as well as to the hindbrain. Both α-MSH and AGRP act on a common receptor, the melanocortin-4 receptor (MC4R) expressed on PVN neurons. α-MSH binds to and activates the melanocortin 4 receptor (MC4R) and by competing with α-MSH for the MC4R, AGRP inhibits MC4R-bearing neurons. The MC4R neurons then innervate neurons in other areas of the hypothalamus and brain stem to produce an integrated inhibition of appetite and increase in energy expenditure.