Fig. 2.1
Europe, 2012, head and neck cancers incidence. H&N = lip, tongue, oral cavity, pharynx, larynx, salivary glands, nasopharynx and nasal cavities (GLOBOCAN 2012 (IARC) – 2.11.2015)
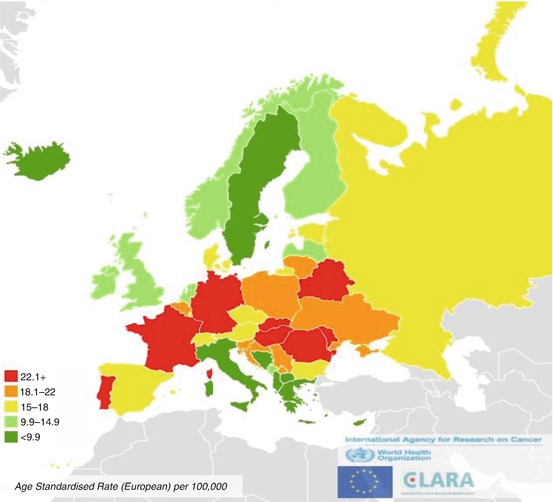
Fig. 2.2
Estimates incidence from cancer of lip, oral cavity, and pharynx in men, 2012
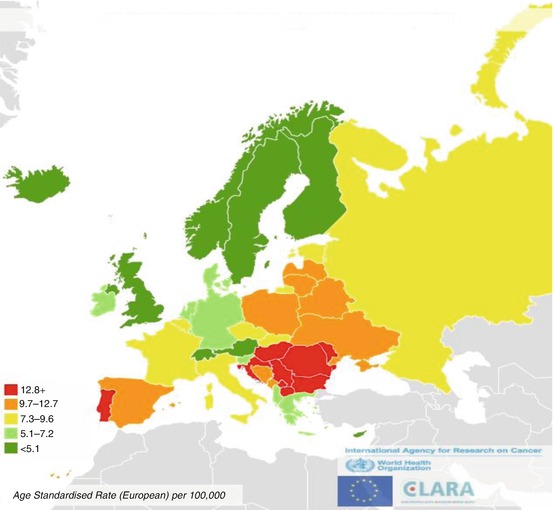
Fig. 2.3
Estimates incidence from laryngeal cancers in men, 2012
From 1995 to 2007, incidence rates increased significantly for lip, oral cancer, oropharynx and larynx cancers and it remained stable for all the other H&N (Table 2.1) [http://www.rarecarenet.eu/rarecarenet/].
Table 2.1
Head and neck cancers annual incidence rates (rate per 100,000), trend, 1995–2007, Europe
Cancer entity | Age-adjusted incidence rate per 100,000/year | ||
|---|---|---|---|
Period of diagnosis | |||
1995–1998 | 1999–2002 | 2003–2007 | |
Epithelial tumours of nasal cavity and sinuses | 0.36 | 0.37 | 0.37 |
Epithelial tumours of nasopharynx | 0.41 | 0.41 | 0.40 |
Epithelial tumours of major salivary glands and salivary-gland type tumours | 1.12 | 1.12 | 1.14 |
Epithelial tumours of hypopharynx | 0.90 | 0.95 | 0.93 |
Epithelial tumours of larynxa | 3.90 | 3.85 | 3.58 |
Epithelial tumours of oropharynxa | 2.12 | 2.41 | 2.73 |
Epithelial tumours of oral cavitya | 2.65 | 2.80 | 2.94 |
Epithelial tumours of lipa | 0.97 | 0.84 | 0.69 |
Figure 2.4 shows incidence and mortality rates for laryngeal cancer in the 20 highest, for incidence, European countries. The mortality incidence ratio was lowest in the Eastern countries, which are at high incidence rates. However, for other countries at high incidence, as Portugal, Spain and Belgium incidence mortality ratio was high, suggesting that in these countries management of patients with laryngeal cancers reached good outcome, differently from the Eastern countries. The same pattern was reported for the other H&N, for Europe.
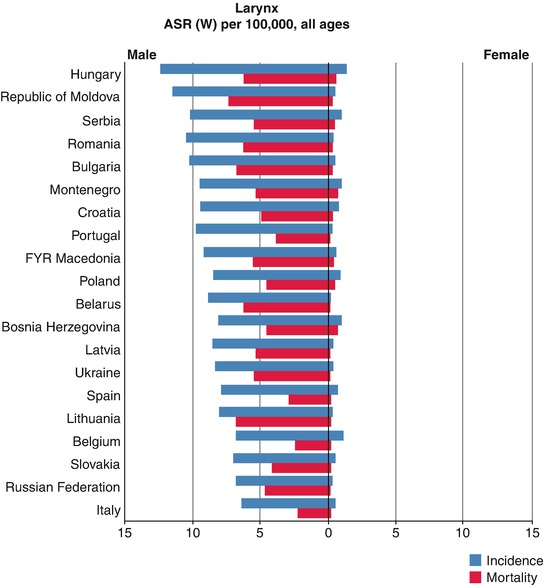
Fig. 2.4
Incidence and mortality, 20 highest in Europe, Larynx (GLOBOCAN 2012 (IARC) (4.11.2015)). ASR age-standardised rate (world)
Survival
In Europe, survival was analysed from about 240,000 H&N cases diagnosed in 1999–2007 collected by 86 population-based cancer registries, in 29 countries [4].
There are some differences between clinical and population-based survival studies.
Survival analyses from clinical series are crucial to evaluate the effectiveness of a specific treatment, whereas population-based studies evaluate the effectiveness of the heath care systems in a country or region.
In clinical studies, there is a selection of patients by hospital, age, stage, co-morbidity, etc., while in population-based studies, all cancer patients belonging to a demographically defined population (country, region, local area, etc.) are included.
Population-based survival studies estimate the average survival actually achieved in the general population. Clinical studies indicate the highest achievable survival in selected patient groups.
For the above reasons, descriptive survival figures are more properly taken from population-based than from clinical studies.
In population-based studies, the definition of cause of death cannot be easily assured, and survival is commonly expressed as relative survival, to assure a proper comparison across populations. Relative survival can be considered as the population-based counterpart of cause specific survival in clinical studies and is calculated as the ratio of observed survival to the survival that the patients would have experienced if they had had the same probability of dying as the general population, having the same age and sex. All the survival figures provided in this chapter are relative survival estimations and are taken from the recent results of EUROCARE-5 project. Furthermore, since populations can differ by age, and age is a prognostic factor, survival figure are standardised by age.
From Figs. 2.5, 2.6, and 2.7, 5-year relative survival is given by cancer site (tongue and lingual tonsil, oral cavity, oropharynx, nasopharynx, hypopharynx and larynx) and by country. Countries are ordered according to geographical region from North Europe to UK and Ireland, Centre, South and East of Europe, and different regions are highlighted by different grade of blue. Cases included in the analyses are those diagnosed between 2000 and 2007.
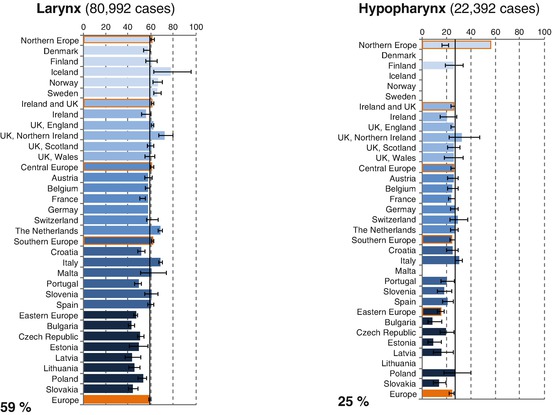
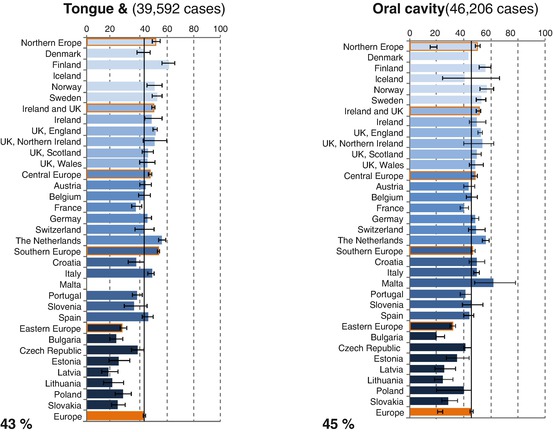
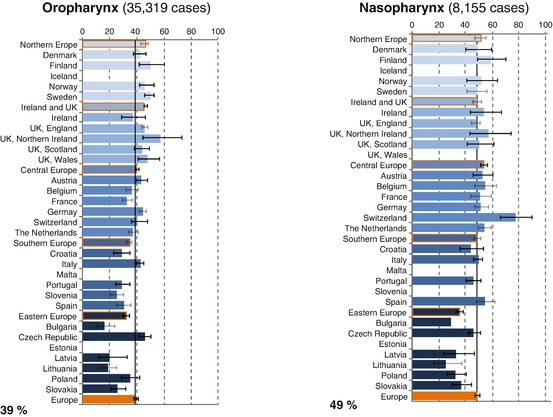
Fig. 2.5
Age-standardised 5-year relative survival for larynx and hypopharynx cancer cases diagnosed in 2000–2007, by European region, country and overall (Source: Gatta et al. [4])
Fig. 2.6
Age-standardised 5-year relative survival for tongue and lingual tonsil, and oral cavity cancer cases diagnosed in 2000–2007, by European region, country and overall (Source: Gatta et al. [4])
Fig. 2.7
Age-standardised 5-year relative survival for oropharynx and nasopharynx cancer cases diagnosed in 2000–2007, by European region, country and overall (Source: Gatta et al. [4])
Five-year survival was the poorest for hypopharynx and the highest for larynx cancers, 25 % and 59 %, respectively (Fig. 2.5). Survival for tongue or oral cavity cancer patients were similar, 43 % and 45 %, respectively (Fig. 2.6). Five-year survival was slightly better for nasopharynx (49 %) and worse for oropharynx (39 %) (Fig. 2.7). For all these H&N, survival significantly reduced with the increasing age: from 56 % in the youngest age group of 15–44 years of age to 34 % in the oldest age group 75 and more years old (Table 2.2). Five-year survival was significantly better in female than male: 36 % and 50 %, respectively (Table 2.3).
Table 2.2
Head and neck cancers survival (%) by age, cases diagnosed 2000–2007 in Europe
All cases | Numbers of cases | 1 year | 3 years | 5 years |
|---|---|---|---|---|
15–44 | 11,745 | 81.8 | 61.7 |  |
45–54 | 37,457 | 76.1 | 52.4 | |
55–64 | 43,612 | 73.4 | 49.7 | |
65–74 | 33,978 | 68.5 | 45.8 | |
75+ | 22,728 | 59.4 | 39.5 | |
Al1 adults | 154,520 | 68.8 | 46.7 | 39.9 |
Table 2.3
Head and neck cancers survival (%) by age and sex; cases diagnosed 2000–2007 in Europe
Male (74 %) | 1 year | 3 years | 5 years | |
|---|---|---|---|---|
15–44 | 8547 | 79.5 | 58.1 | 51.7 |
45–54 | 30,043 | 74.9 | 50.0 | 42.1 |
55–64 | 38,185 | 71.8 | 47.2 | 38.8 |
65–74 | 24,860 | 66.3 | 42.1 | 34.5 |
75+ | 12,161 | 57.6 | 35.9 | 30.3 |
All adults | 113,796 | 67.0 | 43.6 |  |
Female (26 %) | ||||
15–44 | 3198 | 88.8 | 72.4 | 68.0 |
45–54 | 7414 | 81.5 | 63.1 | 56.1 |
55–64 | 10,427 | 8l.0 | 61.4 | 54.3 |
65–74 | 9118 | 76.0 | 57.4 | 50.8 |
75+ | 10,567 | 62.2 | 45.0 | 40.1 |
All adults | 40,724 | 74.7 | 56.5 |  |
H&N survival disparities were reported in Europe: for all the considered cancers, 5-year survival was low in the Eastern countries (Figs. 2.5, 2.6, and 2.7).
Five-year survival increased for some of the H&N. Between 1999 and 2007, survival significantly improved for hypopharynx, tongue, oral cavity, oropharynx (Figs. 2.8, 2.9, and 2.10). Improvement was marginally significant for nasopharynx (Fig. 2.10); for larynx, 5-year survival remained stable (Fig. 2.8).
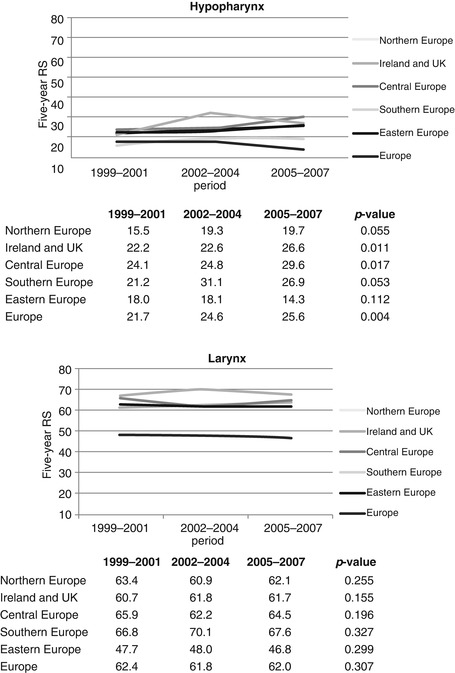
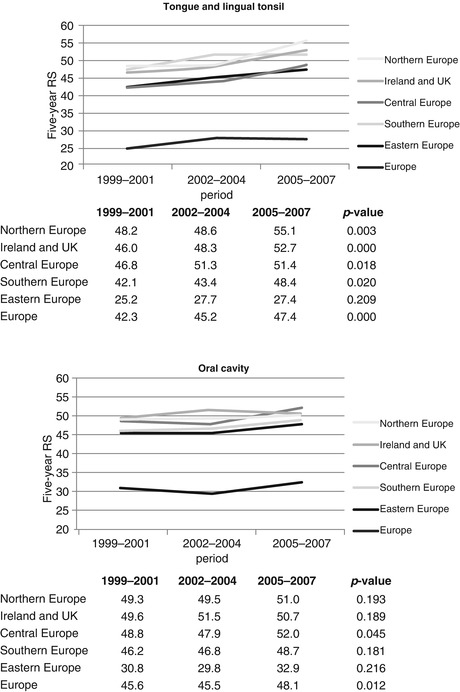
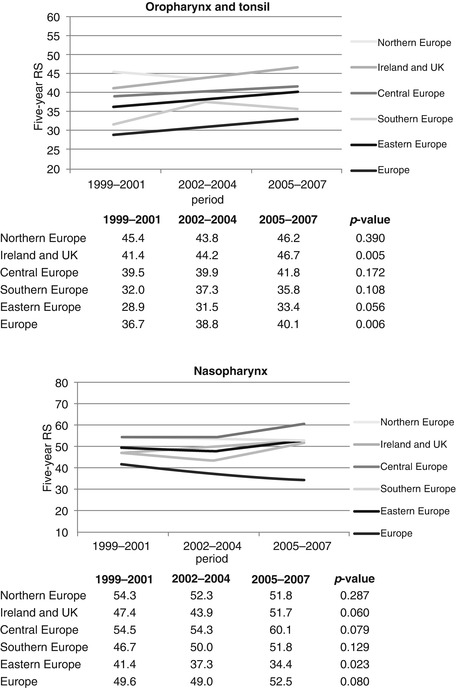
Fig. 2.8
Time trend in age-standardised relative survival (RS, %) for hypopharynx and larynx cancer patients across European regions, period 2005–2007 versus period 1999–2001 (Source: Gatta et al. [4])
Fig. 2.9
Time trend in age-standardised relative survival (RS, %) for tongue and lingual tonsil, and oral cavity cancer patients across European regions, period 2005–2007 versus period 1999–2001 (Source: Gatta et al. [4])
Fig. 2.10
Time trend in age-standardised relative survival (RS, %) for oropharynx and tonsil, and nasopharynx cancer patients across European regions, period 2005–2007 versus period 1999–2001 (Source: Gatta et al. [4])
To understand the impact on geographical differences of anatomical sub-site of origin of the lesion, the relative excess risk of dying (RER) was estimated by a model which included age, sex, country and sub-site. Tables 2.4, 2.5, and 2.6 show that for mouth-pharynx and larynx, after the inclusion of sub-site, as covariate, geographical disparities between countries slightly reduced. For larynx, with England as reference, all the northern countries, Germany, the Netherlands, Scotland, Italy, Slovenia and Spain were at lower risk, while Ireland and all the Eastern countries were at higher risk. For mouth-pharynx, the Nordic countries, Germany, Switzerland, the Netherlands and Italy were at lower, and Belgium, France, Slovenia, Spain and all the Eastern countries were at higher risk, again, considering England as reference. High risk was estimated, when comparing sub-sites, for hypopharynx, oropharynx and pharynx NOS, postcricoid region, with RER of 1.52, 1.53 and 1.62, respectively, with respect to the base of tongue, vallecular, and lingual tonsil (taken as reference) and the lowest for cheek plus vestibule of mouth (0.61) (Fig. 2.8). For larynx, all the anatomical sub-sites considered in the model (sovra- and sub-glottis), RERs were about three times higher than reference (glottis) (Fig. 2.9).
Table 2.4
Relative excess risks (RERs) of death by country for all mouth-pharynx sites by age and sex (Model 1) and by age, sex and sub-site (Model 2) compared with UK, England
Country | Model 1 | Model 2 | ||
|---|---|---|---|---|
RER of death | 95 % CI | RER of death | 95 % CI | |
Northern Europe | ||||
Norway | 0.88 | 0.83–0.95 | 0.89 | 0.84–0.96 |
Sweden | 0.86 | 0.81–0.90 | 0.87 | 0.83–0.91 |
Ireland and UK | ||||
Ireland | 1.04 | 0.96–1.11 | 0.99 | 0.92–1.07 |
UK, England | 1 (reference) | 1 (reference) | ||
UK, Northern Ireland | 0.96 | 0.87–1.07 | 0.93 | 0.84–1.03 |
UK, Scotland | 1.02 | 0.97–1.07 | 0.99 | 0.95–1.04 |
UK, Wales | 1.00 | 0.93–1.07 | 1.00 | 0.93–1.07 |
Central Europe | ||||
Belgium | 1.12 | 1.08–1.17
Related posts:Stay updated, free articles. Join our Telegram channel
Full access? Get Clinical Tree
 Get Clinical Tree app for offline access

| ||