Diffuse astrocytoma. (a) Axial FLAIR image shows an infiltrative mass with poorly defined margins spreading across the corpus callosum. (b) Axial postcontrast T1-weighted image shows no enhancement.
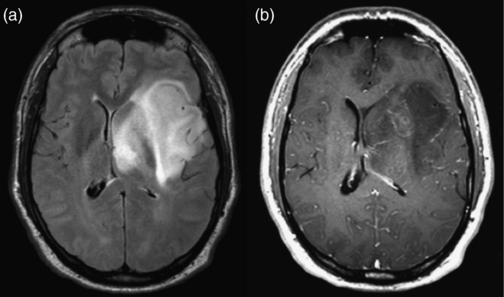
Anaplastic astrocytoma. (a) Axial FLAIR image shows a mass infiltrating through the left basal ganglia and into the cortex, with mass effect on the ventricles. (b) Axial postcontrast T1-weighted image shows ill-defined enhancement throughout the lesion.
Generalizations regarding contrast enhancement in diffuse astrocytomas and AA must not be embraced too dogmatically, however. It has been shown that there is significant overlap in enhancement patterns between diffuse astrocytomas and AAs: a significant minority of diffuse astrocytomas will show contrast enhancement, and the absence of contrast enhancement does not exclude AA. Thus, contrast enhancement is useful in helping to predict grade, but cannot replace biopsy for definitive grading.
Glioblastoma multiforme
GBMs represent the most malignant end of the spectrum of astrocytomas, and are the most commonly encountered primary brain tumors. Patients are typically older than with other gliomas, with a peak incidence in adults between 45 and 75 years of age. Although uncommon in infants and children, GBMs are occasionally found in this population as well. GBMs may arise de novo (primary GBM), or may develop due to progression of pre-existing, lower-grade gliomas. The hallmark pathological features of necrosis and vascular proliferation are reflected in the imaging appearance.
On T2-weighted imaging, extensive T2 signal due to tumor and edema is present in the great majority of cases, with ill-defined margins, and mass effect. Herniation of brain structures may be present. In some instances, patients may present early with small lesions or lesions where the T2 signal does not spread far from the margin of enhancement. In these cases, the diagnosis of an infiltrative glioma may not be anticipated based on the imaging features, and confirmation may only come after biopsy.
Contrast enhancement is almost always present in GBM, is avid in intensity, and will often demonstrate a rim of enhancing tissue surrounding a region of central non-enhancement. This so-called “ring enhancement” is the result of central necrosis as the increased metabolic activity of the neoplastic cells outstrips the available blood supply. The wall of the ring enhancement is most commonly irregular, with poorly marginated boundaries of the enhancement on both the inner and outer surface of the ring. Strand-like bands of contrast enhancement of variable thickness may be seen traversing the centrally necrotic area. This pattern, when present, may be helpful in distinguishing GBM from other diseases that may result in rim enhancement, such as metastases or abscess, which more commonly demonstrate a thin, regular wall and no internal septations. A smooth rim of enhancement, while less common, does not necessarily preclude the diagnosis of GBM. Enhancement in GBM may also be solid and nodular, without visible necrosis. Not uncommonly, new areas of enhancement may develop separately or even remotely from the site of original enhancement, sometimes without intervening areas of contiguous signal abnormality, reflecting the ability of the tumor to infiltrate into and through areas of the brain that appear normal on imaging.
The DWI characteristics of GBMs reflect their spatial variability as well. Some components of the tumor, particularly the lower-grade components and surrounding vasogenic edema, will show facilitated diffusion, or high ADC values. Within the more cellularly dense, higher-grade components of the tumor, however, there may be diffusion restriction, with ADC values lower than normal brain. Because enhancement correlates with increasing tumor grade, the areas of restricted diffusion will most commonly occur in regions of enhancement. In cases where ring enhancement is present, the central non-enhancing areas of necrosis will demonstrate facilitated diffusion (Figure 6.3). This pattern is helpful in distinguishing GBM from pyogenic brain abscesses, where there is diffusion restriction centrally within the abscess cavity due to the presence of pus.
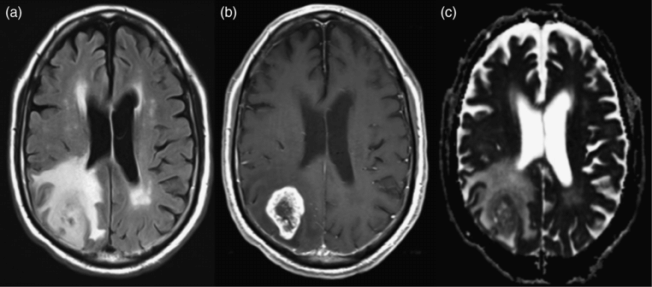
Glioblastoma multiforme. (a) Axial FLAIR image shows a right parietal infiltrative mass. (b) Axial postcontrast T1-weighted image shows a ring-like pattern of enhancement with irregular walls and central non-enhancement due to necrosis. (c) Axial ADC map shows facilitated diffusion (brighter areas) surrounding the enhancing portion of the tumor, due to a mix of vasogenic edema and tumor infiltration. The central necrotic portion also shows areas of facilitated diffusion. Lower values, represented by darker signal, are seen corresponding to the enhancing tissue due to the increased cellularity of the higher-grade portions of the tumor.
GBM is the most common primary brain tumor to cause spontaneous brain parenchymal hemorrhage, and hemorrhage may be the event that brings patients to clinical attention in some cases. On MRI, the appearance of blood will vary with time; a comprehensive review of the appearance of brain hematomas is beyond the scope of this text. In general, however, acute or subacute hemorrhage will appear as hyperintense (or isointense in the very early stages) on T1 precontrast images. The precontrast T1 images should therefore be evaluated in all imaging studies where contrast is administered to be sure that any bright signal seen on postcontrast imaging is actually related to contrast enhancement, rather than intrinsic T1 hyperintensity due to other factors such as hemorrhage. Gradient-echo T2* or susceptibility-weighted imaging will show hemorrhage as areas of dark signal, and is more sensitive than T1-weighted imaging for detecting small amounts of hemorrhage.
Although GBM usually spreads through the brain via local extension, dissemination through the cerebrospinal fluid can occur if the tumor reaches the surface of the brain or the margin of the ventricles. This can result in dissemination of tumor cells along the surfaces of the neuraxis, including within the ventricles, along the surfaces of the brain, and it can also result in “drop metastases” along the surface of the spinal cord, which will be seen as linear or small nodular areas of enhancement. Hematogenous dissemination of GBM and direct invasion of GBM into the adjacent calvarium are extremely rare, although they have been previously reported.
Brainstem gliomas
In adults, astrocytomas are most commonly found in the cerebral hemispheres, whereas pediatric cases of astrocytoma have an infratentorial predilection, involving the cerebellum and brainstem most commonly. Adult gliomas involving the brainstem are encountered, however. Particularly when found in areas that are not amenable to biopsy, a presumptive diagnosis of glioma may at times be made based on imaging, without pathological confirmation, and in these locations may also be referred to by their anatomic location (e.g., pontine glioma, tectal glioma, optic glioma).
Brainstem gliomas have a slightly more variable appearance than their supratentorial counterparts, although an infiltrative, expansile appearance is common. Patterns of contrast enhancement should be interpreted with caution in brainstem tumors, where the presence or absence of enhancement generally correlates with tumor grade even less reliably than in supratentorial tumors.
Gliomatosis cerebri
Gliomatosis cerebri describes the presence of an infiltrative glial neoplasm involving three or more lobes of the brain, with this widespread infiltration out of proportion to mass effect.
Pathologic specimens from cases of gliomatosis cerebri most commonly show grade III astrocytic neoplasms. However, grade II astrocytic tumors and tumors of oligodenrocytic lineage can also be found. The imaging features of gliomatosis cerebri reflect this pathology, demonstrating an extensive T2 hyperintense lesion, often without enhancement or, in some cases, showing mild ill-defined or nodular enhancement (Figure 6.4). Because mass effect may not be a prominent feature, and the architecture of the underlying brain structures may not appear to be disrupted, this tumor may at times be mistaken for a diffuse disorder of white matter, rather than a primary neoplasm.
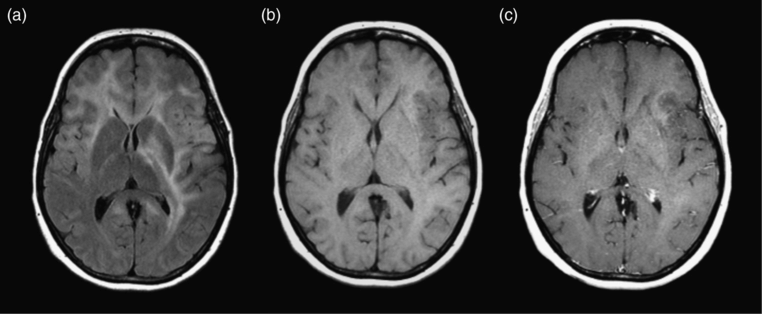
Gliomatosis cerebri. (a) Axial FLAIR image shows increased T2 signal in the bilateral frontal lobes, left basal ganglia, and left temporal and parietal lobes. The degree of mass effect is modest compared with the overall extent of the lesion. (b, c) Axial precontrast T1 and postcontrast T1-weighted images show no enhancement of the lesion. Biopsy showed diffuse astrocytoma (WHO grade II).
Oligodendroglioma
As the name implies, oligodendrogliomas arise not from astrocytes, but from oligodendrocytes, glial cells responsible for myelination of axons in the CNS. Oligodendrogliomas are WHO grade II neoplasms, and can exhibit indolent clinical features. They affect predominantly adults, with a peak incidence between 40 and 55 years of age.
Oligodendrogliomas demonstrate a predilection for the frontal and temporal lobes, with approximately 80–90% of these tumors arising from one of these two locations. Although many of the imaging features mimic those of a grade II astrocytoma, making them indistinguishable in many cases, there are a few distinct imaging features that may favor oligodendroglioma. The most specific feature demonstrated by some oligodendrogliomas is calcification. Histologically, microcalcifications are present in up to 90% of oligodendrogliomas. Macroscopic calcifications visible on imaging are much less common, but, when present, are highly suggestive of oligodendroglioma, as astrocytomas rarely demonstrate gross calcifications prior to treatment. On MR, calcifications will appear as areas of very low T2 signal, and may be highlighted on T2* imaging, where they will appear as areas of very low signal intensity. Although computed tomography (CT) generally plays a limited role in the modern imaging of brain tumors, it can be useful in this particular setting, as calcifications are very conspicuous on CT.
Another feature that may suggest the diagnosis of oligodendroglioma is prominent cortical involvement. Although both astrocytomas and oligodendrogliomas can infiltrate the cortical gray matter, oligodendrogliomas are more likely to be centered at or near the cortex on presentation, a fact that explains the propensity of these tumors to present clinically with seizures. Oligodendrogliomas also are more likely to appear on imaging to have well-defined borders compared with astrocytomas, although both are infiltrating lesions histologically. On T2, the appearance is otherwise in keeping with an infiltrative glial neoplasm, demonstrating increased signal that represents both tumor and vasogenic edema. Contrast enhancement is often absent, similar to its grade II astrocytic counterpart, but may be present in a greater proportion of low-grade oligodendrogliomas than in low-grade astrocytomas (Figure 6.5).
Anaplastic oligodendroglioma
Less common than grade II oligodendrogliomas, anaplastic oligodendrogliomas are characterized clinically by a more aggressive course and histopathologically by increasing hypercellularity, pleomorphism, and vascular proliferation. Anaplastic oligodendrogliomas may be difficult or impossible to distinguish from low-grade oligodendrogliomas, but generally show increased heterogeneity on T2-weighted images. As with AA, contrast enhancement increases the chance that a lesion is grade III, and should be targeted for biopsy.
DWI will, on average, demonstrate lower ADC values in AA compared with low-grade astrocytomas, although the difference between these two grades is not large enough to allow the use of a cutoff value capable of reliably discriminating individual grade II from grade III tumors. Like lower-grade oligodendrogliomas, calcification may present in anaplastic oligodendrogliomas (Figure 6.6).
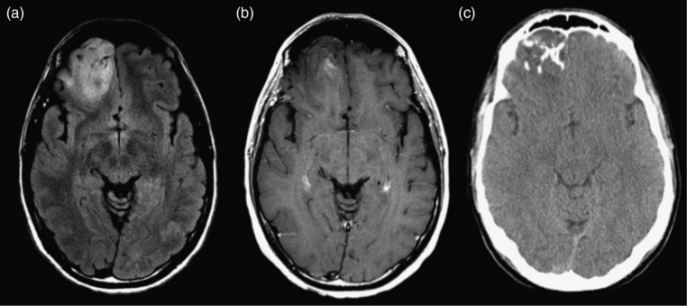
Anaplastic oligodendroglioma. (a) Axial FLAIR image shows a mass in the right frontal lobe with a close relationship to the cortex. (b) Axial postcontrast T1-weighted image shows a small amount of ill-defined contrast enhancement within the lesion. (c) Axial non-contrast CT shows coarse calcifications typical of oligodendrocytic tumors.
Occasionally both oligodendrocytic and astrocytic elements will be found within the same tumor. These tumors will be designated as oligoastrocytomas or anaplastic oligoastrocytomas, depending on their histological grade. The imaging appearance of these tumors is typical of infiltrating gliomas, and may mirror the imaging features of their pure astrocytic or oligodendrocytic constituent counterparts. Thus, they are not distinguishable from these other gliomas based on imaging alone.
Circumscribed gliomas
Circumscribed gliomas, also referred to as expansile gliomas, are generally lower grade than the infiltrative gliomas, and are found most commonly in children. However, presentation in young adulthood or even later in life does occur, and therefore these tumors will be briefly discussed in this chapter.
One might intuitively draw the conclusion that if grade II–IV astrocytomas represent disease along an increasingly malignant spectrum, grade I astrocytomas would represent the most benign end of the same spectrum, behaving with similar imaging and clinical behavior. In reality, however, circumscribed gliomas exhibit very different imaging and clinical features compared to infiltrative gliomas. Their margins are much better defined by imaging, and areas of T2 signal abnormality surrounding the mass, if present, typically represent vasogenic edema alone. Adjacent brain structures, including white-matter tracts, are typically displaced rather than infiltrated. The potential for progression to higher-grade tumors is limited. As a result, circumscribed gliomas typically demonstrate a more benign clinical course, can be potentially cured surgically (if located in a resectable portion of the brain), and carry an overall better prognosis than the infiltrative tumors.
Pilocytic astrocytoma
Pilocytic astrocytoma is a tumor predominantly found in children, typically in the cerebellum or in the structures surrounding the third ventricle, such as the optic pathways or hypothalamus. As a result, most of the data regarding pilocytic astrocytomas is derived from pediatric populations. However, pilocytic astrocytomas can uncommonly occur in adults, and can be found in the cerebellum as well as the supratentorial brain. On imaging, they appear as round or ovoid masses with a narrow zone of transition to the adjacent normal brain. Characteristically, they will demonstrate a solid, strongly enhancing nodular area. Pilocytic astrocytomas are commonly associated with a cystic component, which will appear as a non-enhancing component with marked T2 hyperintensity located within the tumor, sometimes surrounded by a thin rind of enhancing tumor separating it from the adjacent brain. These cystic areas are due to secretion of fluid by the tumor, not necrosis. If there is a single dominant cystic cavity, the enhancing tissue and the cyst together can produce the classic “cyst with a mural nodule” appearance (Figure 6.7). The cystic components not uncommonly can be found interspersed within a solid nodule of tissue, or may be absent altogether; the absence of a cyst should not exclude consideration of a pilocytic astrocytoma when the imaging features are otherwise suggestive. On DWI, pilocytic astrocytomas typically show facilitated diffusion (i.e., high ADC values). Calcification and hemorrhage are typically absent.
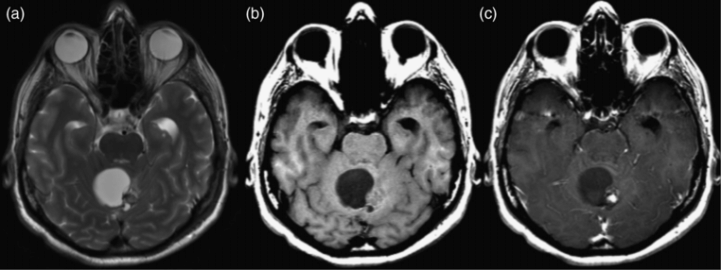
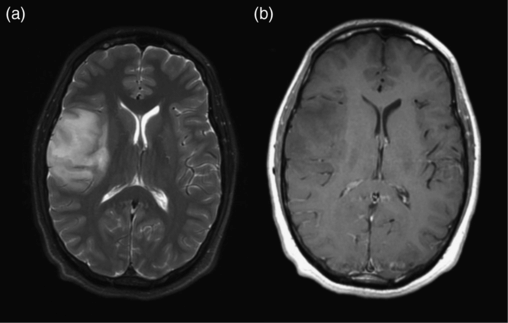
Pilocytic astrocytoma in a 49-year-old man. (a) Axial T2-weighted image shows a cystic mass in the cerebellum with a solid nodular component along the left aspect of the lesion. (b, c) Axial precontrast and postcontrast T1-weighted image shows avid enhancement of the nodule.
Pleomorphic xanthoastrocytoma
Pleomorphic xanthoastrocytoma (PXA) is a glial tumor most commonly classified as WHO grade II. The majority of PXAs show histologically circumscribed margins, although a minority can demonstrate areas of infiltration into the adjacent parenchyma. Found most commonly in patients less than 30 years of age, PXAs are usually cortically based and typically present with seizures.
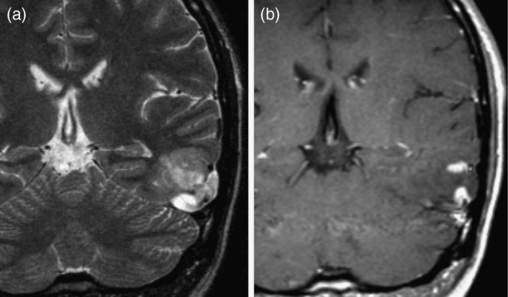
On imaging, they appear as a nodular or multinodular enhancing mass, usually with a cystic T2 hyperintense component. They characteristically will show involvement of the leptomeninges overlying the affected cortex (Figure 6.8). The majority of PXAs are located in the temporal lobe, although involvement of other lobes is possible. They may be associated with areas of adjacent cortical dysplasia. Resection is usually curative, although local recurrence or dissemination in the cerebrospinal fluid can rarely occur.
Imaging gliomas after treatment
Surgery
Assessment of any postoperative scan must begin with an evaluation of the preoperative scan. It is very difficult – in some cases, impossible – to correctly interpret findings on a postoperative imaging study if it cannot be compared to the preoperative appearance of the tumor, taking into account the results of the pathological examination and diagnosis. There are many situations where absence of the preoperative scan and/or pathologic diagnosis may lead to incorrect assessment of the postoperative imaging findings.
In general, the first postoperative scan is useful to determine the extent of resection. In high-grade gliomas, the enhancing portions of the tumor visible on the preoperative scan should be assessed to determine if there is residual enhancing tissue present after surgery, or if new enhancing tumor is developing. However, there are other postoperative changes that may result in contrast enhancement that one should be familiar with. When possible, imaging should be performed within 24–48 hours of surgery in order to image before the development of granulation tissue, which will appear as enhancement along the cut surfaces of the brain. Band-like areas of enhancement may also develop within the cavity itself due to adhesions or granulation tissue. These are usually linear or stellate, as opposed to tumor, which usually occurs in the brain parenchyma itself and is nodular or ill-defined. Over time, benign postsurgical enhancement may remain static or decrease, and so any increasing areas of enhancement, particularly those in parenchyma not immediately adjacent to the resection cavity, should be viewed with suspicion. Postoperative dural enhancement subjacent to the craniotomy site typically develops, and should not be mistaken for tumoral enhancement.
On initial postoperative imaging, blood products are often present within the resection cavity. They are most commonly hyperintense on T1-weighted imaging and hypointense on T2-weighted imaging. In the early stages, the blood products may layer dependently in the cavity, at times forming a fluid–fluid level, but can also form localized clots in the non-dependent portion of the cavity. As long as there is no mass effect, the blood is confined mostly to the cavity, and is not located in the brain parenchyma (where it would be considered a brain parenchymal hemorrhage); these blood breakdown products are typically without consequence and will resolve with time. An important pitfall to consider regarding blood products is that, on a postcontrast T1 image, the postoperative blood products will still be visible and appear hyperintense, and could be mistaken for enhancement. For this reason, postcontrast T1-weighted imaging should never be interpreted without a precontrast T1-weighted series. Of note, it is not uncommon for the resection cavity itself to contract with time, and this should not be viewed as suspicious, unless that contraction is the result of mass-like tissue developing around the cavity, resulting in its collapse.
In the case of infiltrative gliomas, T2-weighted imaging must be cautiously interpreted following surgery, as areas of T2 signal can represent vasogenic edema, gliosis as a result of surgery, and/or residual non-enhancing tumor. Often the edema surrounding a large glioma will decrease after debulking, but some residual T2 signal abnormality usually persists, and must be followed over time to determine if it is enlarging or developing mass effect. For circumscribed gliomas, residual T2 hyperintensity surrounding a fully resected tumor can more confidently be interpreted as benign edema or gliosis, assuming the margins of the tumor were well delineated on preoperative imaging.
Changes in the brain parenchyma surrounding the resection cavity are also commonly seen after surgery. On the immediate postoperative scan, there is often a rim of restricted diffusion along the cut surface of the brain, representing cytotoxic edema. Ischemia in the brain parenchyma adjacent to the cavity may also be seen if a small branch vessel or penetrating vessel is injured intraoperatively, and these areas will also show restricted diffusion on the immediate postoperative scans. These changes are important to identify, as scans obtained weeks to months later may show enhancement in these regions due to the changes that accompany subacute infarction. If it is not recognized that there was perioperative ischemia in the brain parenchyma, the enhancement might be mistaken as evidence of tumor progression (Figure 6.9).
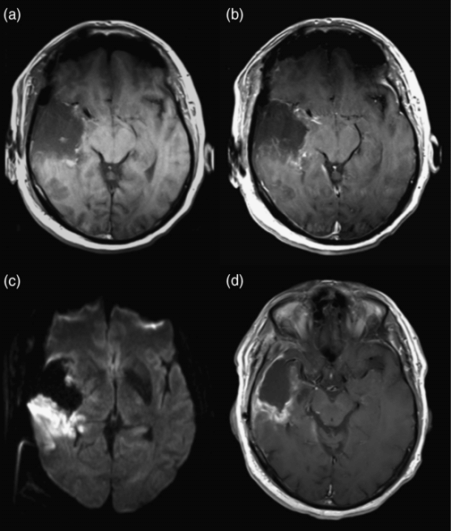
Postoperative ischemia resulting in delayed enhancement. (a) Immediate postoperative axial precontrast T1-weighted image shows a small amount of blood products at the margins of the resection cavity. (b) Immediate postoperative axial postcontrast T1-weighted image shows no suspicious parenchymal enhancement. (c) Immediate postoperative diffusion-weighted image shows restricted diffusion (bright signal) posterior to the resection cavity, indicating acute ischemia. (d) 2-month follow-up axial postcontrast T1-weighted image shows enhancement in the previously infarcted area. This enhancement could have easily been mistaken for progression if the immediate postoperative scan had not been available.
Radiation
Standard treatment for high-grade gliomas includes surgery followed by radiation therapy and chemotherapy. Following the incorporation of radiation into this algorithm, a variety of treatment-related changes have become increasingly recognized, and these changes may radiographically mimic the appearance of progressive tumor.
Changes following radiation can be divided into three stages based on the onset relative to the therapy: acute, early-delayed, and late. The term “pseudoprogression” has been used to describe the changes seen in the early period following radiation therapy, while late changes are typically due to radiation necrosis and radiation-induced white-matter injury.
Pseudoprogression
Pseudoprogression represents a transient inflammatory response that typically occurs within the first 2–3 months after radiation therapy, but has been observed as far out as 6 months in some cases. Awareness and recognition of this condition have increased significantly with the increased use of concomitant radiation and temozolomide therapy. Pathologically, pseudoprogression is characterized by changes in vascular permeability with resultant breakdown of the blood–brain barrier. Factors including endothelial injury, delayed myelin synthesis, and the release of hypoxia-induced mediators may play a role. Clinically, however, patients may be asymptomatic.
On imaging, pseudoprogression is characterized by transient increased enhancement on postcontrast T1-weighted images. This can produce a diagnostic dilemma, as progressive enhancement can also be seen with tumor progression. Currently, it is not possible to prospectively distinguish pseudoprogression from true progression on the basis of conventional MRI sequences alone.
Pseudoprogression is likely common, although the exact incidence remains the subject of debate due to the difficulty of obtaining definitive proof in all cases. Authors have reported varying incidences of pseudoprogression, but it is commonly felt to be present in 20–30% of patients after treatment. Among the subset of patients who demonstrate new enhancement in the early postradiation time period, up to 65% may represent cases of pseudoprogression. The incidence of pseudoprogression is likely higher in patients whose tumor cells show low levels of O6-methylguanidine-DNA methyltransferase (MGMT) expression due to methylation of the MGMT promoter. Although pseudoprogression may be suspected on an individual imaging study, currently the diagnosis is established in most patients in a retrospective fashion on the basis of follow-up imaging. Accordingly, caution should be exercised in interpreting imaging results in the first 12 weeks after therapy.
Stay updated, free articles. Join our Telegram channel

Full access? Get Clinical Tree


